. 2020 Jul 1;130(7):3820-3832.
doi: 10.1172/JCI132249.

T follicular regulatory cells and IL-10 promote food antigen-specific IgE

Affiliations

T follicular regulatory cells and IL-10 promote food antigen-specific IgE

Markus M Xie et al. J Clin Invest. .

Abstract

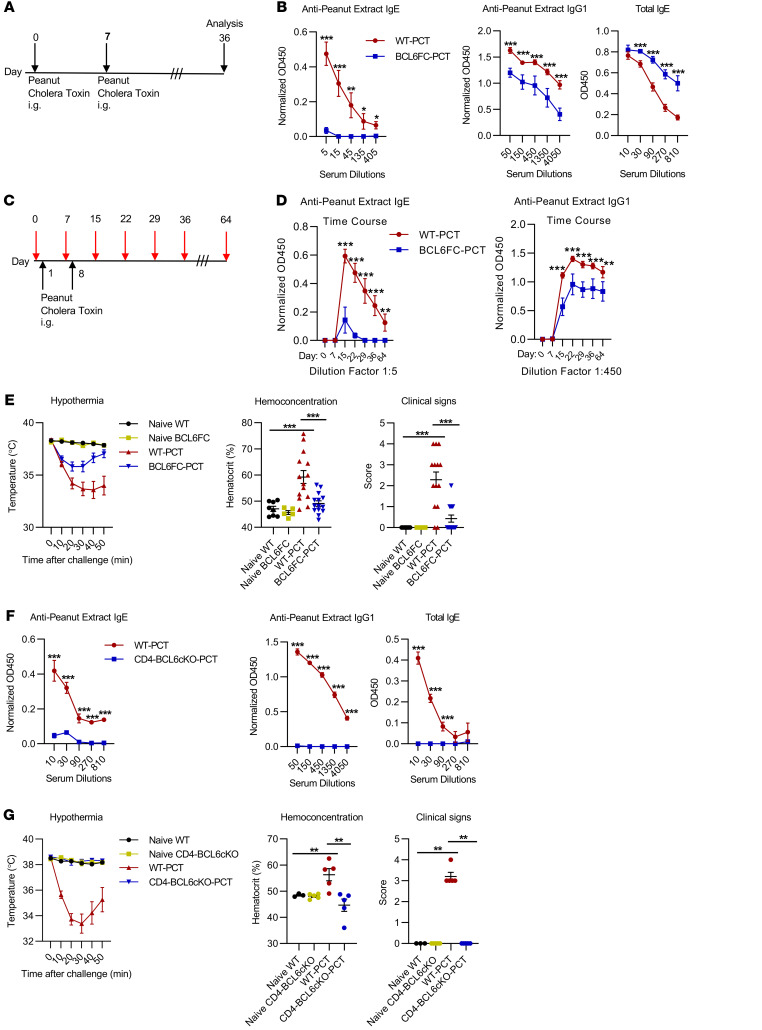
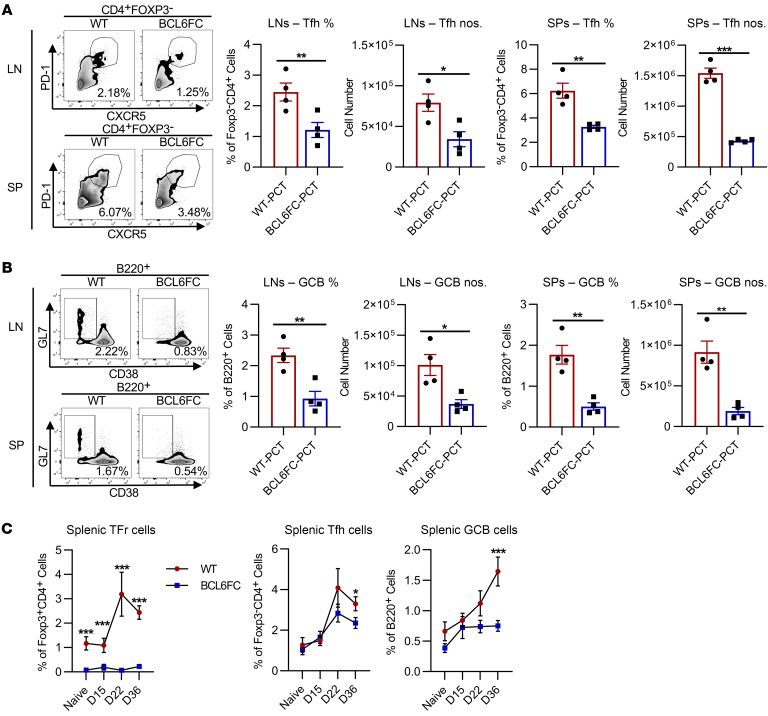
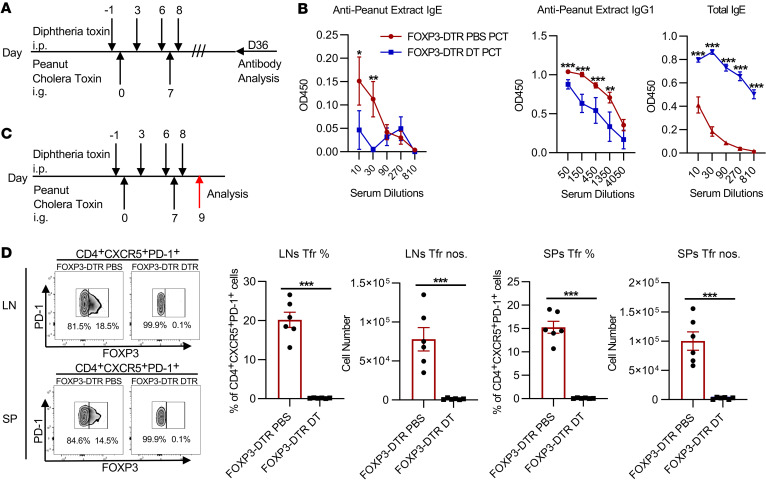
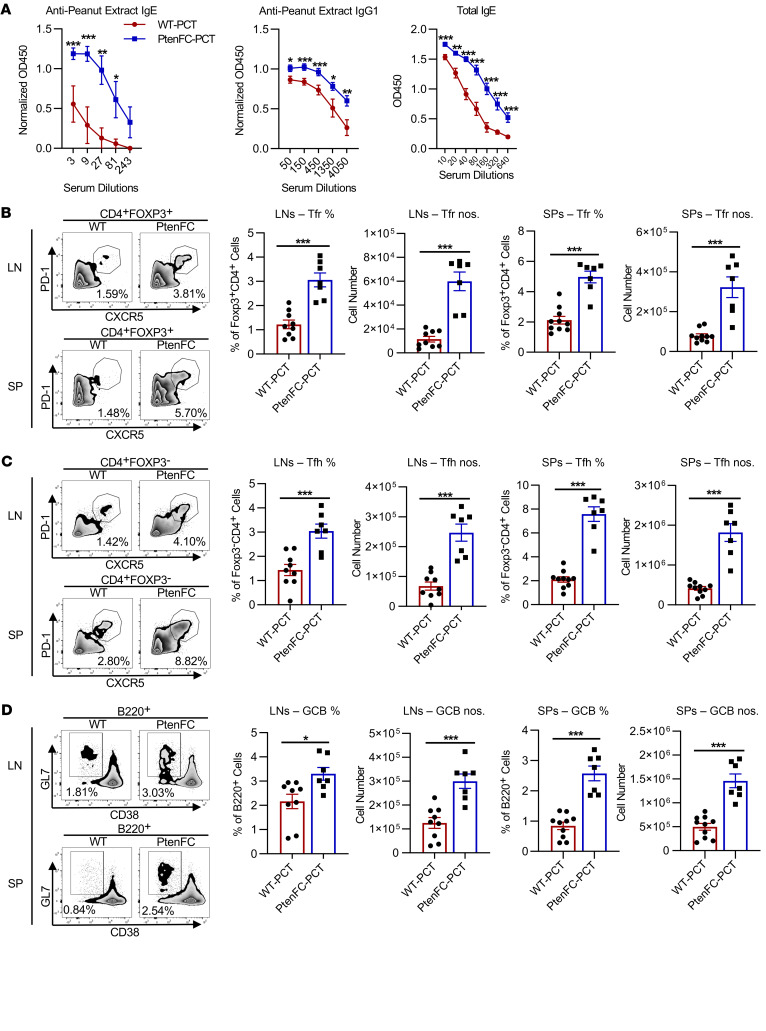
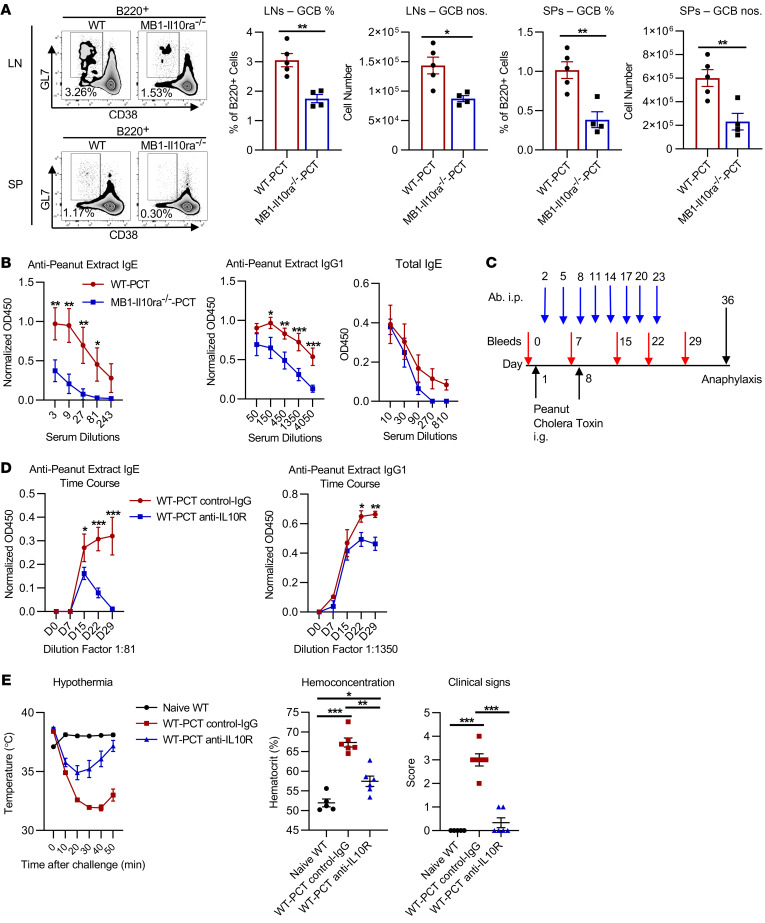
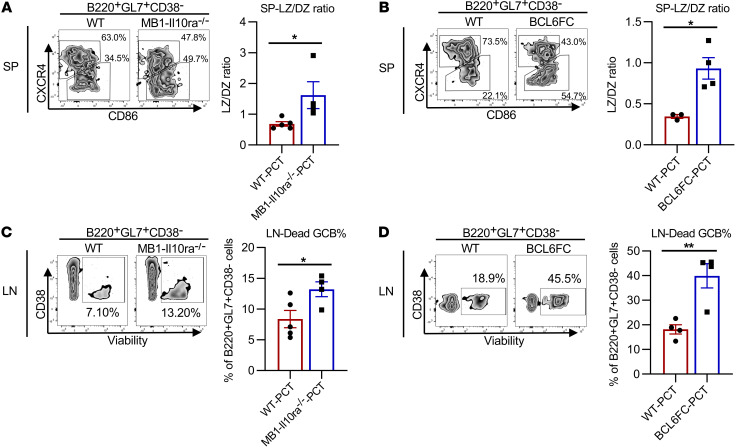
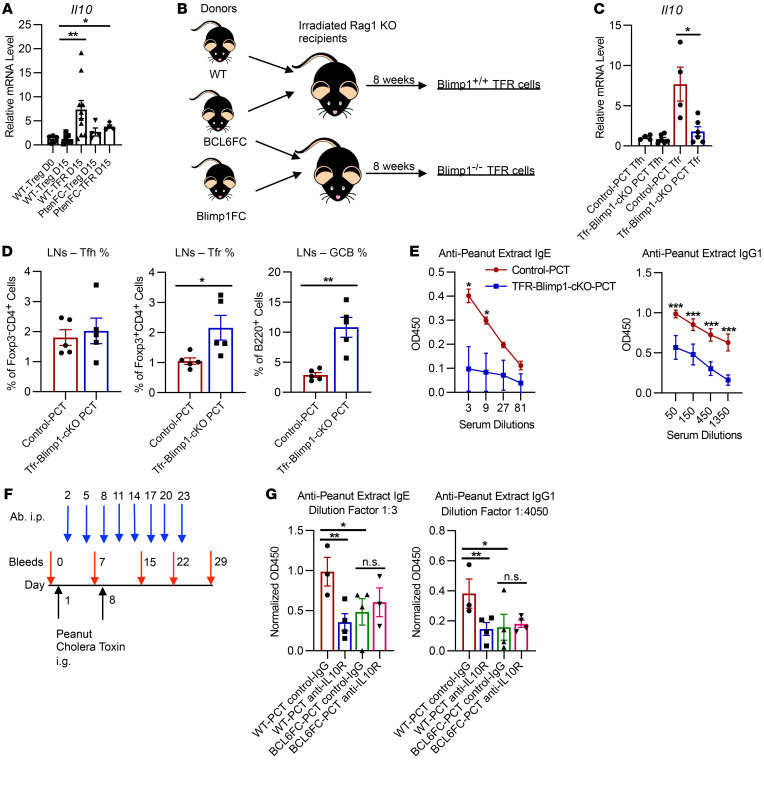
Food allergies are a major clinical problem and are driven by IgE antibodies (Abs) specific for food antigens (Ags). T follicular regulatory (Tfr) cells are a specialized subset of FOXP3+ T cells that modulate Ab responses. Here, we analyzed the role of Tfr cells in regulating Ag-specific IgE using a peanut-based food allergy model in mice. Peanut-specific IgE titers and anaphylaxis responses were significantly blunted in Tfr cell-deficient Foxp3-Cre Bcl6fl/fl mice. Loss of Tfr cells led to greatly increased nonspecific IgE levels, showing that Tfr cells have both helper and suppressor functions in IgE production in the germinal center (GC) that work together to facilitate the production of Ag-specific IgE. Foxp3-Cre Ptenfl/fl mice with augmented Tfr cell responses had markedly higher levels of peanut-specific IgE, revealing an active helper function by Tfr cells on Ag-specific IgE. The helper function of Tfr cells for IgE production involves IL-10, and the loss of IL-10 signaling by B cells led to a severely curtailed peanut-specific IgE response, decreased GCB cell survival, and loss of GC dark zone B cells after peanut sensitization. We thus reveal that Tfr cells have an unexpected helper role in promoting food allergy and may represent a target for drug development.

Keywords: Adaptive immunity; Allergy; Immunology.


Conflict of interest statement

Conflict of interest: The authors have declared that no conflict of interest exists.

Figures

Figure 1
Figure 1. Lack of Tfr cells in a food allergy model leads to loss of peanut-specific IgE and decreased anaphylaxis responses.
Peanut allergy was induced with 2 i.g. doses of PCT given 7 days apart, and mice were bled at various time points after sensitization. (A) Schema showing the 36-day timeline, in which serum was tested 28 days after the last sensitization for peanut-specific Abs. (BD) Control Foxp3-Cre mice (WT) and Bcl6FC mice were sensitized as in A, and day-36 serum was tested for peanut-specific IgE, IgG1, and total IgE (B) or at various time points during and after sensitization as indicated (red arrows in C) (C and D). Data for A and B are from 1 representative experiment of 4 experiments with 4–5 mice per group. Data for C and D are from 1 representative experiment of 2 experiments with 4–5 mice per group. (E) WT and Bcl6FC mice sensitized as in A were analyzed for anaphylactic responses on day 36. Nonsensitized WT and Bcl6FC mice were used as negative controls. Data for E were pooled from 2 experiments with 3–7 mice per group (n = 6–14). (F and G) Control Bcl6fl/fl (WT) mice and CD4-Bcl6–cKO mice were sensitized as shown in A. (F) Day-36 serum was tested for peanut-specific IgE, IgG1, and total IgE. (G) Mice were tested for anaphylaxis as described in E. Data for F are from 1 representative experiment of 3 experiments with 4–5 mice per group. Data for G are from 1 representative experiment of 2 experiments with 3–5 mice per group. *P < 0.05, **P < 0.01, and ***P < 0.001, by 2-way ANOVA with Holm-Šidák multiple comparisons test (B, D, and F) or 2-way ANOVA with Tukey’s multiple comparisons test (E and G).
Figure 2
Figure 2. Tfr cells are required for normal Tfh and GCB cell numbers in a food allergy immune response.
WT and Bcl6FC mice were sensitized with PCT as in Figure 1, and then on day 36, mesenteric LNs and SPs were analyzed for Tfh cells (A) and GCB cells (B) by flow cytometry. (C) Time course of the Tfr, Tfh, and GCB responses after PCT sensitization. Data for C were pooled from naive mice (2 experiments), day 15 (2 experiments), day 22 (2 experiments), and day 36 (8 experiments), with 4–5 mice per group (n = 8–10). Day 15 (D15) = 7 days after sensitization; day 22 (D22) = 14 days after sensitization; day 36 (D36) = 28 days after sensitization. *P < 0.05, **P < 0.01, and ***P < 0.001, by 2-way ANOVA with Holm-Šidák multiple comparisons test (B) or 2-tailed Student’s t test (C).
Figure 3
Figure 3. Total Tregs and Tfr cells are required for Ag-specific IgE and IgG1 in a food allergy response.
(A and B) FOXP3-DTR mice were treated with DT as indicated to deplete Tregs, or given PBS as a control, and then sensitized with PCT as indicated and bled for serum peanut-specific IgE and IgG1 Abs on day 36. Data for B are from 1 representative experiment of 2 experiments with 4–5 mice per group. (C and D) FOXP3-DTR mice were treated with DT or PBS as a control, sensitized with PCT on days 0 and 7 as indicated, and then on day 9, draining mesenteric LNs and SPs were removed for analysis of CD4+FOXP3+PD-1+CXCR5+ Tfr cells. Tfr cells were quantitated as the percentage of FOXP3+ cells from CD4+CXCR5+PD-1+ T cells and absolute numbers per LN or SP. Data for D are from 1 representative experiment of 2 experiments with 4–6 mice per group. *P < 0.05, **P < 0.01, and ***P < 0.001, by 2-tailed t test (A and B) or 2-way ANOVA with Tukey’s multiple comparisons test (C).
Figure 4
Figure 4. Augmented Tfr cell development promotes higher IgE and correlates with increased GC responses after food allergy sensitization.
WT and PtenFC mice were sensitized with PCT as in Figure 1. On day 36 of the sensitization system, (A) serum was tested for peanut-specific Abs, and (BD) SPs and mesenteric LNs were analyzed for Tfr, Tfh, and GCB cells by flow cytometry as in Figure 2. Representative contour dot plots for each cell staining are shown along with graphs indicating the average percentage of cells as a fraction of the parental cell population and the total yield of cells. Data for A are from 1 representative experiment of 2 experiments with 3–5 mice per group. Data for BD were pooled from 2 experiments with 3–4 mice per group (n = 6–10). *P < 0.05, **P < 0.01, and ***P < 0.001, by 2-way ANOVA with Holm-Šidák multiple comparisons test (A) or 2-tailed Student’s t test (BD).
Figure 5
Figure 5. IL-10 promotes GCB cell levels and peanut-specific IgE, and therapeutic blockade of IL-10 during food allergy sensitization leads to loss of IgE.
(A) WT and MB1-Il10ra–/– mice were sensitized with PCT. On day 36, GCB cells from LNs and SPs were stained and analyzed by flow cytometry, and GCB cells from LNs and SPs were stained and analyzed by flow cytometry. Representative contour dot plots of GCB cell staining are shown along with graphs indicating the average percentage of GCB cells and total yield of cells. (B) Peanut-specific IgE and IgG1 titers from day-36 serum of WT and MB1-Il10ra–/– mice sensitized with PCT. Data for A and B are from 1 representative experiment of 3 experiments with 3–5 mice per group. (C) Schematic illustrating blockage of the IL-10R during PCT sensitization in female C57BL/6 WT mice. Numbers indicate the specific days for i.p. anti–IL-10R Ab treatment, i.g. PCT gavage, blood sampling, and anaphylaxis. Control mice received anti–HRP-IgG1 Ab. (D) Peanut-specific IgE and IgG1 titers from serum of control and anti–IL-10R mice treated as described in C at the indicated time points. (E) Anaphylaxis response of control and anti–IL-10R mice treated as described in C. Anaphylaxis analysis was performed as in Figure 1. Data for D and E are from 1 representative experiment of 2 experiments with 3–6 mice per group. *P < 0.05, **P < 0.01, and ***P < 0.001, by 2-tailed Student’s t test (A) or 2-way ANOVA with Holm-Šidák multiple comparisons test (B and D).
Figure 6
Figure 6. Altered GCB cell cycling and increased apoptosis in the absence of Tfr cells.
(A) WT and MB1-Il10ra–/– mice were sensitized with PCT. On day 36, GCB cells from SPs were stained and analyzed by flow cytometry for light zone (LZ) (CD86) and dark zone (DZ) (CXCR4) marker expression. Representative contour dot plots of GCB DZ/LZ cell staining are shown along with graphs indicating the average ratios of GCB LZ to GCB DZ cells. (B) WT and Bcl6FC mice were sensitized with PCT. On day 36, GCB cells from SPs were stained and analyzed by flow cytometry for LZ and DZ marker expression as in A. Representative contour dot plots of GCB DZ/LZ cell staining are shown along with graphs indicating the average ratios of GCB LZ to GCB DZ cells. Data for A and B are from 1 representative experiment of 2 experiments with 4–5 mice per group. WT and Bcl6FC (C) and MB1-Il10ra–/– (D) mice were sensitized with PCT. On day 36 GCB cells from LNs were stained and analyzed by flow cytometry for viability using eBioscience Fixable Viability Dye. Representative viability stains are shown along with graphs indicating the average percentage of GCB cell death. Data for A and B are from 1 representative experiment of 2 experiments with 4–5 mice per group. *P < 0.05 and **P < 0.01, by 2-tailed Student’s t test (AD).
Figure 7
Figure 7. Blimp1-controlled Tfr cell–derived IL-10 is required for peanut-specific IgE production.
(A) Il10 mRNA levels in Tregs or Tfr cells isolated from naive or PCT-sensitized WT mice on day 0 (naive) and day 15 as in the model shown in Figure 1. (B) Design for WT/Bcl6FC and Bcl6FC/Blimp1FC BM chimeras. (CE) Mice generated as in B were sensitized with PCT. Then on day 36, (C) Tfh and Tfr cells were isolated by FACS, and Il10 expression was analyzed by qPCR; (D) Tfh, Tfr, and GCB cells from LNs were stained and analyzed by flow cytometry as in Figure 2; and (E) peanut-specific IgE and IgG1 titers from day-36 serum obtained from mice after PCT sensitization were measured. Data for A were pooled from 3 different cell sorts with 2–4 mice per sort (n = 6–10). Data for CE are from 1 representative experiment of 2 experiments with 3–5 mice per group after PCT sensitization. (F) Scheme for blockade of IL-10R during PCT sensitization in WT and Bcl6FC mice. Numbers indicate the specific days for i.p. anti–IL-10R Ab treatment, i.g. PCT gavage, blood sampling, and anaphylaxis. Control mice received anti–HRP-IgG1 Ab. (G) Peanut-specific IgE (day 15) and IgG1 (day 29) titers from serum obtained from control and anti–IL-10R–treated mice as described in F. Data for F and G are from 1 representative experiment of 2 experiments with 3–4 mice per group. *P < 0.05, **P < 0.01, and ***P < 0.001, by 2-way ANOVA with Tukey’s multiple comparisons test (A, C, and G) or 2-tailed Student’s t test (D).

Similar articles

Cited by

References

    1. Victora GD, Nussenzweig MC. Germinal centers. Annu Rev Immunol. 2012;30:429–457. doi: 10.1146/annurev-immunol-020711-075032. - DOI - PubMed
    1. MacLennan IC. Germinal centers. Annu Rev Immunol. 1994;12:117–139. doi: 10.1146/annurev.iy.12.040194.001001. - DOI - PubMed
    1. Klein U, Dalla-Favera R. Germinal centres: role in B-cell physiology and malignancy. Nat Rev Immunol. 2008;8(1):22–33. doi: 10.1038/nri2217. - DOI - PubMed
    1. Crotty S, Johnston RJ, Schoenberger SP. Effectors and memories: Bcl-6 and Blimp-1 in T and B lymphocyte differentiation. Nat Immunol. 2010;11(2):114–120. doi: 10.1038/ni.1837. - DOI - PMC - PubMed
    1. McHeyzer-Williams LJ, Pelletier N, Mark L, Fazilleau N, McHeyzer-Williams MG. Follicular helper T cells as cognate regulators of B cell immunity. Curr Opin Immunol. 2009;21(3):266–273. doi: 10.1016/j.coi.2009.05.010. - DOI - PMC - PubMed

Publication types

MeSH terms