. 2020 Apr 7;16(4):e1007771.
doi: 10.1371/journal.pcbi.1007771. eCollection 2020 Apr.

Bayesian integrative analysis of epigenomic and transcriptomic data identifies Alzheimer's disease candidate genes and networks

Affiliations

Bayesian integrative analysis of epigenomic and transcriptomic data identifies Alzheimer's disease candidate genes and networks

Hans-Ulrich Klein et al. PLoS Comput Biol. .

Abstract

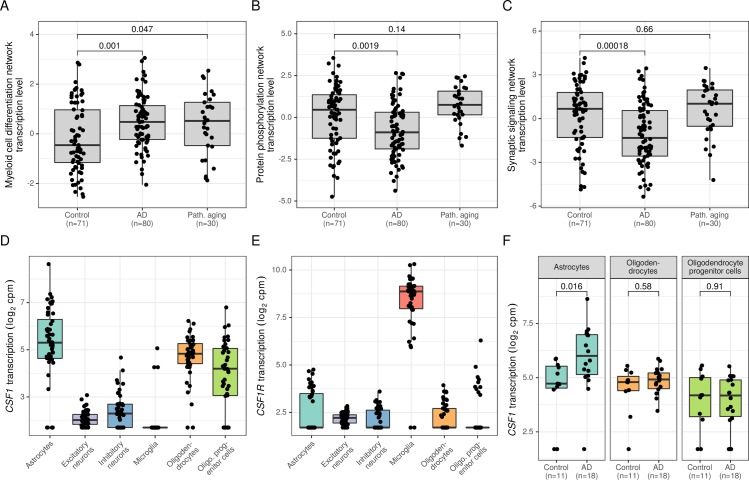
Biomedical research studies have generated large multi-omic datasets to study complex diseases like Alzheimer's disease (AD). An important aim of these studies is the identification of candidate genes that demonstrate congruent disease-related alterations across the different data types measured by the study. We developed a new method to detect such candidate genes in large multi-omic case-control studies that measure multiple data types in the same set of samples. The method is based on a gene-centric integrative coefficient quantifying to what degree consistent differences are observed in the different data types. For statistical inference, a Bayesian hierarchical model is used to study the distribution of the integrative coefficient. The model employs a conditional autoregressive prior to integrate a functional gene network and to share information between genes known to be functionally related. We applied the method to an AD dataset consisting of histone acetylation, DNA methylation, and RNA transcription data from human cortical tissue samples of 233 subjects, and we detected 816 genes with consistent differences between persons with AD and controls. The findings were validated in protein data and in RNA transcription data from two independent AD studies. Finally, we found three subnetworks of jointly dysregulated genes within the functional gene network which capture three distinct biological processes: myeloid cell differentiation, protein phosphorylation and synaptic signaling. Further investigation of the myeloid network indicated an upregulation of this network in early stages of AD prior to accumulation of hyperphosphorylated tau and suggested that increased CSF1 transcription in astrocytes may contribute to microglial activation in AD. Thus, we developed a method that integrates multiple data types and external knowledge of gene function to detect candidate genes, applied the method to an AD dataset, and identified several disease-related genes and processes demonstrating the usefulness of the integrative approach.


Conflict of interest statement

The authors have declared that no competing interests exist.

Figures

Fig 1
Fig 1. Matching different data types to genes.
(A) The figure shows an exemplary gene with four transcripts and their TSSs (small arrows), CG methylation probes (circles), and H3K9ac ChIP-seq reads (small dashes at the bottom) aligned to the genome (black double line). H3K9ac data is matched to transcripts by counting the number of reads in the promoter region (long blue and green lines below the genome). Since the promoter regions (±2.5 kbp around TSS) of the three blue transcripts overlap, the blue transcripts are merged and all ChIP-seq reads are added together. Transcipt-level expression values from RNA-seq data for the blue transcripts are summed accordingly, whereas the green transcript constitutes a separate feature in the final dataset. Methylation levels are calculated separately for promoter and exon methylation. Promoter methylation is calculated as the average methylation level of all probes in the 2 kbp upstream promoter regions of the transcripts (blue and green lines above the genome). Selected probes are indicated by blue and green circles (lower row). Similarly, exon methylation is calculated as the average methylation level of all probes in the respective transcripts’ exons (blue and green circles in the upper row). (B) Violin plots show the correlation between transcription data and H3K9ac, promoter methylation, and exon methylation respectively. Pearson correlation was calculated for each gene across the n = 233 subjects after removing the effects of technical variables, proportion of neurons, age and gender.
Fig 2
Fig 2. Sensitivity and specificity analysis.
(A) The sensitivity achieved by the Bayesian model on the simulated dataset (n = 92) is shown on the x-axis for various simulated differences Δ on the y-axis. The standardized effect size dC (Cohen’s d) is depicted next to the bars. (B) Sensitivity is plotted against 1—specificity as observed in the simulated data for the Bayesian model and six alternative approaches. (C) Sensitivity is plotted against 1—specificity observed when using a random gene network. For better comparison, the curve observed for the t-test identical as in (B) was added to the plot. (D, E) Sensitivity is plotted versus 1—specificity as in (B) using a smaller sample size of n = 46 (D) and n = 20 (E).
Fig 3
Fig 3. Validation of differential genes identified by the integrative analysis.
(A) The integrative statistic for 98 genes that were included in a targeted proteomic dataset is plotted on the x-axis versus the observed differences between AD and control cases in the protein data on the y-axis. Red color indicates genes that were detected as differential in the integrative analysis (n = 233 samples). Squares indicate significant differences in the protein data (n = 607 samples) at a family-wise error rate of 0.05. (B) Differences in gene transcription between AD and controls observed in the MSBB RNA-seq study (inferior frontal gyrus, n = 116 samples) are shown separately for genes identified as up- or downregulated in the integrative analysis. (C) Similarly, differences in gene transcription between AD and controls observed in the Mayo LOAD RNA-seq study (temporal cortex, n = 151 samples) are shown separately for genes identified as up- or downregulated.
Fig 4
Fig 4. Myeloid cell differentiation network.
(A) Graph shows the subnetwork of differential genes largely involved in myeloid cell differentiation. Color encodes the value of the integrative statistic from green (upregulated in AD) to red (downregulated in AD). Squares indicate significantly differential genes (99% credible interval). The gene NFIC is represented twice reflecting two alternative active promoters. (B) Boxplots depict the transcription levels of the subnetwork’s genes in each of five major brain cell types obtained from an external RNA-seq dataset of purified cell types. (C) Table shows the value of the integrative statistic E^i and the unadjusted p-value from the two external validation datasets for each significant gene in the subnetwork. The directionality in the validation studies (up- or downregulated in AD) is given if the p-value was less than 0.1.
Fig 5
Fig 5. Increased CSF1 transcription in astrocytes contributes to amyloid-β-related activation of the myeloid cell differentiation network.
(A) Boxplots show transcription levels of the myeloid cell differentiation network (first principal component) in control, AD, and pathological aging samples from the Mayo LOAD study (Wilcoxon rank-sum tests, unadjusted p-values). (B, C) Similarly, network transcription levels are shown for the protein phosphorylation network (B), and for the synaptic signaling network (C). (D, E) Boxplots depict transcription levels of CSF1 (D) and CSF1R (E) in six major human brain cell types measured in the prefrontal cortex from 48 individuals. (F) CSF1 transcription levels are shown separately for controls and AD cases in astrocytes, oligodendrocytes and oligodendrocyte progenitor cells (Wilcoxon rank-sum tests, unadjusted p-values).

Similar articles

Cited by

References

    1. Jack CR Jr., Bennett DA, Blennow K, Carrillo MC, Dunn B, Haeberlein SB, et al. NIA-AA Research Framework: Toward a biological definition of Alzheimer's disease. Alzheimers Dement. 2018;14(4):535–62. Epub 2018/04/15. 10.1016/j.jalz.2018.02.018 - DOI - PMC - PubMed
    1. Hasin Y, Seldin M, Lusis A. Multi-omics approaches to disease. Genome Biol. 2017;18(1):83 Epub 2017/05/10. 10.1186/s13059-017-1215-1 - DOI - PMC - PubMed
    1. De Jager PL, Ma Y, McCabe C, Xu J, Vardarajan BN, Felsky D, et al. A multi-omic atlas of the human frontal cortex for aging and Alzheimer's disease research. Sci Data. 2018;5:180142 Epub 2018/08/08. 10.1038/sdata.2018.142 - DOI - PMC - PubMed
    1. Allen M, Carrasquillo MM, Funk C, Heavner BD, Zou F, Younkin CS, et al. Human whole genome genotype and transcriptome data for Alzheimer's and other neurodegenerative diseases. Sci Data. 2016;3:160089 Epub 2016/10/12. 10.1038/sdata.2016.89 - DOI - PMC - PubMed
    1. Ritchie MD, Holzinger ER, Li R, Pendergrass SA, Kim D. Methods of integrating data to uncover genotype-phenotype interactions. Nat Rev Genet. 2015;16(2):85–97. Epub 2015/01/15. 10.1038/nrg3868 . - DOI - PubMed

Publication types