. 2020 Apr 7;14(4):e0008179.
doi: 10.1371/journal.pntd.0008179. eCollection 2020 Apr.

Predicting disease risk areas through co-production of spatial models: The example of Kyasanur Forest Disease in India's forest landscapes

Affiliations

Predicting disease risk areas through co-production of spatial models: The example of Kyasanur Forest Disease in India's forest landscapes

Bethan V Purse et al. PLoS Negl Trop Dis. .

Abstract

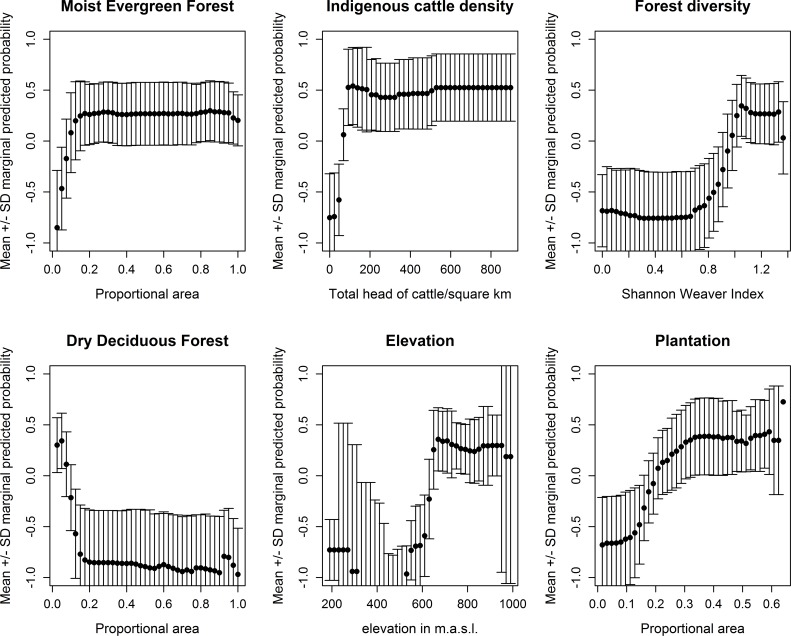
Zoonotic diseases affect resource-poor tropical communities disproportionately, and are linked to human use and modification of ecosystems. Disentangling the socio-ecological mechanisms by which ecosystem change precipitates impacts of pathogens is critical for predicting disease risk and designing effective intervention strategies. Despite the global "One Health" initiative, predictive models for tropical zoonotic diseases often focus on narrow ranges of risk factors and are rarely scaled to intervention programs and ecosystem use. This study uses a participatory, co-production approach to address this disconnect between science, policy and implementation, by developing more informative disease models for a fatal tick-borne viral haemorrhagic disease, Kyasanur Forest Disease (KFD), that is spreading across degraded forest ecosystems in India. We integrated knowledge across disciplines to identify key risk factors and needs with actors and beneficiaries across the relevant policy sectors, to understand disease patterns and develop decision support tools. Human case locations (2014-2018) and spatial machine learning quantified the relative role of risk factors, including forest cover and loss, host densities and public health access, in driving landscape-scale disease patterns in a long-affected district (Shivamogga, Karnataka State). Models combining forest metrics, livestock densities and elevation accurately predicted spatial patterns in human KFD cases (2014-2018). Consistent with suggestions that KFD is an "ecotonal" disease, landscapes at higher risk for human KFD contained diverse forest-plantation mosaics with high coverage of moist evergreen forest and plantation, high indigenous cattle density, and low coverage of dry deciduous forest. Models predicted new hotspots of outbreaks in 2019, indicating their value for spatial targeting of intervention. Co-production was vital for: gathering outbreak data that reflected locations of exposure in the landscape; better understanding contextual socio-ecological risk factors; and tailoring the spatial grain and outputs to the scale of forest use, and public health interventions. We argue this inter-disciplinary approach to risk prediction is applicable across zoonotic diseases in tropical settings.


Conflict of interest statement

The authors have declared that no competing interests exist.

Figures

Fig 1
Fig 1
(a) Map of India depicting the location of Shivamogga district (black shading) within Karnataka State (grey shading). (b) Map of Shivamogga district showing locations of households with human cases in black (2014–2018 seasons) and red (2018–2019 season). Amongst the 2018–2019 cases, closed red circles are affected households in Sagara taluka and open red circles are affected households in Tirthahalli taluka, whilst crosses are affected households from other talukas. The administrative boundary dataset is from HindudstanTimesLabs (https://github.com/HindustanTimesLabs/shapefiles/), reproduced under the MIT License. Note that Bhadravathi taluk, in the southeast corner of Shivamogga district, is omitted from the study.
Fig 2
Fig 2. Key landscape predictors of presence of Kyasanur Forest Disease (1 km resolution) overlaid with point locations of human cases from 2014 to 2018 (black dots).).
These are proportional areas of moist evergreen forest, dry deciduous forest, and plantation per grid cell and forest type diversity. These metrics were derived from analysis of the MonkeyFeverRisk LULC map (see S3 and S4 Files). The administrative boundary dataset is from HindudstanTimesLabs (https://github.com/HindustanTimesLabs/shapefiles/), reproduced under the MIT License. Human case data are from the Department of Health and Family Welfare Services, Government of Karnataka. White areas in Bhadravathi taluka in southeast corner indicate no data.
Fig 3
Fig 3. Other key predictors of presence of Kyasanur Forest Disease (1 km resolution) overlaid with point locations of human cases from 2014 to 2018 (black dots).
These are area of forest loss, densities of indigenous cattle and elevation derived from Hansen et al. [44], from the Department of Animal Husbandry, Dairying and Fisheries, Government of India Census 2011 data, and from Shuttle Radar Topography Mission data version 4 respectively (see S3 File). Note that area of forest loss did not improve the overall accuracy of models. The administrative boundary dataset is from HindudstanTimesLabs (https://github.com/HindustanTimesLabs/shapefiles/), reproduced under the MIT License. Human case data are from Department of Health and Family Welfare Services, Government of Karnataka. White areas in Bhadravathi taluka in southeast corner indicate no data.
Fig 4
Fig 4. Marginal response plots for key predictors of presence of human cases of Kyasanur Forest Disease, from models at a 1 km resolution (without forest loss as a predictor).
Fig 5
Fig 5. Predicted probability of presence of KFD from Boosted Regression Tree models containing landscape predictors (without forest loss) at a 1 km resolution.
Top panels give mean and standard deviation of the relative predicted probability of presence of KFD in each grid cell across model runs. Top left panel—areas in orange and red have a higher predicted probability of presence of KFD, whilst areas in blue have a lower predicted probability of presence of KFD. Top right panel–areas in yellow and red have more variable predictions of probability of presence of KFD than blue areas. Bottom left panel indicates the number of times KFD is predicted to be present in each cell across the 20 model runs, with orange and red indicating that KFD is often predicted to be present. Bottom right panel again depicts the mean predicted probability of presence but the locations of affected households are super-imposed, for the 2014 to 2018 seasons as open black circles and for the 2018 to 2019 season as open red circles. These raster maps are not under copyright since they are a product of this study. The administrative boundary dataset is from HindudstanTimesLabs (https://github.com/HindustanTimesLabs/shapefiles/), reproduced under the MIT License. Human case data are from Department of Health and Family Welfare Services, Government of Karnataka. White areas in Bhadravathi taluka in south east corner indicate no data.
Fig 6
Fig 6. Predicted probability of presence of KFD from Boosted Regression Tree models for the 2019 outbreak region in Tirthahalli taluk.
Models are at a 1 km (left hand panel) and 2 km resolution (right hand panel), with area of forest loss included in the predictors (bottom panel) and without (top panel). The outbreak locations from the 2018 to 2019 season (open red circles) occur mostly in areas of medium to high probability of presence (yellow to red) in all models, apart from two outbreak locations in the west. The black circles indicate outbreak locations from the 2014 to 2018 seasons, used to parameterise the models. White areas have missing environmental data because they contain water-bodies or are outside Shivamogga district (black outline). These raster maps are not under copyright since they are a product of this study. The administrative boundary dataset is from HindudstanTimesLabs (https://github.com/HindustanTimesLabs/shapefiles/), reproduced under the MIT License. Human case data are from Department of Health and Family Welfare Services, Government of Karnataka.
Fig 7
Fig 7. Predicted probability of presence of KFD from Boosted Regression Tree models for the 2019 outbreak region in Sagara taluk.
Models are at a 1 km (left hand panel) and 2 km resolution (right hand panel), with area of forest loss included in the predictors (bottom panel) and without (top panel). The outbreak locations from the 2018 to 2019 season (open red circles), occur in areas of medium to high probability of presence (yellow to red) in all models. White areas have missing environmental data because they contain water-bodies or are outside of Shivamogga district. These raster maps are not under copyright since they are a product of this study. The administrative boundary dataset is from HindudstanTimesLabs (https://github.com/HindustanTimesLabs/shapefiles/), reproduced under the MIT License. Human case data are from Department of Health and Family Welfare Services, Government of Karnataka.

References

    1. Mapping of poverty and likely zoonoses hotspots [Internet]. [cited 24 Mar 2019]. Available: http://mahider.ilri.org/handle/10568/21161
    1. Halliday JEB, Allan KJ, Ekwem D, Cleaveland S, Kazwala RR, Crump JA. Endemic zoonoses in the tropics: a public health problem hiding in plain sight. Vet Rec. 2015;176: 220–225. 10.1136/vr.h798 - DOI - PMC - PubMed
    1. Halliday J, Daborn C, Auty H, Mtema Z, Lembo T, Bronsvoort BMD, et al. Bringing together emerging and endemic zoonoses surveillance: shared challenges and a common solution. Philos Trans R Soc Lond B, Biol Sci. 2012;367: 2872–2880. 10.1098/rstb.2011.0362 - DOI - PMC - PubMed
    1. Ministry of Environment and Forests. Report of the National Forest Commission. New Delhi: Ministry of Environment and Forests, Government of India; 2006.
    1. Millenium Ecosystem Assessment. Ecosystems and Human Well-Being. Washington D.C.: Island Press; 2005.

Publication types