. 2020 May;38(3):033205.
doi: 10.1116/1.5142012. Epub 2020 Mar 24.

Spatially controlled stem cell differentiation via morphogen gradients: A comparison of static and dynamic microfluidic platforms

Affiliations

Spatially controlled stem cell differentiation via morphogen gradients: A comparison of static and dynamic microfluidic platforms

Kiara W Cui et al. J Vac Sci Technol A. 2020 May.

Abstract

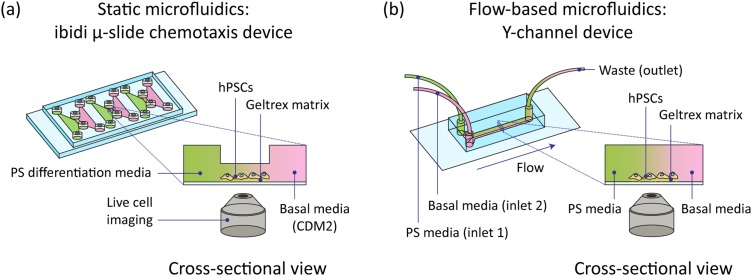
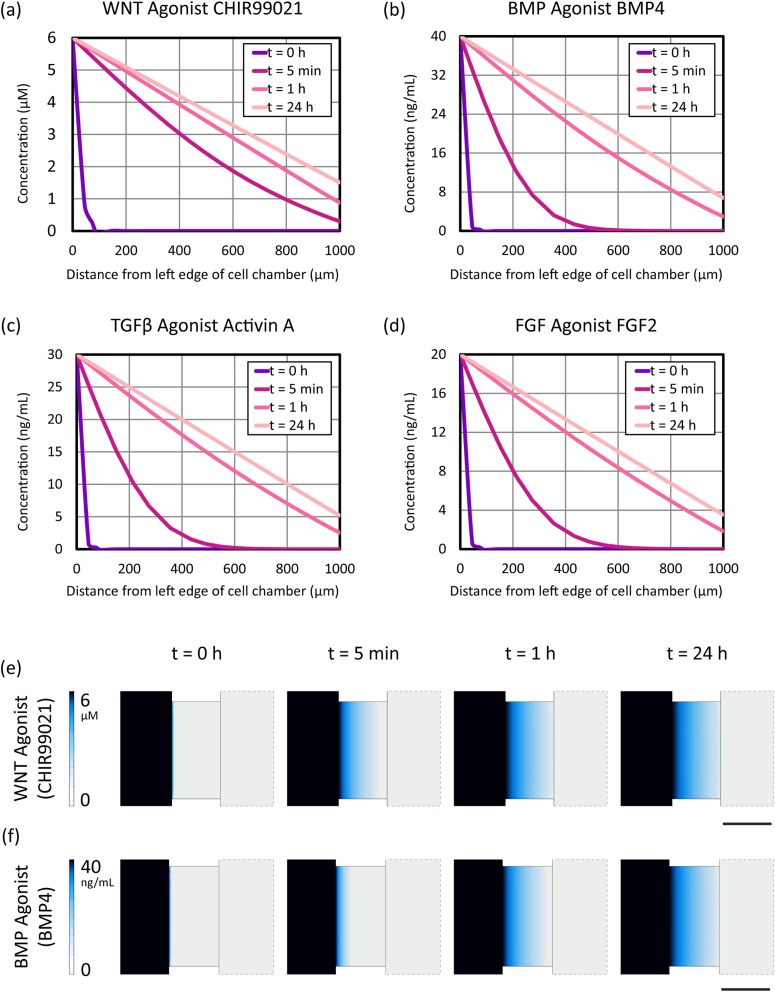
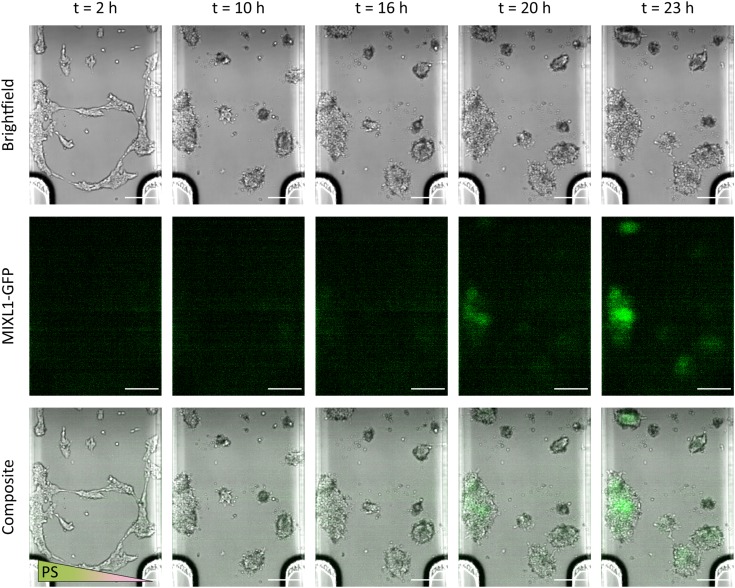
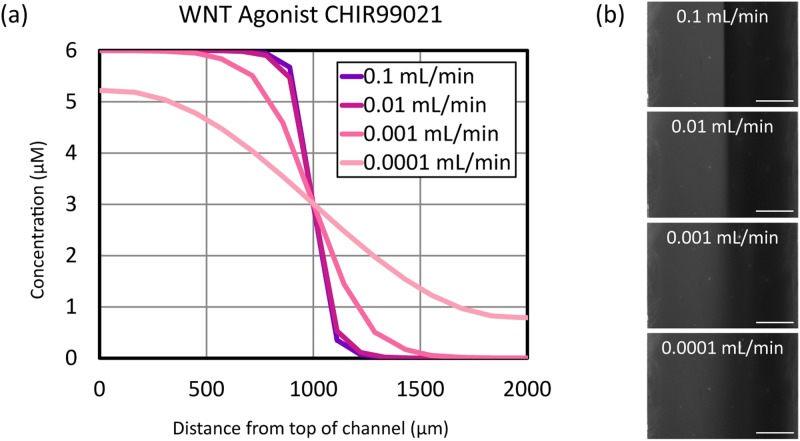
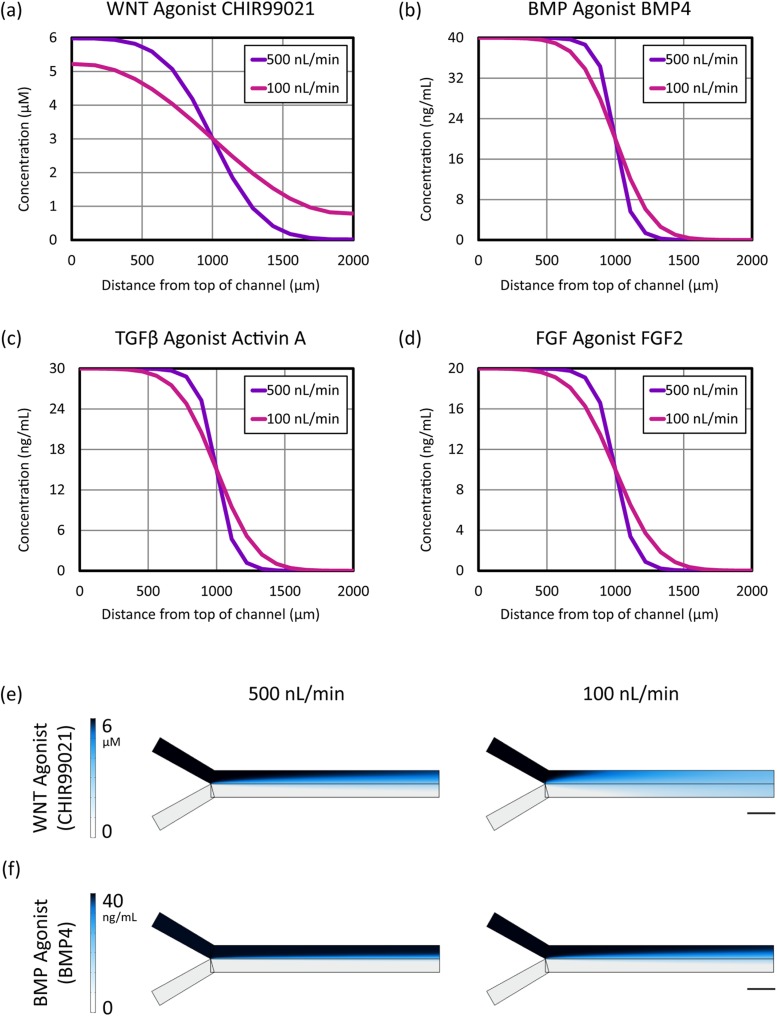
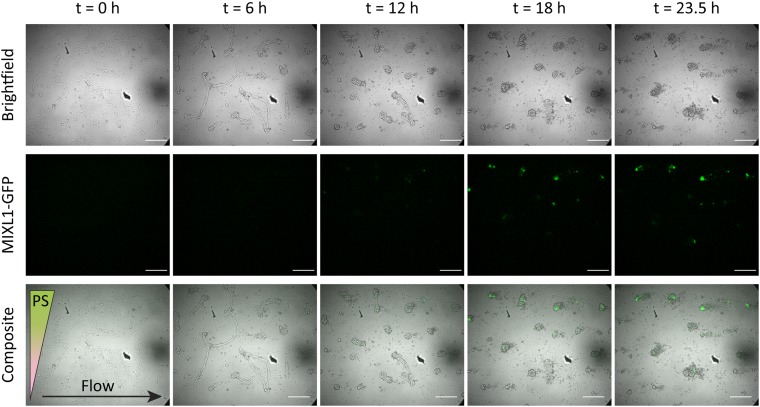
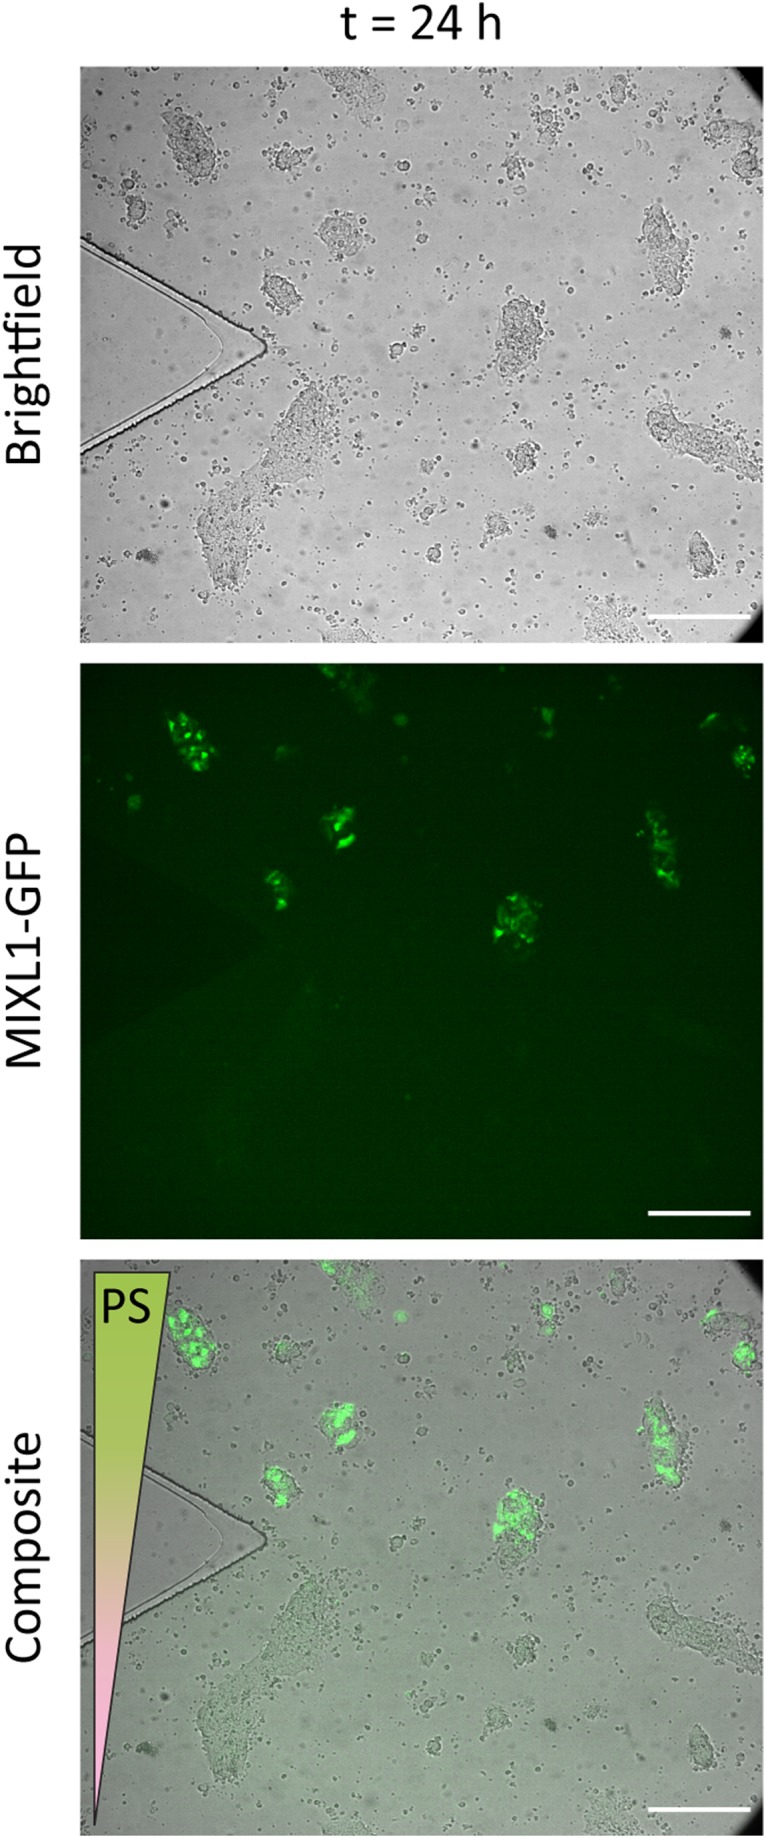
The ability to harness the processes by which complex tissues arise during embryonic development would improve the ability to engineer complex tissuelike constructs in vitro-a longstanding goal of tissue engineering and regenerative medicine. In embryos, uniform populations of stem cells are exposed to spatial gradients of diffusible extracellular signaling proteins, known as morphogens. Varying levels of these signaling proteins induce stem cells to differentiate into distinct cell types at different positions along the gradient, thus creating spatially patterned tissues. Here, the authors describe two straightforward and easy-to-adopt microfluidic strategies to expose human pluripotent stem cells in vitro to spatial gradients of desired differentiation-inducing extracellular signals. Both approaches afford a high degree of control over the distribution of extracellular signals, while preserving the viability of the cultured stem cells. The first microfluidic platform is commercially available and entails static culture, whereas the second microfluidic platform requires fabrication and dynamic fluid exchange. In each platform, the authors first computationally modeled the spatial distribution of differentiation-inducing extracellular signals. Then, the authors used each platform to expose human pluripotent stem cells to a gradient of these signals (in this case, inducing a cell type known as the primitive streak), resulting in a regionalized culture with differentiated primitive streak cells predominately localized on one side and undifferentiated stem cells at the other side of the device. By combining this approach with a fluorescent reporter for differentiated cells and live-cell fluorescence imaging, the authors characterized the spatial and temporal dynamics of primitive streak differentiation within the induced signaling gradients. Microfluidic approaches to create precisely controlled morphogen gradients will add to the stem cell and developmental biology toolkit, and may eventually pave the way to create increasingly spatially patterned tissuelike constructs in vitro.


Figures

FIG. 1.
FIG. 1.
Schematic of microfluidic setups used to generate gradients of soluble signaling factors across MIXL1-GFP hPSCs. Cells undergoing differentiation into anterior primitive streak (PS) were observed with live-cell fluorescence microscopy. (a) Static Ibidi μ-slide chemotaxis microfluidic device. (b) Flow-based Y-channel polydimethylsiloxane (PDMS) microfluidic device.
FIG. 2.
FIG. 2.
comsol multiphysics numerical simulation of extracellular signal concentrations across the cell culture chamber in the Ibidi static microfluidic device. (a)–(d) Graphs of the distribution of primitive streak (PS) soluble signaling factors in the Ibidi static microfluidic device. (e) and (f) Comparison of the establishment of the gradient between small molecule WNT agonist CHIR99021 and protein BMP4, where the color map indicates the concentration of the respective morphogen. The center rectangle depicts a top-down view of the central cell chamber. Scale bar: 1 mm.
FIG. 3.
FIG. 3.
Time-lapse bright-field and fluorescence imaging of primitive streak (PS) induction in MIXL1-GFP hPSCs in a static Ibidi microfluidic device. Differentiation in cell colonies begins on the left side of the cell culture chamber due to the higher concentration of primitive streak-inducing signals. Cell morphology changes over time in response to CHIR99021 exposure. Fluorescent green (GFP) indicates MIXL1 expression and thus the induction of primitive streak. Scale bar: 250μm.
FIG. 4.
FIG. 4.
Concentration profiles of extracellular signals vary as a function of flow rate in Y-channel microfluidic devices. (a) COMSOL simulation of a gradient of the small molecule WNT agonist CHIR99021 at various flow rates. (b) TMR concentration gradient profiles as a function of flow rate in a 2 mm wide Y-channel microfluidic device. The gradient appears sharper as the flow rate in the channel is increased. In micrographs at right, TMR appears gray, PBS appears black. Scale bar: 250μm.
FIG. 5.
FIG. 5.
comsol finite element simulation of extracellular signal concentrations across the cell culture chamber as a function of flow rate in a 2 mm wide Y-channel microfluidic device. (a)–(d) Distribution of primitive streak (PS) soluble signaling factors across the channel at a position 2 mm to the right of the Y-junction along the length of the channel at flow rates of 500 and 100 nl/min. (e) and (f) Comparison of steady-state gradient profiles for the small molecule WNT agonist CHIR99021 and the protein BMP4. Color map indicates the concentration of the respective morphogen. Direction of flow is left to right. Scale bar: 2 mm.
FIG. 6.
FIG. 6.
Time-lapse bright-field and fluorescence micrographs of MIXL1-GFP hPSCs exposed to a gradient of anterior primitive streak (PS) factors in a flow-based Y-channel microfluidic device. The flow rate at each inlet is 100 nl/min, and the direction of flow is from left to right. Cell morphology changes over time in response to CHIR99021 exposure, and fluorescent green (GFP) indicates MIXL1 expression and thus the induction of primitive streak. Scale bar: 250μm.
FIG. 7.
FIG. 7.
Bright-field and fluorescence micrographs of MIXL1-GFP hPSCs after 24 h of exposure to a gradient of anterior primitive streak (PS) factors in a flow-based Y-channel microfluidic device in the vicinity of the Y-junction. Flow rate at each inlet was 100 nl/min. Fluorescent green (GFP) indicates MIXL1 expression and thus the induction of primitive streak in the hPSCs in the upper half of the channel. Scale bar: 250μm.

References

    1. Rogers K. W. and Schier A. F., Annu. Rev. Cell Dev. Biol. 27, 377 (2011). 10.1146/annurev-cellbio-092910-154148 - DOI - PubMed
    1. Briscoe J. and Small S., Development 142, 3996 (2015). 10.1242/dev.129452 - DOI - PMC - PubMed
    1. Shimozono S., Iimura T., Kitaguchi T., Higashijima S.-i., and Miyawaki A., Nature 496, 363 (2013). 10.1038/nature12037 - DOI - PubMed
    1. Yu S. R., Burkhardt M., Nowak M., Ries J., Petrášek Z., Scholpp S., Schwille P., and Brand M., Nature 461, 533 (2009). 10.1038/nature08391 - DOI - PubMed
    1. Zagorski M., Tabata Y., Brandenberg N., Lutolf M. P., Tkačik G., Bollenbach T., Briscoe J., and Kicheva A., Science 356, 1379 (2017). 10.1126/science.aam5887 - DOI - PMC - PubMed

LinkOut - more resources