

Expression profile analysis identifies key genes as prognostic markers for metastasis of osteosarcoma
- PMID: 32256213
- PMCID: PMC7106759
- DOI: 10.1186/s12935-020-01179-x
Expression profile analysis identifies key genes as prognostic markers for metastasis of osteosarcoma
Abstract
Background: OS is the most common malignant tumor of bone which was featured with osteoid or immature bone produced by the malignant cells, and biomarkers are urgently needed to identify patients with this aggressive disease.
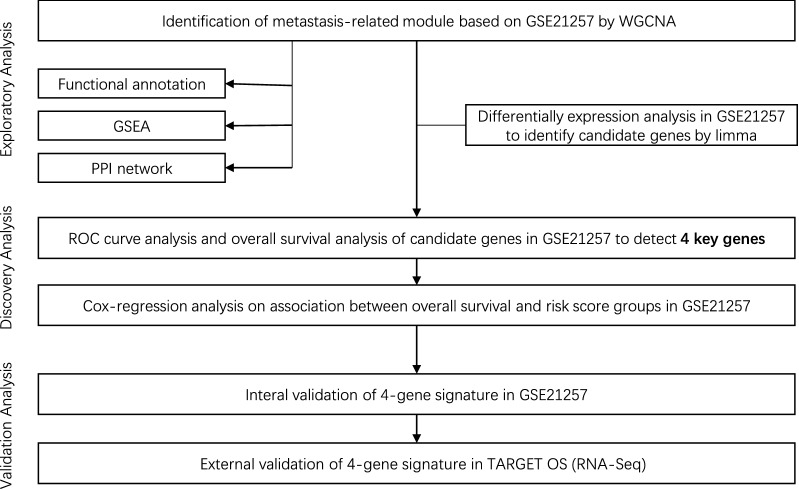
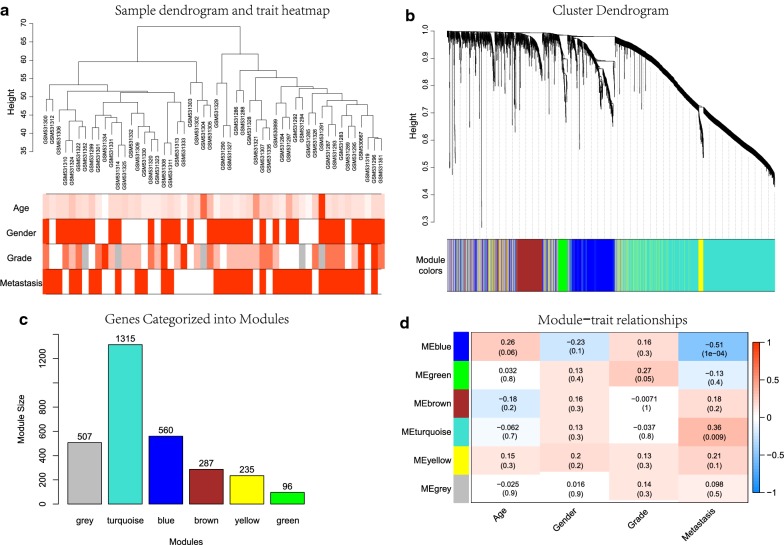
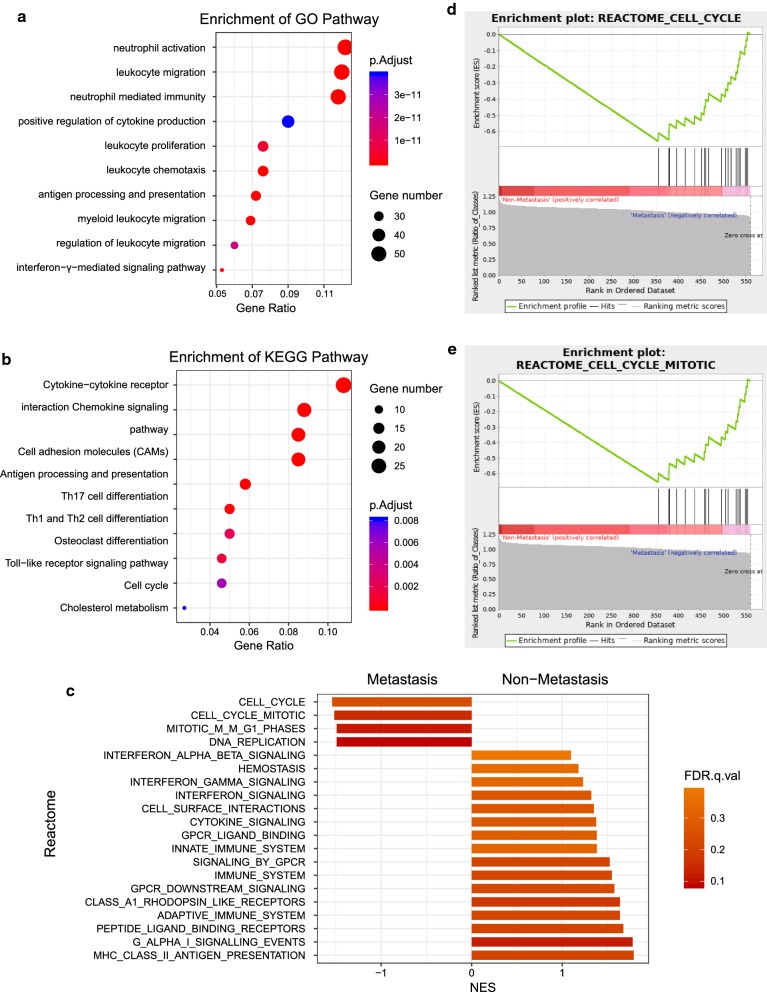
Methods: We downloaded gene expression profiles from GEO and TARGET datasets for OS, respectively, and performed WGCNA to identify the key module. Whereafter, functional annotation and GSEA demonstrated the relationships between target genes and OS.
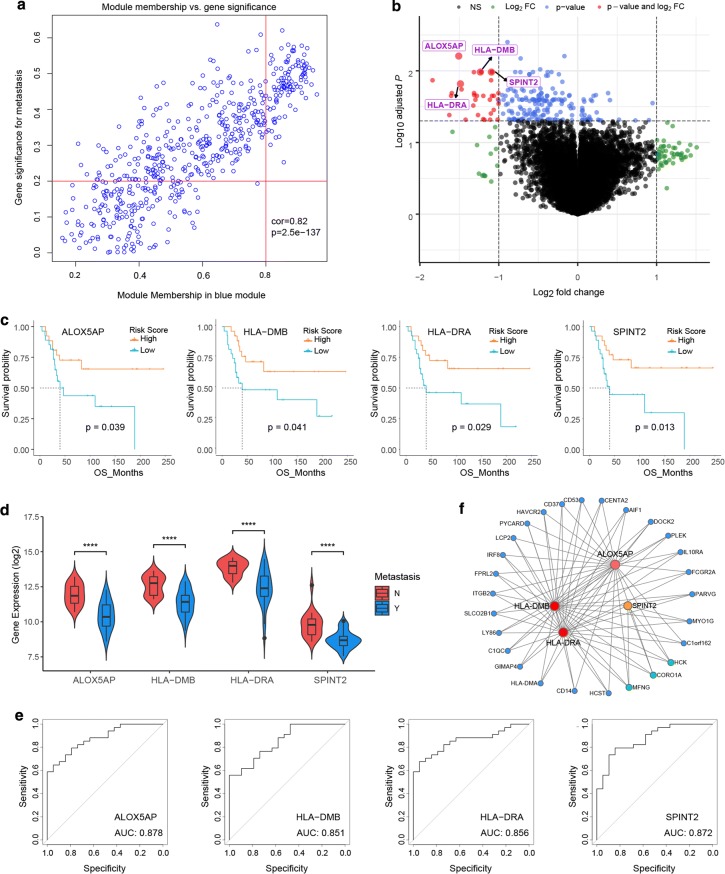
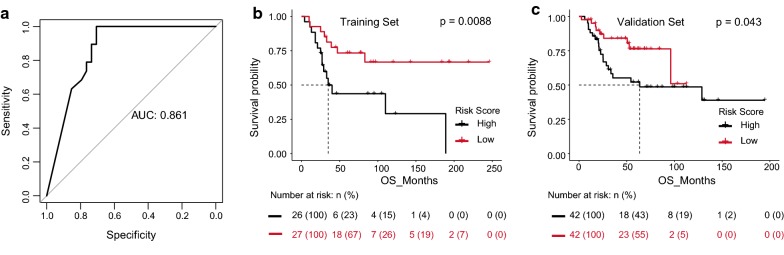
Results: In this study, we discovered four key genes-ALOX5AP, HLA-DMB, HLA-DRA and SPINT2 as new prognostic markers and confirmed their relationship with OS metastasis in the validation set.
Conclusions: In conclusion, ALOX5AP, HLA-DMB, HLA-DRA and SPINT2 were identified by bioinformatics analysis as possible prognostic markers for OS metastasis.
Keywords: Biomarker; Gene expression; Metastasis; Molecular classifier; Osteosarcoma; Prognosis.
© The Author(s) 2020.
Conflict of interest statement
Competing interestsThe authors declare that they have no competing interests.
Figures
Similar articles
-
Construction of survival-related co-expression modules and identification of potential prognostic biomarkers of osteosarcoma using WGCNA.Ann Transl Med. 2022 Mar;10(6):296. doi: 10.21037/atm-22-399. Ann Transl Med. 2022. PMID: 35434042 Free PMC article.
-
Prognostic Implications of the Complement Protein C1Q and Its Correlation with Immune Infiltrates in Osteosarcoma.Onco Targets Ther. 2021 Mar 5;14:1737-1751. doi: 10.2147/OTT.S295063. eCollection 2021. Onco Targets Ther. 2021. PMID: 33707956 Free PMC article.
-
A support vector machine classifier for the prediction of osteosarcoma metastasis with high accuracy.Int J Mol Med. 2017 Nov;40(5):1357-1364. doi: 10.3892/ijmm.2017.3126. Epub 2017 Sep 7. Int J Mol Med. 2017. PMID: 28901446 Free PMC article.
-
MCAM is associated with metastasis and poor prognosis in osteosarcoma by modulating tumor cell migration.J Clin Lab Anal. 2022 Feb;36(2):e24214. doi: 10.1002/jcla.24214. Epub 2021 Dec 27. J Clin Lab Anal. 2022. PMID: 34961985 Free PMC article.
-
PODN is a prognostic biomarker and correlated with immune infiltrates in osteosarcoma.Cancer Cell Int. 2021 Jul 17;21(1):381. doi: 10.1186/s12935-021-02086-5. Cancer Cell Int. 2021. PMID: 34273970 Free PMC article. Review.
Cited by
-
Biomarkers, Master Regulators and Genomic Fabric Remodeling in a Case of Papillary Thyroid Carcinoma.Genes (Basel). 2020 Sep 2;11(9):1030. doi: 10.3390/genes11091030. Genes (Basel). 2020. PMID: 32887258 Free PMC article.
-
Identification of potential crucial genes and key pathways in osteosarcoma.Hereditas. 2020 Jul 14;157(1):29. doi: 10.1186/s41065-020-00142-0. Hereditas. 2020. PMID: 32665038 Free PMC article.
-
Secreted Protein Acidic and Rich in Cysteine Mediates the Development and Progression of Diabetic Retinopathy.Front Endocrinol (Lausanne). 2022 Jun 3;13:869519. doi: 10.3389/fendo.2022.869519. eCollection 2022. Front Endocrinol (Lausanne). 2022. PMID: 35721704 Free PMC article.
-
ALOX5AP Predicts Poor Prognosis by Enhancing M2 Macrophages Polarization and Immunosuppression in Serous Ovarian Cancer Microenvironment.Front Oncol. 2021 May 19;11:675104. doi: 10.3389/fonc.2021.675104. eCollection 2021. Front Oncol. 2021. PMID: 34094977 Free PMC article.
-
Using machine learning methods to study the tumour microenvironment and its biomarkers in osteosarcoma metastasis.Heliyon. 2024 Apr 5;10(7):e29322. doi: 10.1016/j.heliyon.2024.e29322. eCollection 2024 Apr 15. Heliyon. 2024. PMID: 38623240 Free PMC article.
References
LinkOut - more resources
Full Text Sources
Research Materials
