. 2020 Mar 12:2020:5425934.
doi: 10.1155/2020/5425934. eCollection 2020.

Multiplexed 129Xe HyperCEST MRI Detection of Genetically Reconstituted Bacterial Protein Nanoparticles in Human Cancer Cells

Affiliations

Multiplexed 129Xe HyperCEST MRI Detection of Genetically Reconstituted Bacterial Protein Nanoparticles in Human Cancer Cells

Ryota Mizushima et al. Contrast Media Mol Imaging. .

Abstract

Gas vesicle nanoparticles (GVs) are gas-containing protein assemblies expressed in bacteria and archaea. Recently, GVs have gained considerable attention for biotechnological applications as genetically encodable contrast agents for MRI and ultrasonography. However, at present, the practical use of GVs is hampered by a lack of robust methodology for their induction into mammalian cells. Here, we demonstrate the genetic reconstitution of protein nanoparticles with characteristic bicone structures similar to natural GVs in a human breast cancer cell line KPL-4 and genetic control of their size and shape through expression of reduced sets of humanized gas vesicle genes cloned into Tol2 transposon vectors, referencing the natural gas vesicle gene clusters of the cyanobacteria planktothrix rubescens/agardhii. We then report the utility of these nanoparticles as multiplexed, sensitive, and genetically encoded contrast agents for hyperpolarized xenon chemical exchange saturation transfer (HyperCEST) MRI.


Conflict of interest statement

RIKEN has a pending patent application already open to the public (WO2018043716A1) regarding this work, in which R. M. and T. M. W. are inventors.

Figures

Figure 1
Figure 1
GV gene constructs, monoclonal KPL-4 cells expressing the GV gene sets, and cell proliferation assay of the cells. (a) Schematics of the inserts of Tol2 vectors for transfection of humanized GV genes gvpA, gvpC16, gvpC20, and gvpC28. CMVmin: CMV minimal promoter. (b) Monoclonal KPL-4 cells stably expressing GV gene combinations in the presence of 1 μg/ml Dox, shown after pelleting. From top to bottom, monoclonal cells stably expressing gvpA and gvpC20 (GV_AC20), gvpA and gvpC28 (GV_AC28), gvpA, gvpC16, and gvpC20 (GV_AC16C20). (c) Effect of GV gene expression on cell proliferation of each monoclonal cell, probed using a WST-8 reagent at 72 hours after addition of Dox (Dox+) or an equivalent amount of PBS (Dox-) into the culture medium. Normalized absorbances of the average of 8 separate cultures of each monoclonal cell are shown. An asterisk () indicates statistical significance: p < 0.05, t-test. Error bars indicate SEM.
Figure 2
Figure 2
Expression of GVLPs in human cells. (a) Schematic illustration of the protocol developed to purify GVLPs from mammalian cells. (b) TEM images of purified GVLPs from the cells: GV_AC20 (left), GV_AC28 (middle), and GV_AC16C20 (right). Scale bars indicate 100 nm (left), 500 nm (middle), and 100 nm (right). (c) Confocal microscopy images of GV_AC28 cells. Fluorescence images of EGFP (left), mKate2 (middle), and merged image of the two (right). Scale bars indicate 5 μm in all three images.
Figure 3
Figure 3
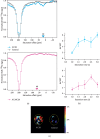
HyperCEST MR Z-spectra and images of GV cells. The strengths of saturation RF pulses employed for the HyperCEST MR Z-spectra and images were 1.5 μT (30 dB) and 5.9 μT (52 dB), respectively. (a) Z-spectrum of GV_AC28 cell and control KPL-4 cell samples with 8.0 × 107 cells/ml (upper) and GV_AC16C20 cell sample with 2.0 × 107 cells/ml (lower). Color triangles indicate the saturation offsets used to calculate %CEST contrast in (b). (b) Saturation time dependency of %CEST contrast for GV_AC28 cells (upper) and GV_AC16C20 cells (lower). (c) HyperCEST MR images of GV_AC28 cell and control KPL-4 cell samples with 8.0 × 107 cells/ml. The dotted yellow line indicates the wall of the 10φ glass tube in which the cell suspension was contained. The color bar indicates %CEST contrast.

References

    1. Walsby A. E., Hayes P. K. Gas vesicle proteins. Biochemical Journal. 1989;264(2):313–322. doi: 10.1042/bj2640313. - DOI - PMC - PubMed
    1. Walsby A. E. Gas vesicles. Microbiological Reviews. 1994;58(1):94–144. doi: 10.1128/mmbr.58.1.94-144.1994. - DOI - PMC - PubMed
    1. Pfeifer F. Distribution, formation and regulation of gas vesicles. Nature Reviews Microbiology. 2012;10(10):705–715. doi: 10.1038/nrmicro2834. - DOI - PubMed
    1. DasSarma S., DasSarma P. Gas vesicle nanoparticles for antigen display. Vaccines. 2015;3(3):686–702. doi: 10.3390/vaccines3030686. - DOI - PMC - PubMed
    1. Shapiro M. G., Goodwill P. W., Neogy A., et al. Biogenic gas nanostructures as ultrasonic molecular reporters. Nature Nanotechnology. 2014;9(4):311–316. doi: 10.1038/nnano.2014.32. - DOI - PMC - PubMed

Publication types