. 2020 Feb 28:16:32.
doi: 10.1007/s11295-019-1407-9.

In situ estimation of genetic variation of functional and ecological traits in Quercus petraea and Q.robur

Affiliations

In situ estimation of genetic variation of functional and ecological traits in Quercus petraea and Q.robur

Hermine Alexandre et al. Tree Genet Genomes. .

Abstract

Background: Predicting the evolutionary potential of natural tree populations requires the estimation of heritability and genetic correlations among traits on which selection acts, as differences in evolutionary success between species may rely on differences for these genetic parameters. In situ estimates are expected to be more accurate than measures done under controlled conditions which do not reflect the natural environmental variance.

Aims: The aim of the current study was to estimate three genetic parameters (i.e. heritability, evolvability and genetic correlations) in a natural mixed oak stand composed of Quercus petraea and Quercus robur about 100 years old, for 58 traits of ecological and functional relevance (growth, reproduction, phenology, physiology, resilience, structure, morphology and defence).

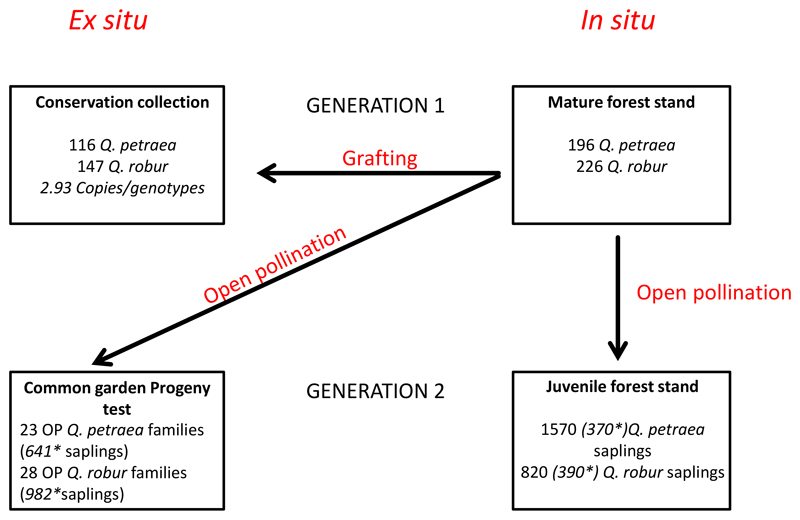
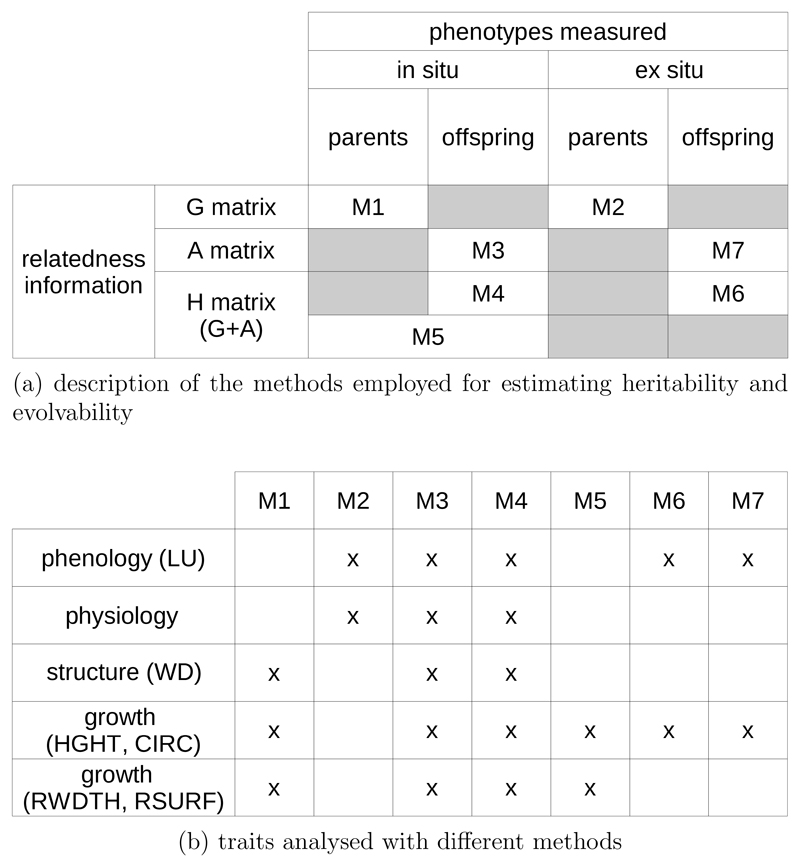
Methods: First we estimated genetic parameters directly in situ using realized genomic relatedness of adult trees and parentage relationships over two generations to estimate the traits additive variance. Secondly, we benefited from existing ex situ experiments (progeny tests and conservation collection) installed with the same populations, thus allowing comparisons of in situ heritability estimates with more traditional methods.

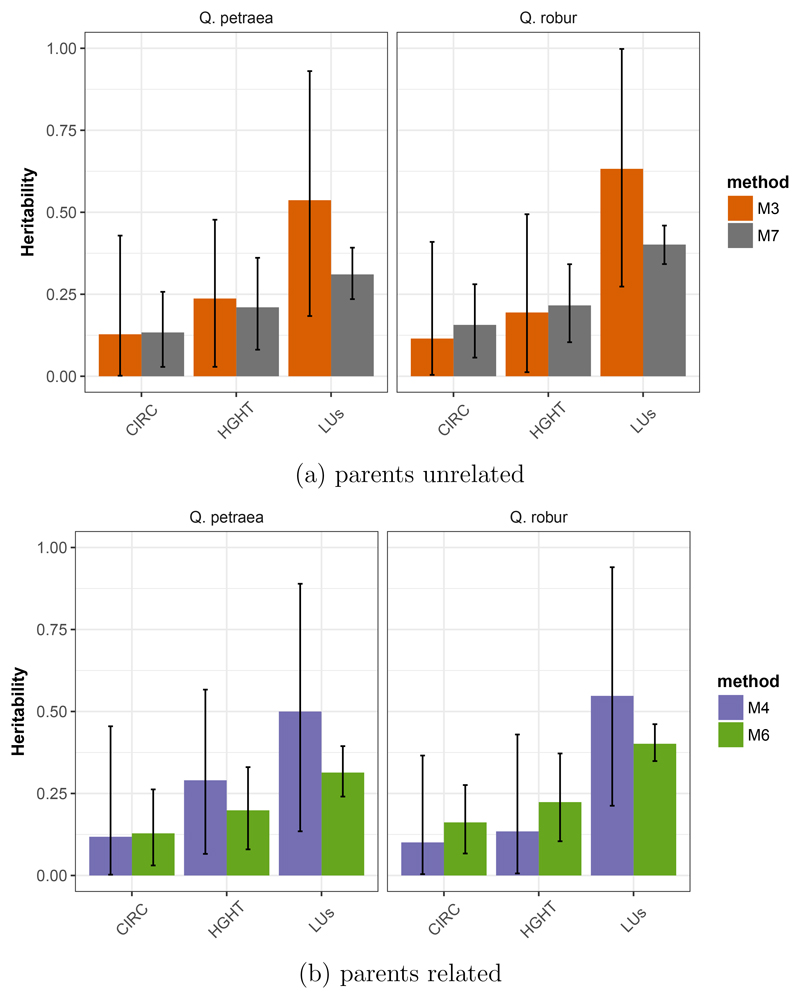
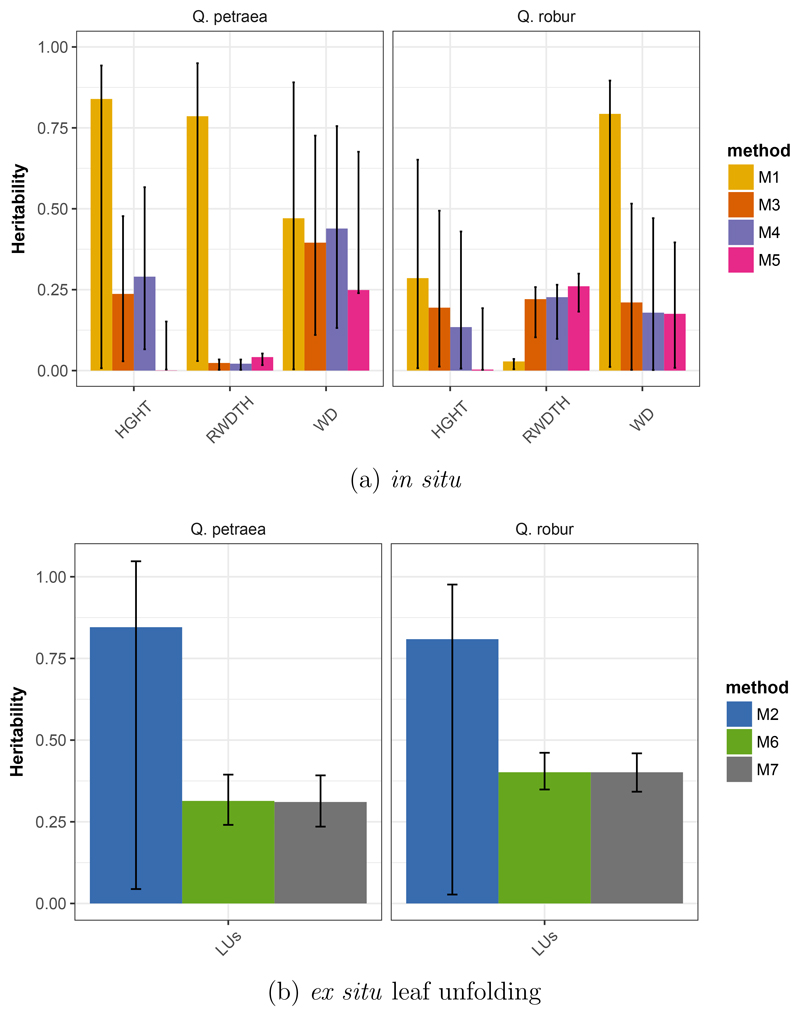
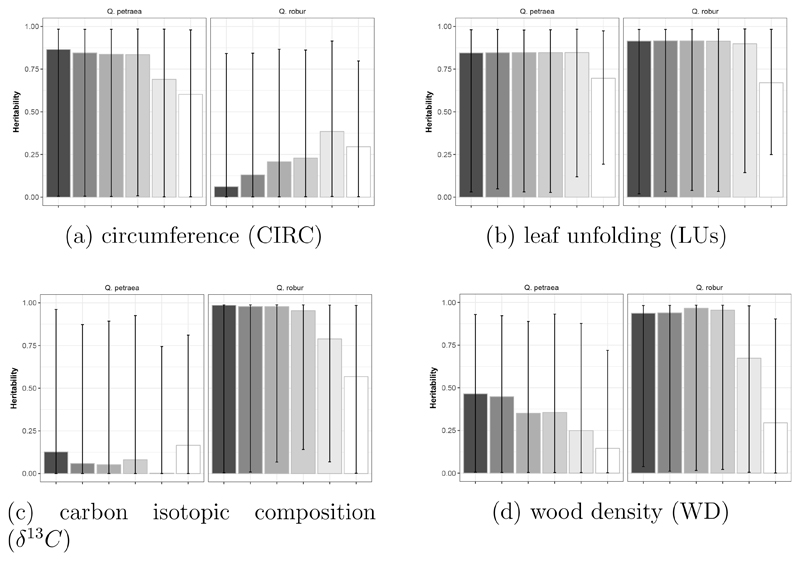
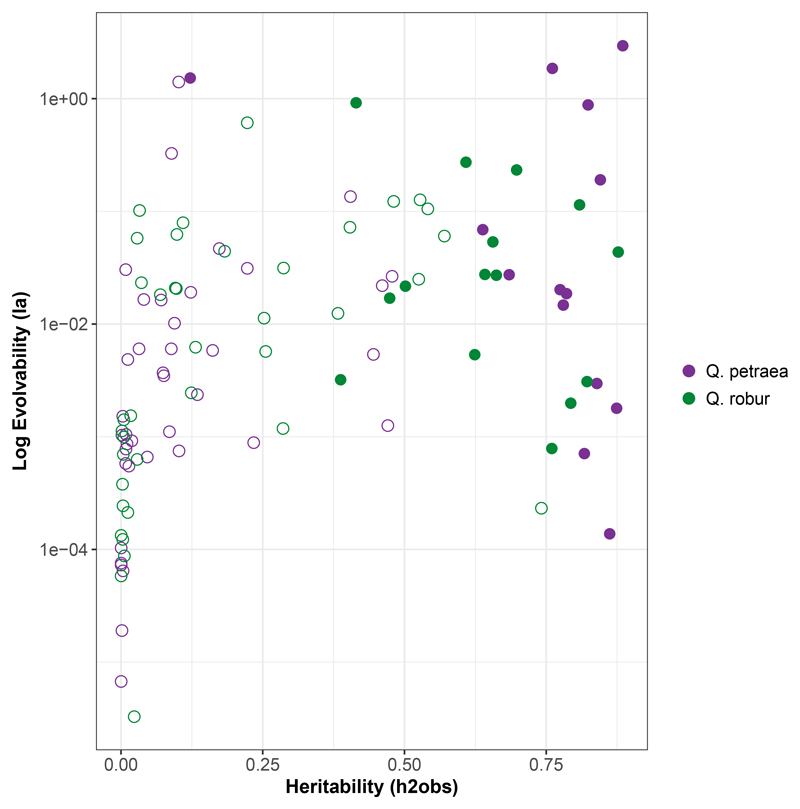
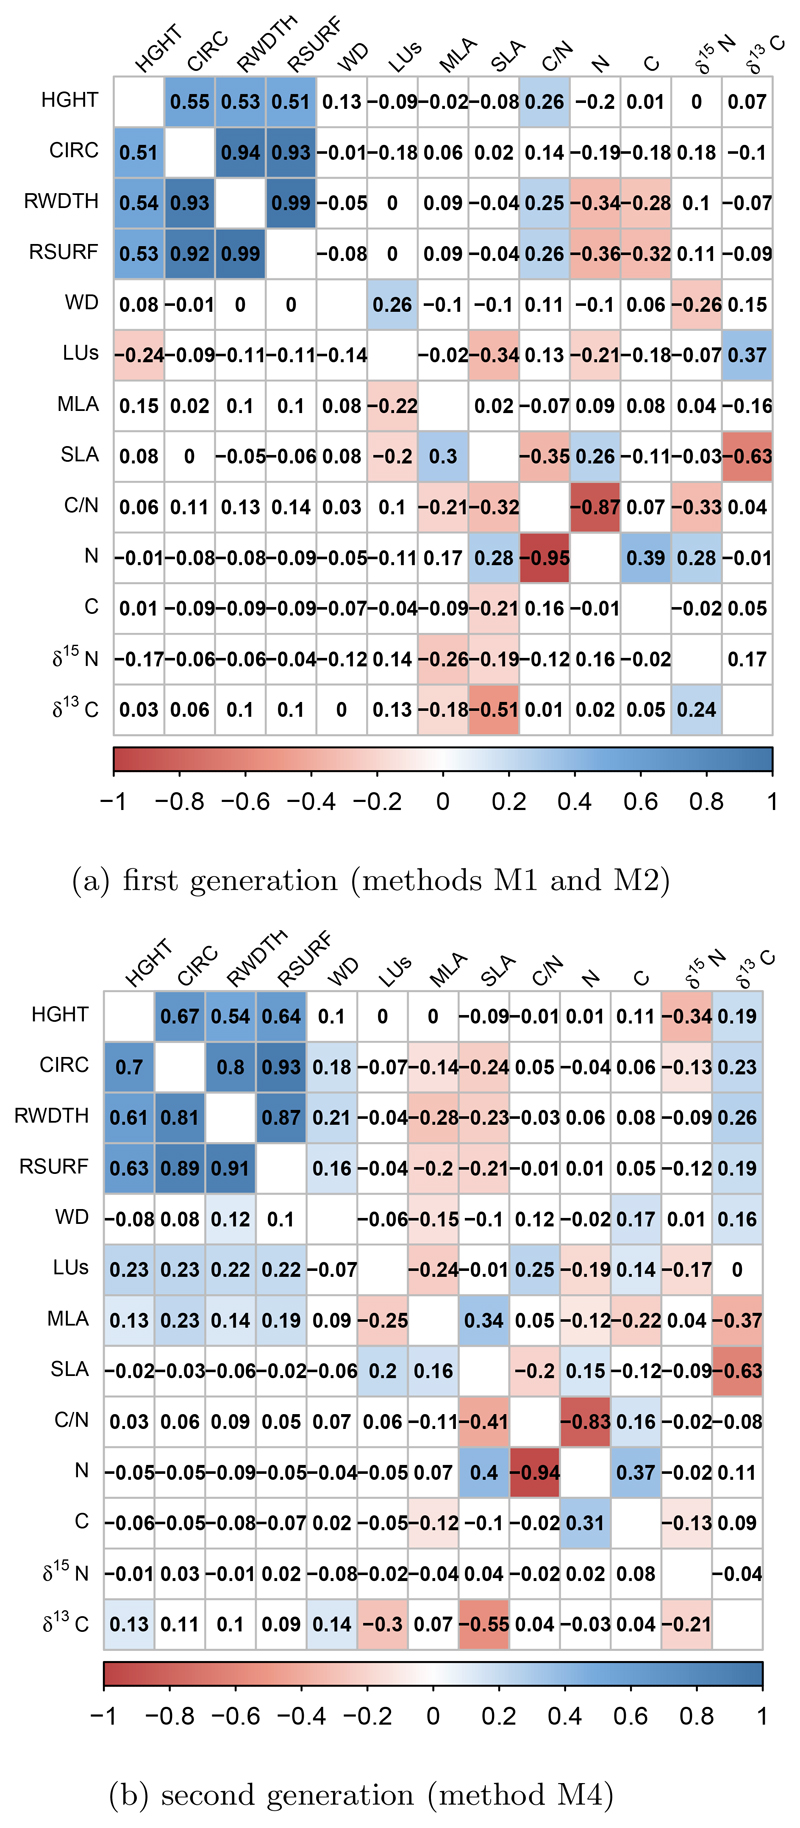
Results: Heritability and evolvability estimates obtained with different methods varied substantially and showed large confidence intervals, however we found that in situ were less precise than ex situ estimates, and assessments over two generations (with deeper relatedness) improved estimates of heritability while large sampling sizes are needed for accurate estimations. At the biological level, heritability values varied moderately across different ecological and functional categories of traits, and genetic correlations among traits were conserved over the two species.

Conclusion: We identified limits for using realized genomic relatedness in natural stands to estimate the genetic variance, given the overall low variance of genetic relatedness and the rather low sampling sizes of currently used long term genetic plots in forestry. These limits can be overcome if larger sample sizes are considered, or if the approach is extended over the next generation.

Keywords: Heritability; evolvability; genetic correlation; genomic relatedness; natural population; tree.


Conflict of interest statement

Conflict of interest disclosure The authors of this preprint declare that they have no financial conflict of interest with the content of this article.

Figures

Figure 1
Figure 1
Schematic representation of the study experimental design. *: Numbers in italics correspond to number of saplings with reconstructed pedigree by parentage analysis.
Figure 2
Figure 2
Description of the 7 methods used to estimate genetic parameters with the animal model, depending on the genetic relatedness information available and on the phenotypic measure conditions (a). Summary of the traits allowing comparisons across different methods (b).
Figure 3
Figure 3
Comparison of heritability estimates (hobs2) computed in G2 in situ (M3, M4) or in common garden (M6, M7) for Q. petraea and Q. robur, considering parents are non related (a) or taking account of genomic relatedness among parents (b). CIRC : circumference, HGHT height, LUs: leaf unfolding. Bars represent the estimates from REML and error bars represent the 95% CI obtained from 1000 bootstrap simulations.
Figure 4
Figure 4
Comparison of heritability estimates (hobs2) computed (a) in situ in G1 (M1), G2 (M3 and M4) or G1 and G2 (M5) for Q. petraea and Q. robur. HGHT: height, RWDTH: ring width, WD: wood density. and (b) ex situ for leaf unfolding (LUs) in G1 (M2) and G2 (M6, M7). Bars represent the estimates from REML and error bars represent the 95% CI obtained from 1000 bootstrap simulations.
Figure 5
Figure 5
Comparison of heritability estimates (hcalc2) computed in situ in G1 (M1 or M2) with marker sets selected from different MAF thresholds, for circumference (a), leaf unfolding (b), carbon isotopic composition (c) and wood density (d) in Q. petraea and Q. robur. Bars represent the estimates of heritability and error bars represent the 95% CI obtained from 1000 bootstrap simulations. MAF thresholds of 1%, 5%, 10%, 15%, 30% and 40% correspond to 32047, 15274, 9502, 6753, 2849 and 1454 markers in Q. petraea and 33131, 16408, 10225, 7143, 3058 and 1561 markers in Q. robur. The grey scale corresponds to MAF thresholds, from darker (MAF=1%) to lighter grey (MAF=40%).
Figure 6
Figure 6
Plot of Evolvability against Heritability for each trait presented in Tables 2 and 3. Open circles represent traits for which the genetic additive effect does not increase model fitting (ΔAIC < 0) and filled circles represent traits for which the genetic additive effect increases model fitting (ΔAIC > 0). Purple : Q. petraea, green : Q. robur. Evolvability is presented on a log-scale to enhance data visualization.
Figure 7
Figure 7
Genetic correlations for traits measured in both generations. (a) correlations for the first generation, (b) correlations for the second generation. Correlation coefficients for Q. petraea are above the matrix diagonals and Q. robur are below the diagonal. Colors correspond to the correlation sign (blue for positive and red for negative correlations). Only correlations significant at a 5% threshold are colored.

Similar articles

Cited by

References

    1. Akesson M, Bensch S, Hasselquist D, Tarka M, Hansson B. Estimating Heritabilities and Genetic Correlations : Comparing the ”Animal Model” with Parent-Offspring Regression Using Data from a Natural Population. PloS one. 2008;3:e1739. - PMC - PubMed
    1. Armbruster WS, Pelabon C, Bolstad GH, Hansen TF. Integrated phenotypes: understanding trait covariation in plants and animals. Philosophical Transactions of the Royal Society B. 2014;369 20130245. - PMC - PubMed
    1. Bacilieri R, Ducousso A, Kremer A. Comparison of morphological characters and molecular markers for the analysis of hybridization in sessile and pedunculate oak. Annales des Sciences Forestieres. 1996;53:79–91.
    1. Bacilieri R, Labbe T, Kremer A. Intraspecific genetic structure in a mixed population of Quercus petraea (Matt.) Leibl and Q. roburL. Heredity. 1994;73:130–141.
    1. Bérénos C, Ellis PA, Pilkington JG, Pemberton JM. Estimating quantitative genetic parameters in wild populations: A comparison of pedigree and genomic approaches. Molecular Ecology. 2014;23:3434–3451. - PMC - PubMed

LinkOut - more resources