. 2019 Jan 24;29(4):1803567.
doi: 10.1002/adfm.201803567. Epub 2018 Nov 13.

Platelet-Inspired Nanocells for Targeted Heart Repair After Ischemia/Reperfusion Injury

Affiliations

Platelet-Inspired Nanocells for Targeted Heart Repair After Ischemia/Reperfusion Injury

Teng Su et al. Adv Funct Mater. .

Abstract

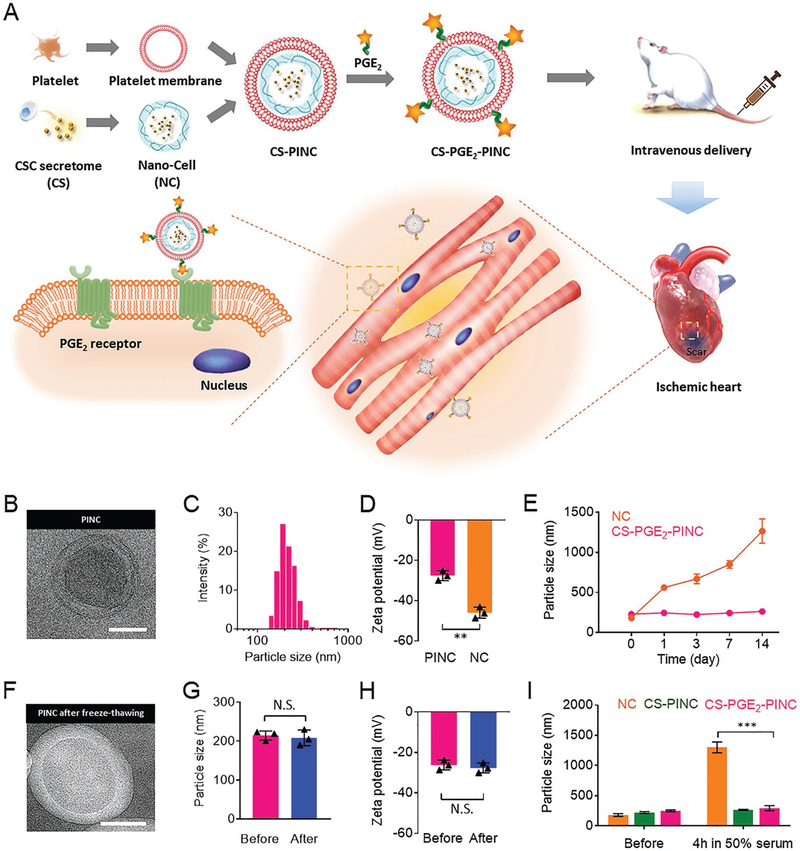
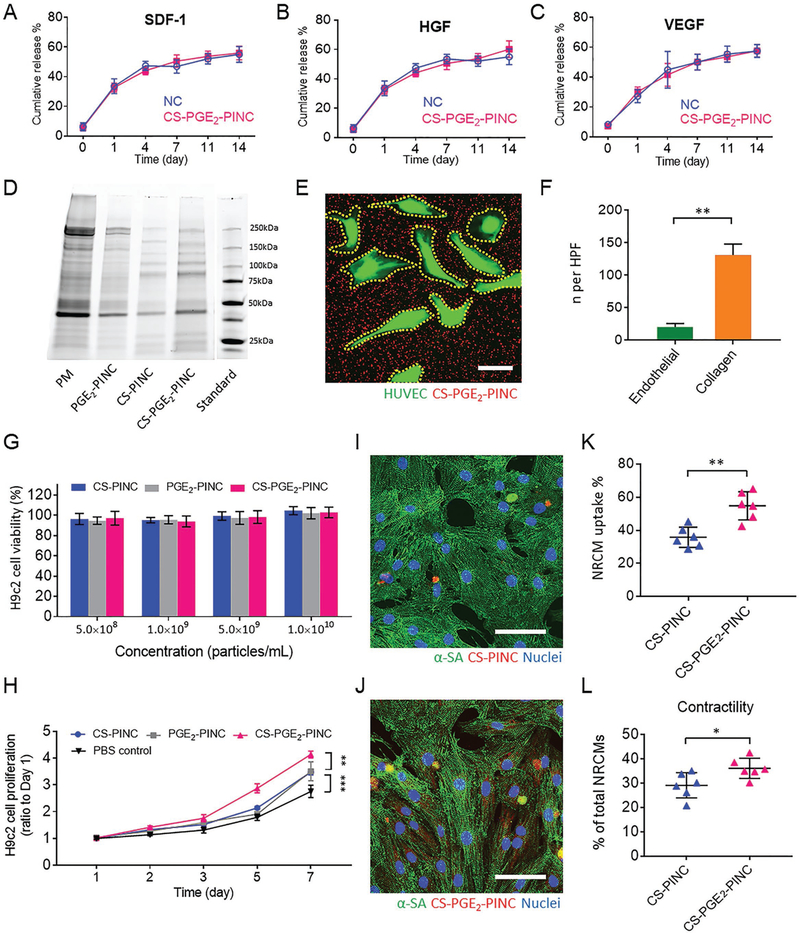
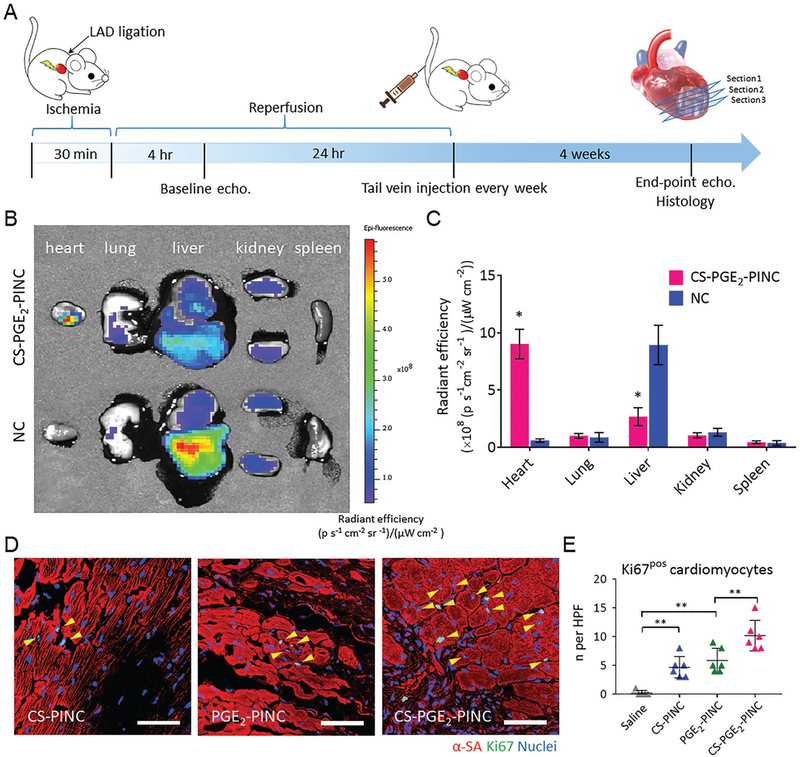
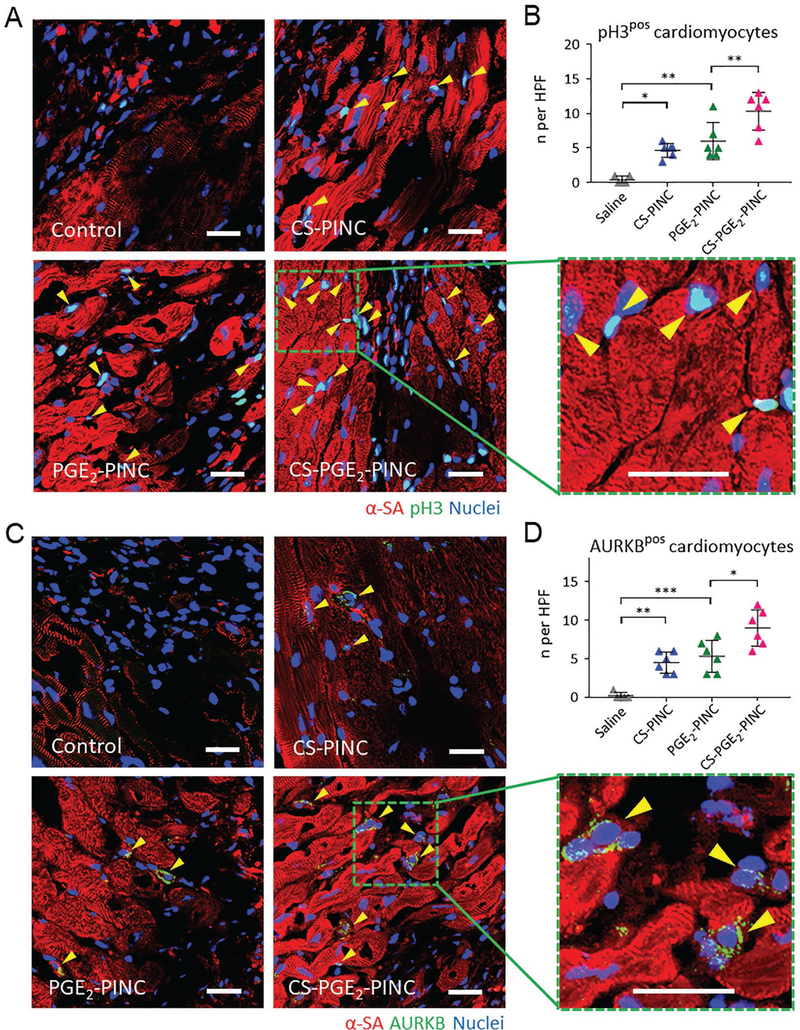
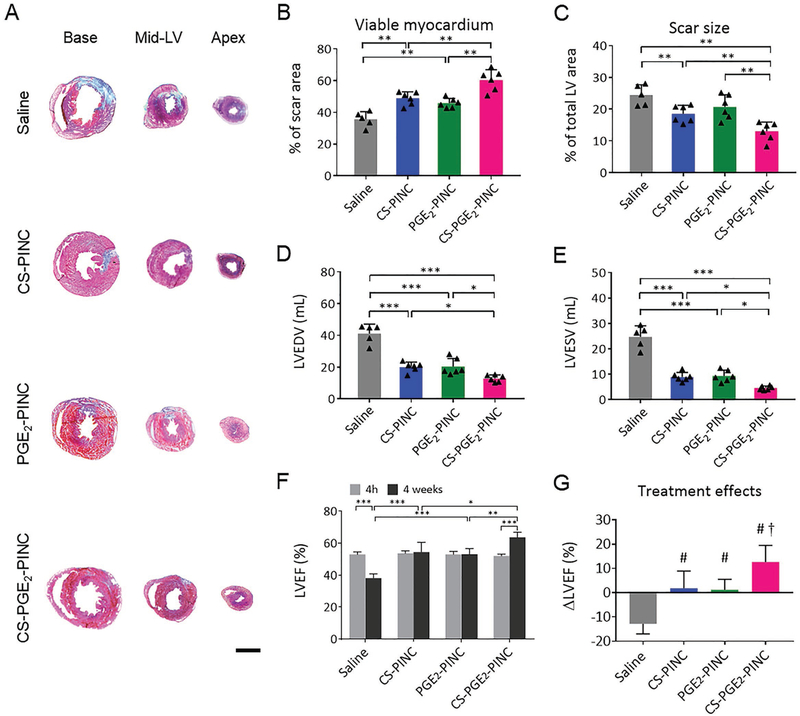
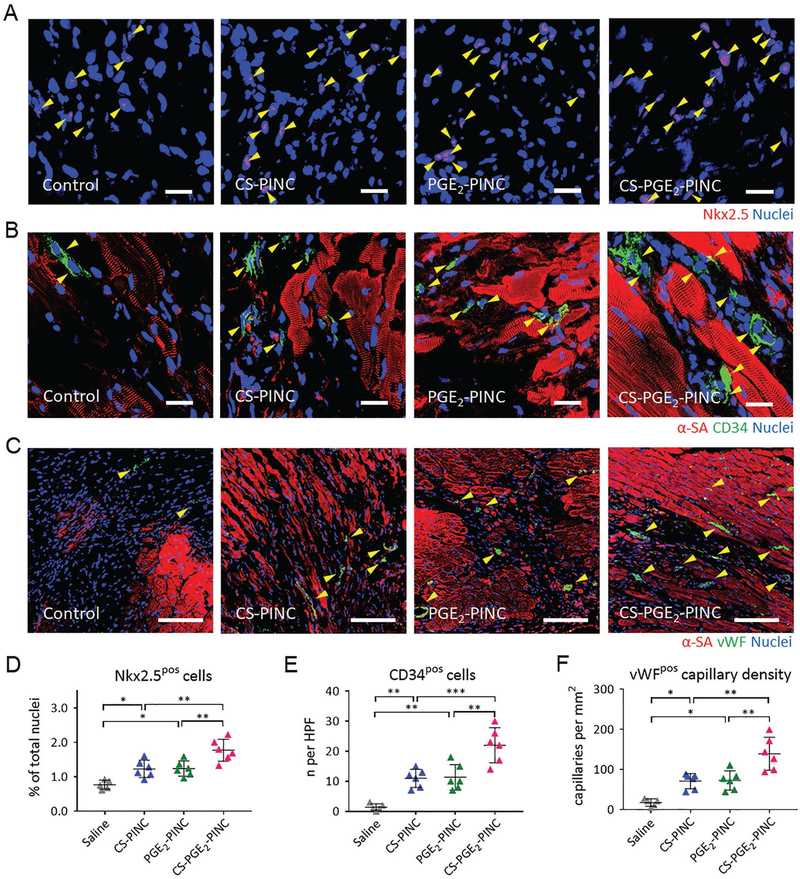
Cardiovascular disease is the leading cause of mortality worldwide. While reperfusion therapy is vital for patient survival post-heart attack, it also causes further tissue injury, known as myocardial ischemia/reperfusion (I/R) injury in clinical practice. Exploring ways to attenuate I/R injury is of clinical interest for improving post-ischemic recovery. A platelet-inspired nanocell (PINC) that incorporates both prostaglandin E2 (PGE2)-modified platelet membrane and cardiac stromal cell-secreted factors to target the heart after I/R injury is introduced. By taking advantage of the natural infarct-homing ability of platelet membrane and the overexpression of PGE2 receptors (EPs) in the pathological cardiac microenvironment after I/R injury, the PINCs can achieve targeted delivery of therapeutic payload to the injured heart. Furthermore, a synergistic treatment efficacy can be achieved by PINC, which combines the paracrine mechanism of cell therapy with the PGE2/EP receptor signaling that is involved in the repair and regeneration of multiple tissues. In a mouse model of myocardial I/R injury, intravenous injection of PINCs results in augmented cardiac function and mitigated heart remodeling, which is accompanied by the increase in cycling cardiomyocytes, activation of endogenous stem/progenitor cells, and promotion of angiogenesis. This approach represents a promising therapeutic delivery platform for treating I/R injury.

Keywords: biomimetics; drug delivery; ischemic injury; platelets; stromal cell secretome.


Conflict of interest statement

Conflict of Interest The authors declare no conflict of interest.

Figures

Figure 1.
Figure 1.
Fabrication and characterization of PINCs. A) Schematic illustration of the fabrication process of PINCs. The therapeutic effects of PINC injection were tested in mice with myocardial I/R injury. B) TEM image showing the ultrastructure of CS-PGE2-PINC. C) Size distribution of CS-PGE2-PINC measured by DLS. D) Zeta potentials of CS-PGE2-PINC and NC. E) Particle sizes of bare NC and CS-PGE2-PINC over 2 weeks in PBS. F) TEM image showing the ultrastructure of CS-PGE2-PINC after freeze-thawing. G) The comparison of particle size and H) zeta potential of CS-PGE2-PINC before and after freeze-thawing. I) In vitro stability of NC, CS-PINC, and CS-PGE2-PINC before and after incubation in 50% fetal bovine serum. Scale bars, 100 nm. All data are mean ± s.d. * indicates p < 0.05, ** indicates p < 0.01, *** indicates p < 0.001; N.S., no statistical significance. Comparisons between any two groups were performed using two-tailed unpaired Student’s t-test. Comparisons among more than two groups were performed using one-way ANOVA followed by post hoc Bonferroni test.
Figure 2.
Figure 2.
In vitro bioactivity of PINCs. A–C) Quantitative analysis of the releases of SDF-1, HGF, VEGF from NC and CS-PGE2-PINC over 2 weeks. D) Protein content visualization of platelet membrane (PM), PGE2-PINC, CS-PINC, and CS-PGE2-PINC run on SDS-PAGE at equivalent protein concentrations. E) Collagen-coated four-well slides seeded with HUVECs were incubated with CS-PGE2-PINCs for 60 s, followed by fluorescence microscopy showing selective CS-PGE2-PINC adherence to exposed collagen versus endothelial surfaces. F) Quantification of CS-PGE2-PINC in endothelial- and collagen-covered surface, respectively. G) Cytocompatibility of PINCs at various concentrations. H) The proliferation of H9c2 cells over time in the presence of different PINCs. I, J) Representative confocal image showing the internalization of I) CS-PINC and J) CS-PGE2-PINC by NRCMs. K) Quantitative analysis of the percentage of NRCMs with different nanoparticle endocytosis. L) Quantitative analysis of NRCM contractility when cocultured with different PINCs. Scale bars, E) 20 μm; I, J) 50 μm. All data are mean ± s.d. Comparisons between any two groups were performed using two-tailed unpaired Student’s t-test. Comparisons among more than two groups were performed using one-way ANOVA followed by post hoc Bonferroni test. * indicates p < 0.05, ** indicates p < 0.01, and *** indicates p < 0.001.
Figure 3.
Figure 3.
Biodistribution and in vivo bioactivity of PINCs. A) Schematic showing the animal study design. B) Biodistributions of CS-PGE2-PINCs and NCs after intravenous delivery in mice with myocardial I/R injury. Representative ex vivo fluorescent imaging of mouse organs (heart, lung, liver, kidney, and spleen) at 14 d post-intravenous injections of CS-PGE2-PINCs and NCs. C) Quantitative analysis of fluorescent intensities (n = 3 animals per group). D) Representative images showing cycling cardiomyocytes (yellow arrowheads) as indicated by α-SA and Ki67 double-positive staining in the peri-infarct regions of the hearts treated with CS-PINCs, PGE2-PINCs, and CS-PGE2-PINCs at week 4. E) Quantification of Ki67-positive cardiomyocytes at week 4 in the saline control (n = 5), CS-PINC (n = 6), PGE2-PINC (n = 6), and CS-PGE2-PINC (n = 6) groups. Scale bars, 50 μm. All data are mean ± s.d. Comparisons between any two groups were performed using two-tailed unpaired Student’s t-test. Comparisons among more than two groups were performed using one-way ANOVA followed by post hoc Bonferroni test. * indicates p < 0.05, and ** indicates p < 0.01.
Figure 4.
Figure 4.
In vivo mitotic activities of cardiomyocytes. A, B) Visualization of phospho-histone H3 phosphorylation in cardiomyocytes (yellow arrowheads) in the peri-infarct regions of saline control-, CS-PINC-, PGE2-PINC-, and CS-PGE2-PINC-treated hearts at week 4. Representative images are in (A) (blue: DAPI, staining nuclei; red: α-SA, staining cardiomyocytes; green: pH3, indicating the cells that are in late G2/mitosis phase; the green square highlights the localization of pH3 (yellow arrowheads) in the nuclei of cycling cardiomyocytes). Quantification in (B) shows pH3-positive cardiomyocytes at week 4 in the saline control (n = 5), CS-PINC (n = 6), PGE2-PINC (n = 6), and CS-PGE2-PINC (n = 6) groups. C, D) Visualization of AURKB in cardiomyocytes (yellow arrowheads) in the peri-infarct regions of saline control-, CS-PINC-, PGE2-PINC-, and CS-PGE2-PINC-treated hearts at week 4. Representative images are in (C) (blue: DAPI, staining nuclei; red: α-SA, staining cardiomyocytes; green: AURKB, marking the cells in karyokinesis and cytokinesis; the green square highlights the localization of AURKB in mid-bodies (yellow arrowheads). Quantification in (D) shows AURKB-positive cardiomyocytes at week 4 in the saline control (n = 5), CS-PINC (n = 6), PGE2-PINC (n = 6), and CS-PGE2-PINC (n = 6) groups. Scale bars, 20 μm. All data are mean ± s.d. Comparisons among more than two groups were performed using one-way ANOVA followed by post hoc Bonferroni test. * indicates p < 0.05; ** indicates p < 0.01; and *** indicates p < 0.001.
Figure 5.
Figure 5.
Functional benefits of PINC therapy in mice with myocardial I/R injury. A) Representative Masson’s trichrome-stained sections showing scar tissue (blue) and viable myocardium (red) from the basal, mid-left ventricular (LV), and apical regions of the hearts 4 weeks after treatment with saline (n = 5), CS-PINCs (n = 6), PGE2-PINCs (n = 6), and CS-PGE2-PINCs (n = 6), respectively. B, C) Quantitative analyses of B) viable myocardium and C) scar size from the Masson’s trichrome images. D) LVEDV and E) LVESV measured by echocardiography at 4 weeks after I/R in mice treated with saline, CS-PINCs, PGE2-PINCs, and CS-PGE2-PINCs, respectively. F) LVEF measured by echocardiography at baseline (4 h post-I/R) and 4 weeks afterward in the saline, CS-PINC, PGE2-PINC, and CS-PGE2-PINC groups. Scale bar, 2 mm. All data are mean ± s.d. * indicates p < 0.05; ** indicates p < 0.01; and *** indicates p < 0.001. G) Treatment effects were assessed by the change in LVEF over the 4-week time course relative to baseline. # indicates p < 0.05 when compared with saline control group; and † indicates p < 0.05 when compared with any other groups.
Figure 6.
Figure 6.
PINC injection promotes endogenous repair in the infarcted heart. A–C) Representative images showing Nkx2.5-positive cells, CD34-positive cells, and vWF-positive capillaries in the infarcted hearts 4 weeks after saline (n = 5), CS-PINC (n = 6), PGE2-PINC (n = 6), or CS-PGE2-PINC (n = 6) treatment. Yellow arrowheads indicate the positively stained cells. D–F) Quantification of the number of D) Nkx2.5-positive cells, E) CD34-positive cells, and F) vWF-positive capillary density in the infarcted hearts 4 weeks after saline (n = 5), CS-PINC (n = 6), PGE2-PINC (n = 6), or CS-PGE2-PINC (n = 6) treatment. Scale bars, A, B) 20 μm; and C) 100 μm. Comparisons among more than two groups were performed using one-way ANOVA followed by post hoc Bonferroni test. * indicates p < 0.05; ** indicates p < 0.01; and *** indicates p < 0.001.

References

    1. Townsend N, Wilson L, Bhatnagar P, Wickramasinghe K, Rayner M, Nichols M, Eur. Heart J 2016, 37, 3232. - PubMed
    1. Chouchani ET, Pell VR, Gaude E, Aksentijevic D, Sundier SY, Robb EL, Logan A, Nadtochiy SM, Ord ENJ, Smith AC, Eyassu F, Shirley R, Hu C-H, Dare AJ, James AM, Rogatti S, Hartley RC, Eaton S, Costa ASH, Brookes PS, Davidson SM, Duchen MR, Saeb-Parsy K, Shattock MJ, Robinson AJ, Work LM, Frezza C, Krieg T, Murphy MP, Nature 2014, 515, 431. - PMC - PubMed
    1. Bolli R, Ghafghazi S, Nat. Rev. Cardiol 2017, 14, 257. - PubMed
    1. Lin Z, Pu WT, Sci. Transl. Med 2014, 6, 239rv1. - PMC - PubMed
    1. Fischer UM, Harting MT, Jimenez F, Monzon-Posadas WO, Xue H, Savitz SI, Laine GA, Cox CS, Stem Cells Dev. 2009, 18, 683. - PMC - PubMed

LinkOut - more resources