. 2020 Mar 18:13:40.
doi: 10.3389/fnmol.2020.00040. eCollection 2020.

Characterization of Oxytocin Receptor Expression Within Various Neuronal Populations of the Mouse Dorsal Hippocampus

Affiliations

Characterization of Oxytocin Receptor Expression Within Various Neuronal Populations of the Mouse Dorsal Hippocampus

W Scott Young et al. Front Mol Neurosci. .

Abstract

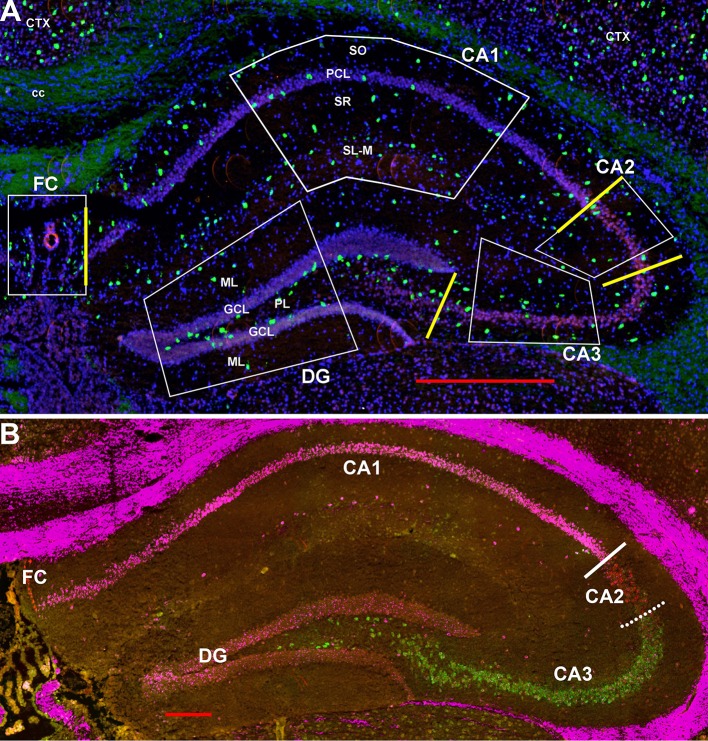
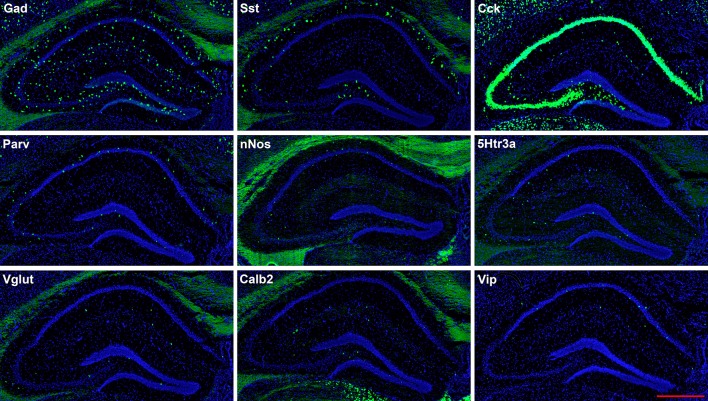
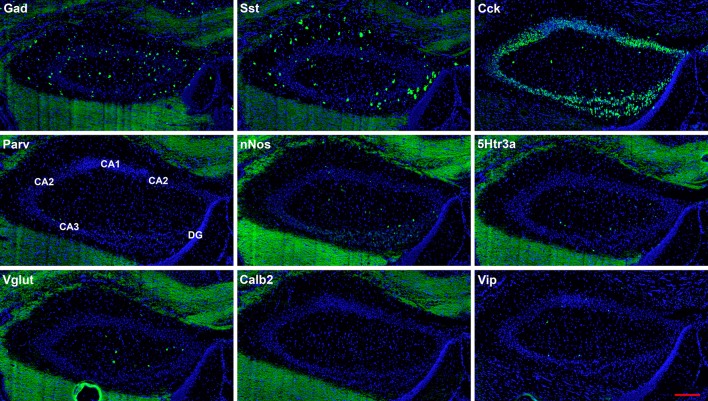
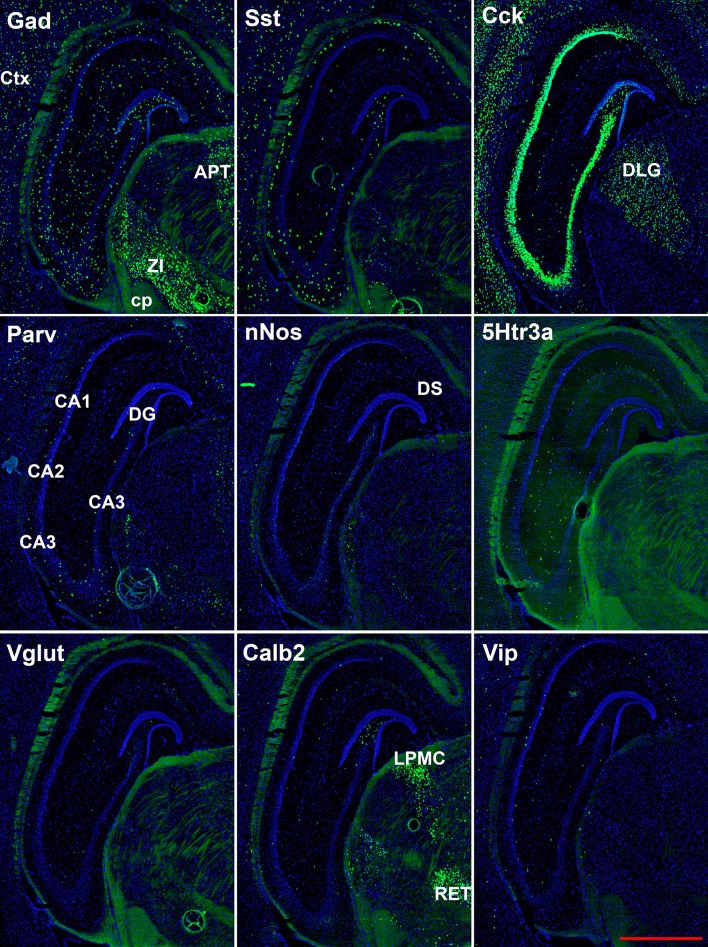
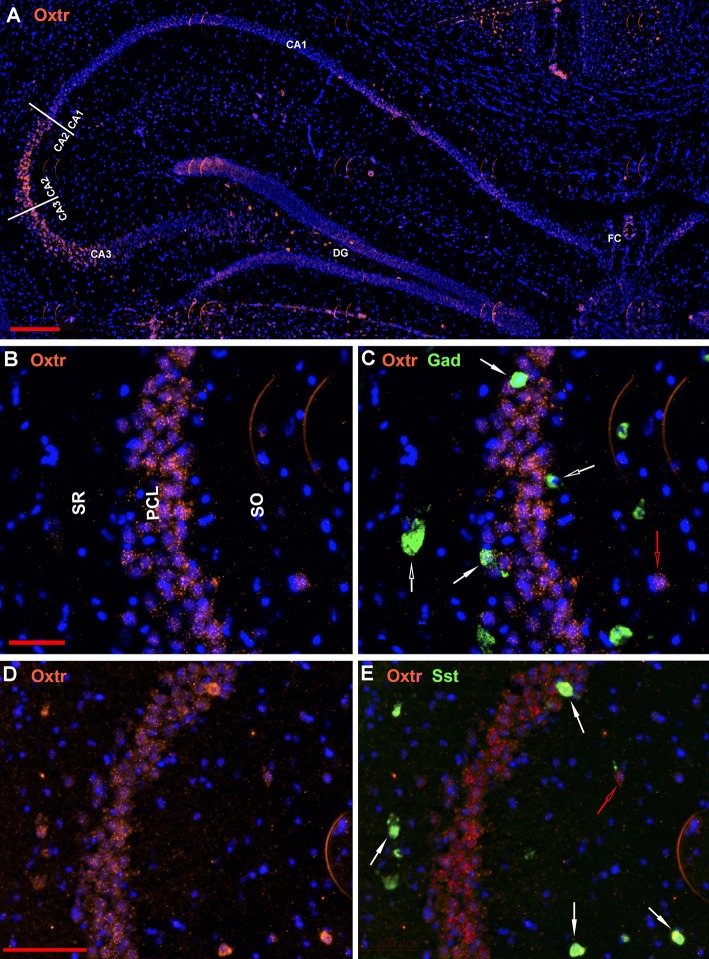
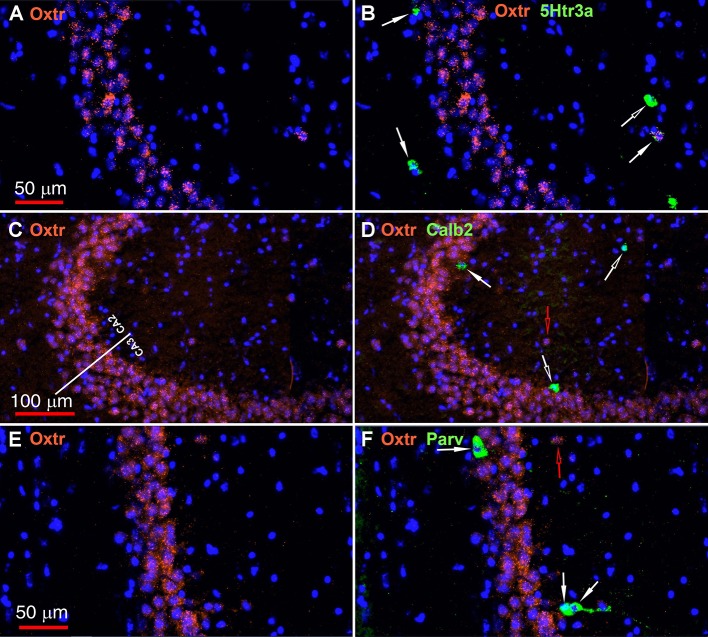
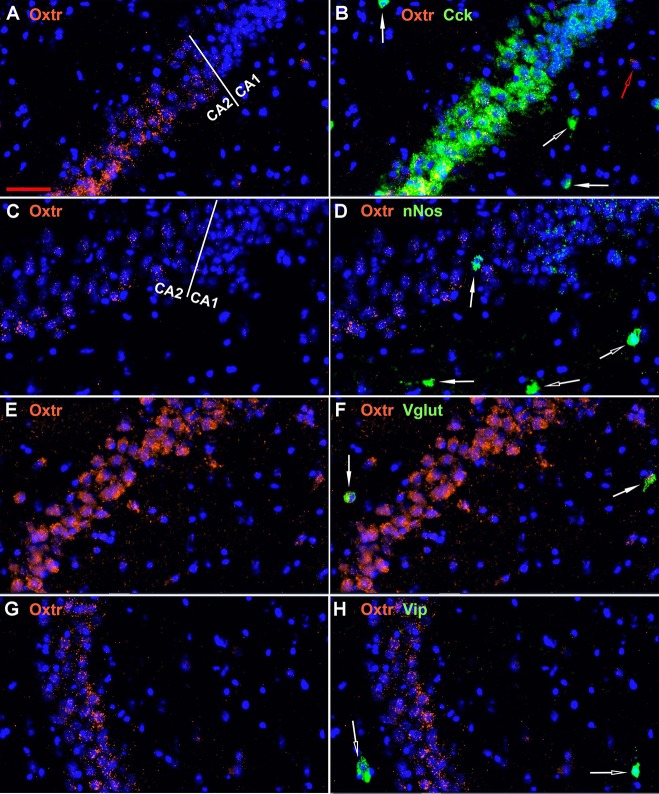
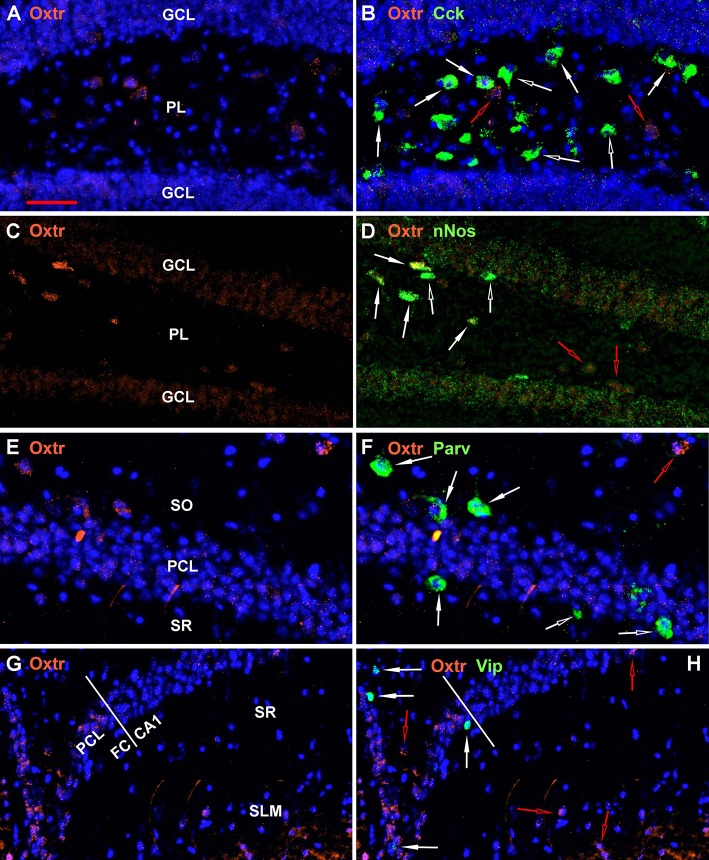
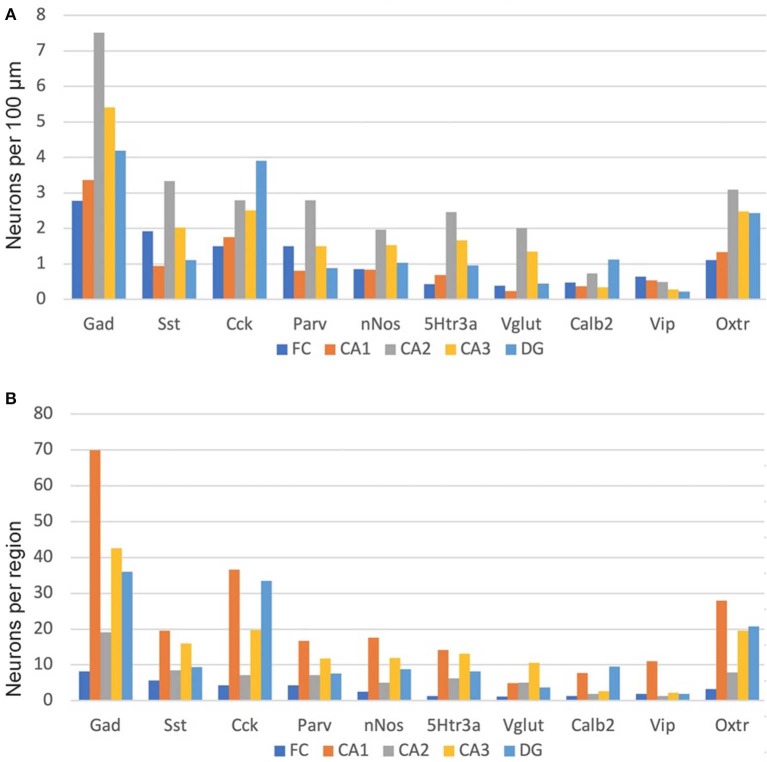
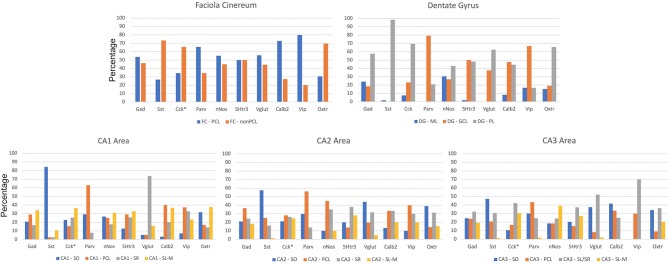
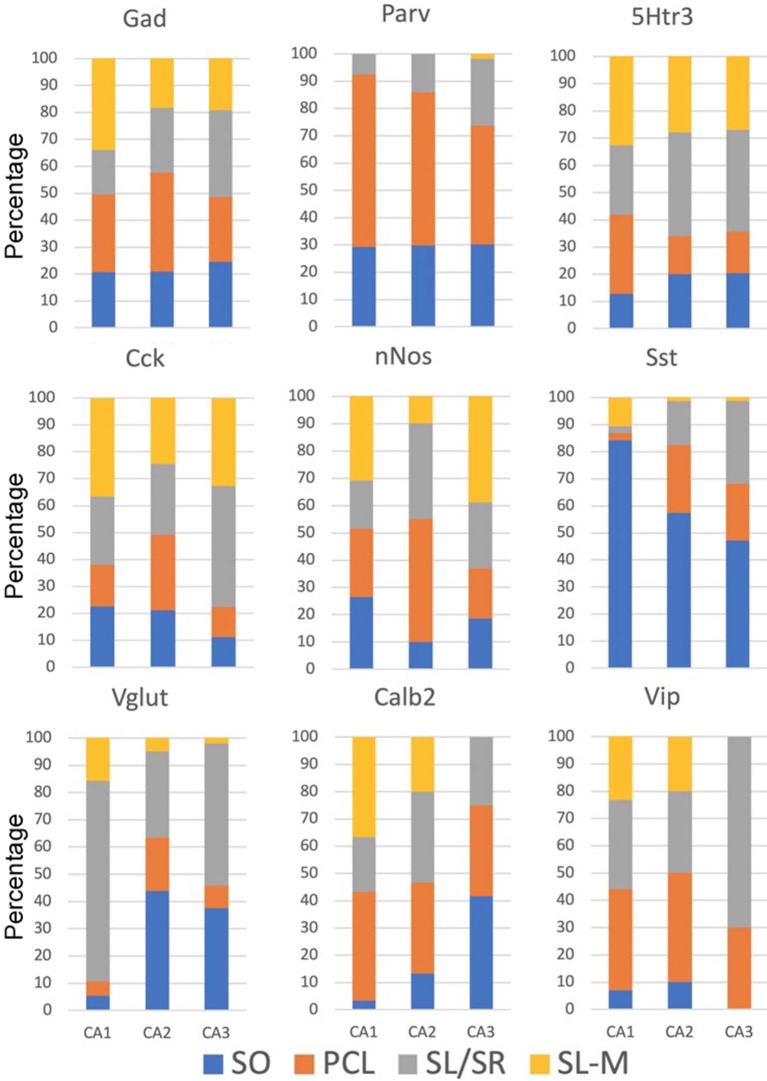
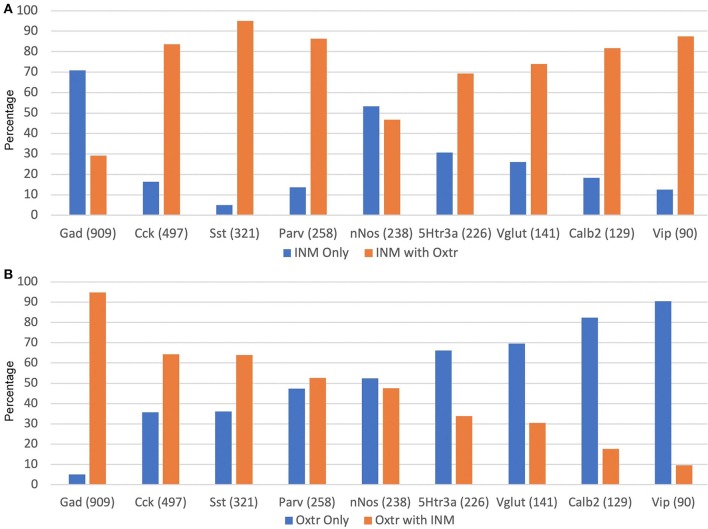
Oxytocin, acting through the oxytocin receptor (Oxtr) in the periphery, is best known for its roles in regulating parturition and lactation. However, it is also now known to possess a number of important social functions within the central nervous system, including social preference, memory and aggression, that vary to different degrees in different species. The Oxtr is found in both excitatory and inhibitory neurons within the brain and research is focusing on how, for example, activation of the receptor in interneurons can enhance the signal-to-noise of neuronal transmission. It is important to understand which neurons in the mouse dorsal hippocampus might be activated during memory formation. Therefore, we examined the colocalization of transcripts in over 5,000 neurons for Oxtr with those for nine different markers often found in interneurons using hairpin chain reaction in situ hybridization on hippocampal sections. Most pyramidal cell neurons of CA2 and many in the CA3 express Oxtr. Outside of those excitatory neurons, over 90% of Oxtr-expressing neurons co-express glutamic acid decarboxylase-1 (Gad-1) with progressively decreasing numbers of co-expressing cholecystokinin, somatostatin, parvalbumin, neuronal nitric oxide synthase, the serotonin 3a receptor, the vesicular glutamate transporter 3, calbindin 2 (calretinin), and vasoactive intestinal polypeptide neurons. Distributions were analyzed within hippocampal layers and regions as well. These findings indicate that Oxtr activation will modulate the activity of ~30% of the Gad-1 interneurons and the majority of the diverse population of those, mostly, interneuron types specifically examined in the mouse hippocampus.

Keywords: calbindin; cholecystokinin; cornu ammonis 2; glutamic acid decarboxylase; hairpin chain reaction; nitric oxide synthase; parvalbumin; somatostatin.


Figures

Figure 1
Figure 1
(A) Representative areas in which interneurons were counted at 1.8 mm behind the bregma showing Gad-1 cells. CA1-4, cornu ammonis 1–4 regions; cc, corpus callosum; Ctx, neocortex; DF, dentate gyrus; FC, fasciola cinereum; GCL, granule cell layer; PCL, pyramidal cell layer; PL, polymorphic layer (hilus); SL-M, stratum lacunosum-moleculaire; SO, stratum oriens; SR, stratum radiatum. Yellow bars indicate the boundaries used between FC, CA1, CA2, CA3, and DG to calculate region lengths for Figure 9. Bar is 500 μm. (B) Similar section probed for Trpc4 in CA1 (magenta), Amigo2 in CA2 (red), and Bok in CA3 (green) to show the CA1-CA2 and CA2-CA3 boundaries. Whereas, the former boundary is fairly strict, there is considerable mixing of CA2 and CA3 cell types at that “border.” Bar is 200 μm.
Figure 2
Figure 2
Representative low-magnification photomicrographs showing expression of nine interneuron types in sections 1.8 mm behind the bregma. This is the level at which the interneurons were counted. See Figure 1 for hippocampal layer and region delineations. White matter tracts show some autofluorescence (green) in some panels. In this and subsequent figures, Gad and Vglut stand for Gad-1 and Vglut3, respectively. The bar equals 500 μm for all panels.
Figure 3
Figure 3
Representative low-magnification photomicrographs of very anterior dorsal hippocampus at 1.1 mm behind the bregma showing expression of nine interneuron types. White matter tracts show some autofluorescence (green) in some panels. The bar equals 200 μm for all panels.
Figure 4
Figure 4
Representative low-magnification photomicrographs showing expression of nine interneuron types 2.6 mm behind the bregma. White matter tracts show some autofluorescence (green) in some panels. Bar equals 1 mm for all panels. APT, anterior pretectal n. caudal; cp, cerebral peduncle; Ctx, neocortex; DLG, dorsal lateral geniculate; DS, dorsal subiculum; LPMC, lateral posterior nucleus mediocaudal; RET, retroethmoid nucleus; ZI, zona incerta. The bar equals 1 mm for all panels.
Figure 5
Figure 5
Examples of the distribution of Oxtr neurons within the hippocampus. (A) shows the distribution in a low magnification view (scale bar equals 200 μm). (B) shows higher magnification within the CA2 region and (C) shows the Oxtr colocalization with Gad-1 [scale bar of 50 μm for (B,C)]. (D) shows higher magnification within the CA2 region and (E) shows the Oxtr colocalization with Sst [scale bar equals 100 μm for (D,E)]. Solid white arrows indicate colocalization of Oxtr transcripts with the INM transcripts. Open white arrows indicate only expression of the INM. Open red arrows indicate only expression of Oxtr.
Figure 6
Figure 6
Examples of the distribution of Oxtr within the CA2 hippocampal region. (A) shows Oxtr expression in the CA2 and (B) shows its colocalization with 5Htr3a transcripts. (C) shows Oxtr expression in the CA2 and (D) shows expression with Calb2 transcripts. (E) shows Oxtr expression in the CA2 and panel F shows its colocalization with Parv transcripts. Scale bars in (A) 50 μm, (C) 100 μm, and (E) 50 μm are also for (B,D,F), respectively. Solid white arrows indicate colocalization of Oxtr transcripts with the INM transcripts. Open white arrows indicate only expression of the INM. Open red arrows indicate only expression of Oxtr.
Figure 7
Figure 7
Examples of the distribution of Oxtr within the CA2 hippocampal region. (A) shows Oxtr expression in the CA2 and (B) shows its colocalization with Cck transcripts. Cck expression also occurs in pyramidal neurons but less in the CA1 neurons. (C) shows Oxtr expression in the CA2 and (D) shows co-expression with nNos transcripts. In contrast to Cck, nNos expression is not apparent in the CA2 but is present in the CA1 pyramidal neurons. (E) shows Oxtr expression in the CA2 and (F) shows its colocalization with Vglut3 (Vglut) transcripts. (G) shows Oxtr expression in the CA2 and (H) shows its expression with Vip transcripts. Bar in (A) is 50 μm and applies to all panels. Solid white arrows indicate colocalization of Oxtr transcripts with the INM transcripts. Open white arrows indicate only expression of the INM. Open red arrow indicates only expression of Oxtr.
Figure 8
Figure 8
Examples of the distribution of Oxtr within some hippocampal regions. (A) shows Oxtr expression in the DG and (B) shows its colocalization with Cck transcripts. (C) shows Oxtr expression in the DG and (D) shows its co-expression with nNos transcripts. In contrast to Cck, nNos expression is not apparent in the CA2 but is present in the CA1 pyramidal neurons. (E) shows Oxtr expression in the CA1 and (F) shows its colocalization with Parv transcripts. (G) shows Oxtr expression in the FC and CA1 regions and (H) shows its colocalization with Vip transcripts. FC pyramidal cells express Oxtr similarly to the CA2. Bar in (A) is 50 μm and applies to all panels. Solid white arrows indicate colocalization of Oxtr transcripts with the INM transcripts. Open white arrows indicate only expression of the INM. Open red arrows indicate only expression of Oxtr.
Figure 9
Figure 9
Interneuron types per length in the hippocampal regions (A) and, as well, as per total hippocampal region area (B). See the Methods and Methods for the measured lengths and calculations. Cck and Oxtr neurons in the PCL of FC, CA2, and CA3 were counted if they co-expressed Gad-1.
Figure 10
Figure 10
Distribution of interneurons in sublayers of the hippocampus by region by percentage. *Cck and Oxtr neurons in the PCL of FC, CA2, and CA3 were counted if they co-expressed Gad-1. GCL, granule cell layer; ML, molecular layer; PCL, pyramidal cell layer; SL/SR, stratum lucidum/radiatum; SL-M, stratum lacunosum-moleculare; SO, stratum oriens; SR, stratum radiatum.
Figure 11
Figure 11
Percentages of different interneurons in sublayers of the CA regions by marker. Cck neurons in the PCL of FC, CA2, and CA3 were counted if they co-expressed Gad-1. GCL, granule cell layer; ML, molecular layer; PCL, pyramidal cell layer; SL/SR, stratum lucidum/radiatum; SL-M, stratum lacunosum-moleculare; SO, stratum oriens; SR, stratum radiatum.
Figure 12
Figure 12
Percentages of INM-expressing neurons containing Oxtr (A) or Oxtr-expressing neurons containing an interneuron marker (B). The total numbers of each type of INM-expressing neuron are indicated within parentheses. Three thousand seven hundred total Oxtr interneurons were counted.
Figure 13
Figure 13
Not all neurons examined expressing INMs in the hippocampus express Gad-1, although the great majority do. Examples of Calb2 neurons in the DG, a 5Htr3a neuron in CA1, and two Cck neurons in CA1 that do not express Gad-1 are indicated by the open arrows in (A–C,D–F,G–I), respectively. Scale bars for (A–C,D–F,G–I), are 50, 100, and 50 μm, respectively.

Similar articles

Cited by

References

    1. Anstotz M., Maccaferri G. (2020). A toolbox of criteria for distinguishing cajal-retzius cells from other neuronal types in the postnatal mouse hippocampus. eNeuro 7:ENEURO.0516-19.2019. 10.1523/ENEURO.0516-19.2019 - DOI - PMC - PubMed
    1. Basu J., Srinivas K. V., Cheung S. K., Taniguchi H., Huang Z. J., Siegelbaum S. A. (2013). A cortico-hippocampal learning rule shapes inhibitory microcircuit activity to enhance hippocampal information flow. Neuron 79, 1208–1221. 10.1016/j.neuron.2013.07.001 - DOI - PMC - PubMed
    1. Benes F. M., Berretta S. (2001). GABAergic interneurons: implications for understanding schizophrenia and bipolar disorder. Neuropsychopharmacology 25, 1–27. 10.1016/S0893-133X(01)00225-1 - DOI - PubMed
    1. Benes F. M., Kwok E. W., Vincent S. L., Todtenkopf M. S. (1998). A reduction of non-pyramidal cells in sector CA2 of schizophrenics and manic depressives. Biol. Psychiatry 44, 88–97. 10.1016/S0006-3223(98)00138-3 - DOI - PubMed
    1. Benes F. M., Sorensen I., Bird E. D. (1991). Reduced neuronal size in posterior hippocampus of schizophrenic patients. Schizophr. Bull. 17, 597–608. 10.1093/schbul/17.4.597 - DOI - PubMed