. 2020 Mar 18:11:396.
doi: 10.3389/fmicb.2020.00396. eCollection 2020.

Deciphering the Metabolic Pathway Difference Between Saccharopolyspora pogona and Saccharopolyspora spinosa by Comparative Proteomics and Metabonomics

Affiliations

Deciphering the Metabolic Pathway Difference Between Saccharopolyspora pogona and Saccharopolyspora spinosa by Comparative Proteomics and Metabonomics

Jie Rang et al. Front Microbiol. .

Abstract

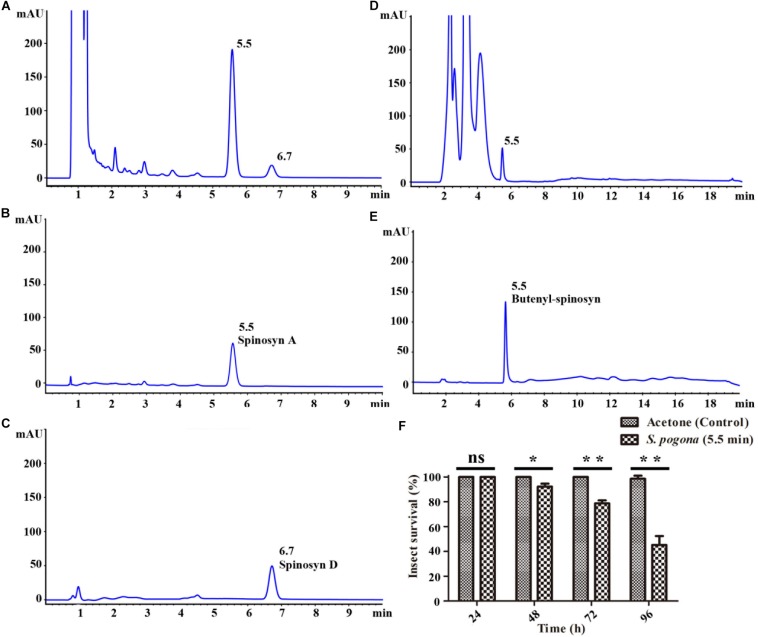
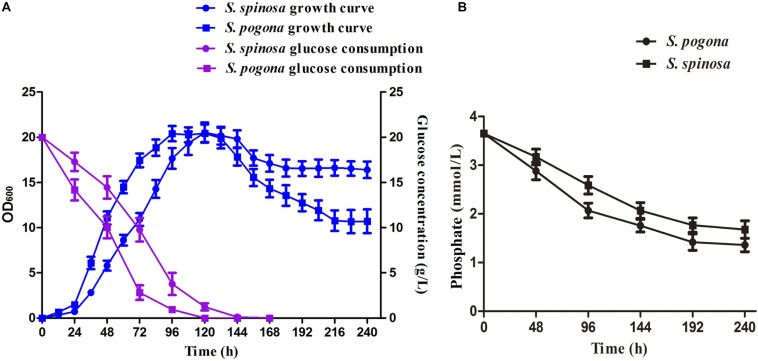
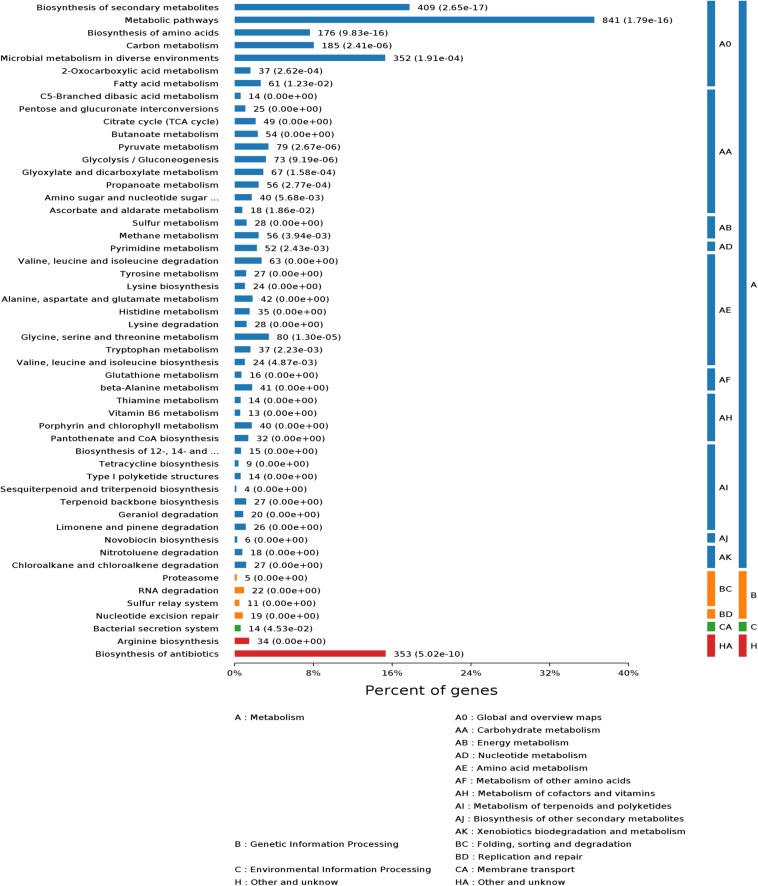
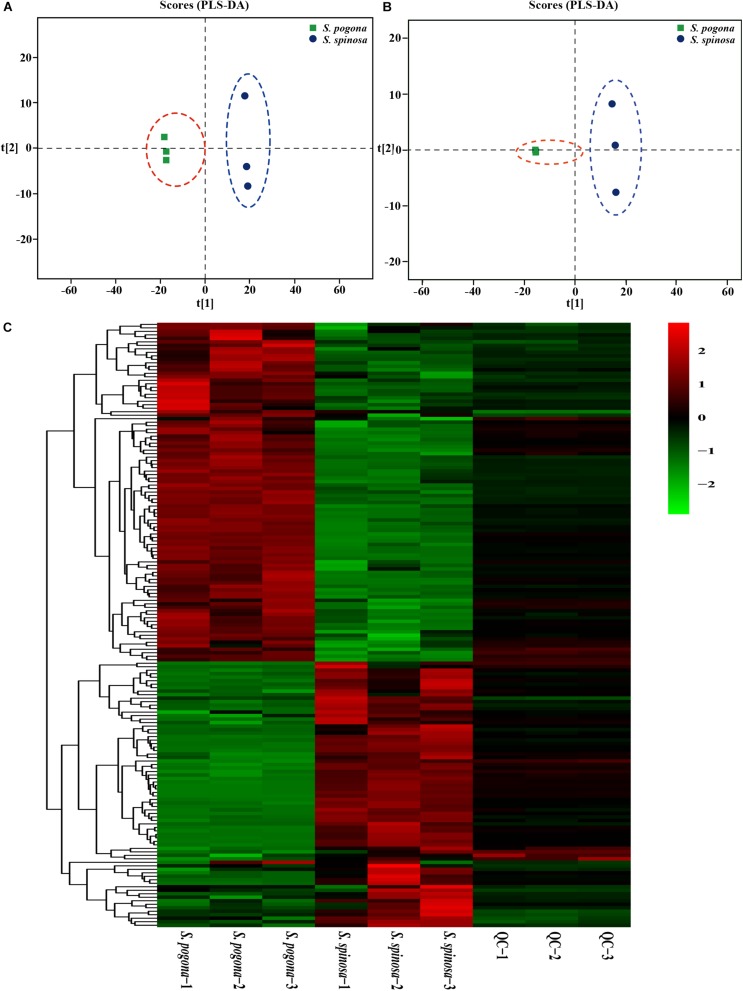
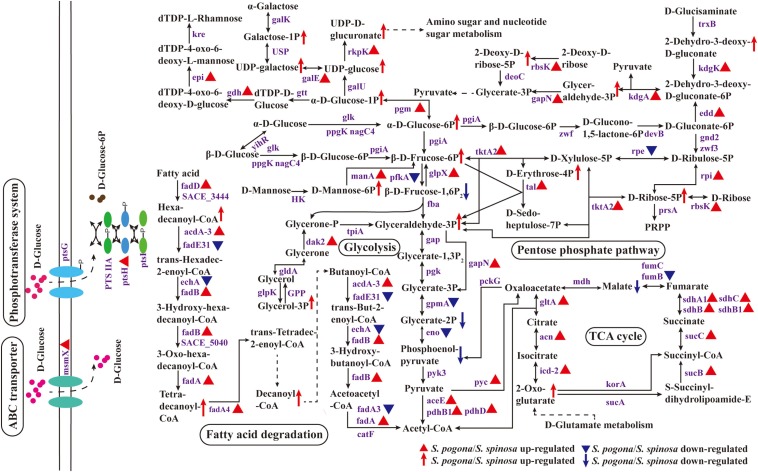
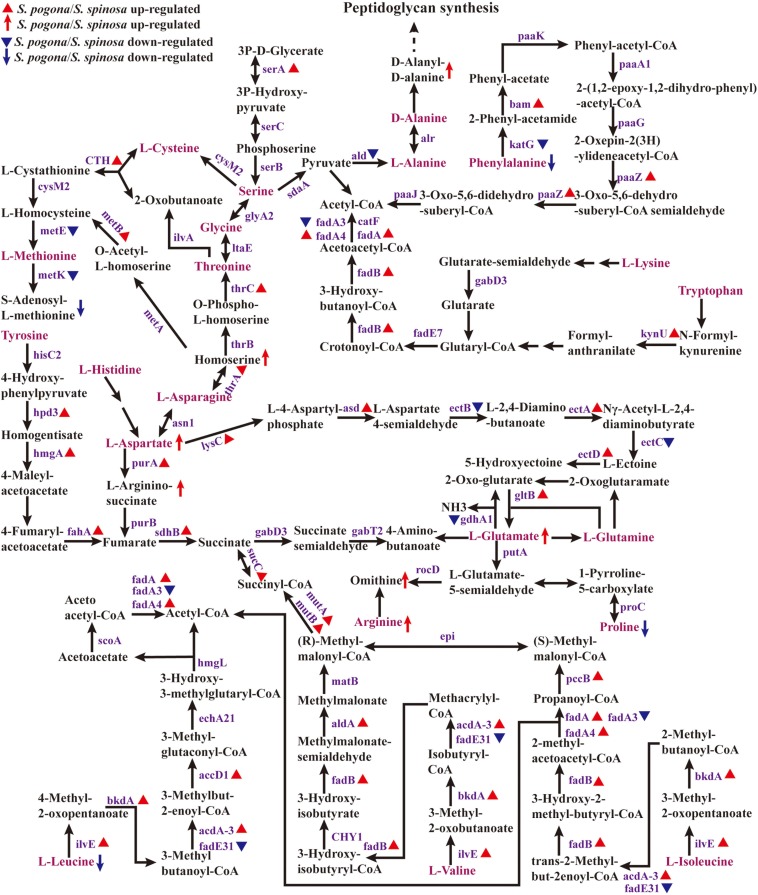
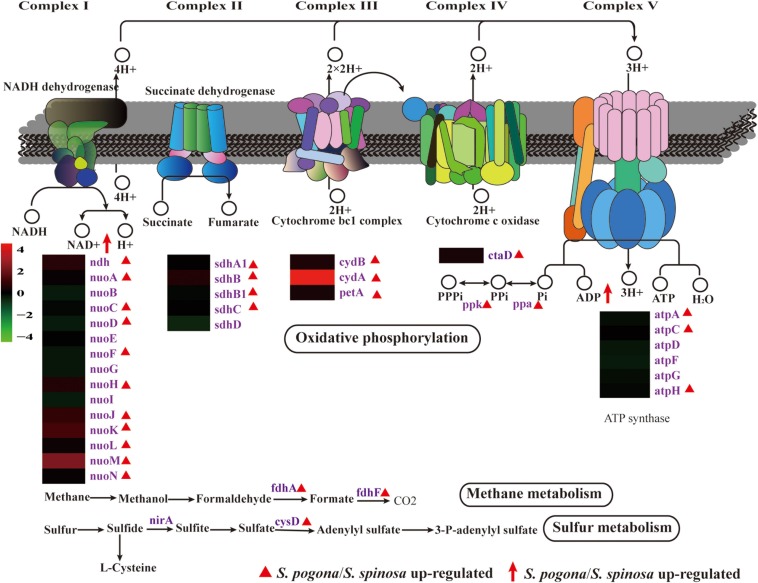
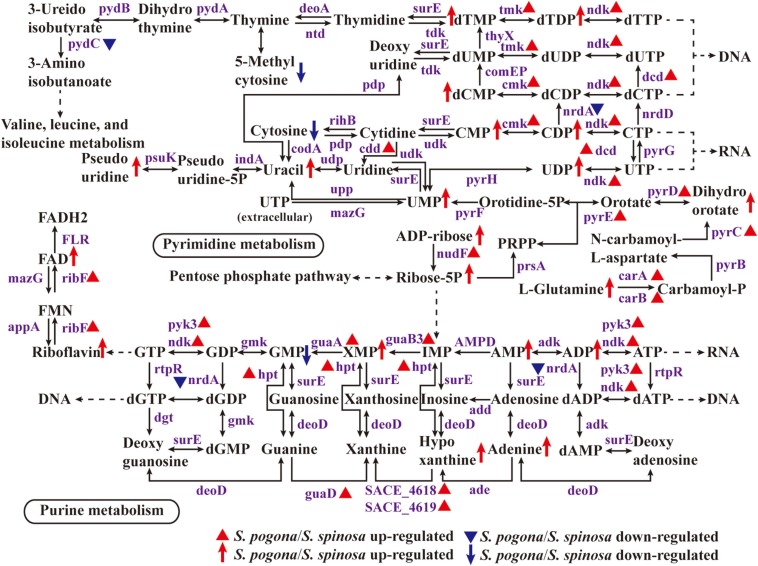
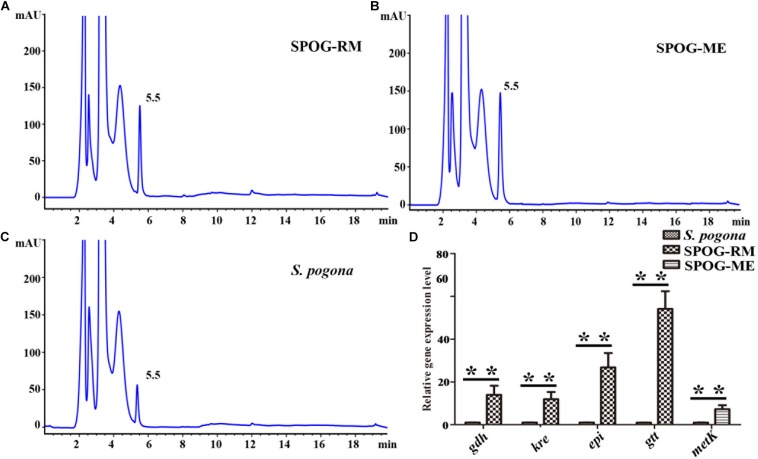
Butenyl-spinosyn, a secondary metabolite produced by Saccharopolyspora pogona, exhibits strong insecticidal activity than spinosyn. However, the low synthesis capacity and unknown metabolic characteristics of butenyl-spinosyn in wild-type S. pogona limit its broad application and metabolic engineering. Here, we showed that S. pogona exhibited increased glucose consumption ability and growth rate compared with S. spinosa, but the production of butenyl-spinosyn was much lower than that of spinosyn. To further elucidate the metabolic mechanism of these different phenotypes, we performed a comparative proteomic and metabolomic study on S. pogona and S. spinosa to identify the change in the abundance levels of proteins and metabolites. We found that the abundance of most proteins and metabolites associated with glucose transport, fatty acid metabolism, tricarboxylic acid cycle, amino acid metabolism, energy metabolism, purine and pyrimidine metabolism, and target product biosynthesis in S. pogona was higher than that in S. spinosa. However, the overall abundance of proteins involved in butenyl-spinosyn biosynthesis was much lower than that of the high-abundance protein chaperonin GroEL, such as the enzymes related to rhamnose synthesis. We speculated that these protein and metabolite abundance changes may be directly responsible for the above phenotypic changes in S. pogona and S. spinosa, especially affecting butenyl-spinosyn biosynthesis. Further studies revealed that the over-expression of the rhamnose synthetic genes and methionine adenosyltransferase gene could effectively improve the production of butenyl-spinosyn by 2.69- and 3.03-fold, respectively, confirming the reliability of this conjecture. This work presents the first comparative proteomics and metabolomics study of S. pogona and S. spinosa, providing new insights into the novel links of phenotypic change and metabolic difference between two strains. The result will be valuable in designing strategies to promote the biosynthesis of butenyl-spinosyn by metabolic engineering.

Keywords: Saccharopolyspora pogona; Saccharopolyspora spinosa; butenyl-spinosyn; comparative proteomic analysis; metK; metabolic pathway; rhamnose synthetic genes; spinosyn.


Figures

FIGURE 1
FIGURE 1
HPLC analysis of spinosyn and butenyl-spinosyn. (A) Fermentation broth of wild-type strain S. spinosa. (B) Standard spinosyn A. (C) Standard spinosyn D. (D) Fermentation broth of wild-type strain S. pogona. (E) Purified butenyl-spinosyn. (F) Analysis of insecticidal activity of H. armigera of the eluent collected at 5.5 min. *p < 0.05, **p < 0.01, ns, no significant.
FIGURE 2
FIGURE 2
Comparison of growth characteristics between S. pogona and S. spinosa. (A) Growth kinetics and glucose consumption analysis. (B) Determination of phosphate in SFM.
FIGURE 3
FIGURE 3
Kyoto encyclopedia of genes and genomes (KEGG) functional classification of the common proteins in S. pogona and S. spinosa. The number of genes associated with each pathway is indicated.
FIGURE 4
FIGURE 4
PLS-DA and heatmap analysis of intracellular metabolites from S. pogona and S. spinosa. (A) PLS-DA score graph of positive ion model. (B) PLS-DA score graph of negative ion model. (C) Heatmap analysis of significantly different metabolites in different samples.
FIGURE 5
FIGURE 5
Protein and metabolite changes of the central carbon metabolic pathway in S. pogona and S. spinosa. The protein changes are from iTraq-labeled identification results. The proteins indicated in triangle pattern (red or blue) represent significant differences in S. pogona. The metabolite changes are from metabolomic analysis results. The metabolites indicated in arrow (red or blue) represent significant differences in S. pogona. TCA cycle, citrate cycle; PTS system, phosphotransferase system; P, phosphate; PRPP, 5-phospho-alpha-D-ribose 1-diphosphate.
FIGURE 6
FIGURE 6
Protein and metabolite changes of the amino acids metabolism in S. pogona and S. spinosa. The protein changes are from iTraq-labeled identification results. The proteins identified are indicated in purple. The proteins indicated in triangle pattern (red or blue) represent significant differences in S. pogona. The metabolite changes are from metabolomic analysis results. The metabolites indicated in arrow (red or blue) represent significant differences in S. pogona. The multistep reaction is indicated in consecutive arrows. P, phosphate.
FIGURE 7
FIGURE 7
Protein and metabolite changes of energy metabolism in S. pogona and S. spinosa. The protein changes are from iTraq-labeled identification results. The proteins identified are indicated in purple. The proteins indicated in triangle pattern (red) represent significant differences in S. pogona. The metabolite changes are from metabolomic analysis results. The metabolites indicated in arrow (red) represent significant differences in S. pogona.
FIGURE 8
FIGURE 8
Protein and metabolite changes of nucleotide metabolism in S. pogona and S. spinosa. The protein changes are from iTraq-labeled identification results. The proteins identified are indicated in purple. The proteins indicated in triangle pattern (red or blue) represent significant differences in S. pogona. The metabolite changes are from metabolomic analysis results. The metabolites indicated in arrow (red or blue) represent significant differences in S. pogona.
FIGURE 9
FIGURE 9
The over-expression of rhamnose synthetic genes and metK promote butenyl-spinosyn biosynthesis. (A) Fermentation broth of mutant SPOG-RM. (B) Fermentation broth of mutant SPOG-ME. (C) Fermentation broth of S. pogona. (D) Transcript analyses of rhamnose biosynthetic genes and metK. The cells of the different strains were cultured in SFM and incubated at 30°C for 4 days. Total RNA were then isolated and used for qRT-PCR assays. The control strain was the wild-type S. pogona. The ratio for the control strain was arbitrarily set to “1”. The 16s RNA served as the normalization control. Error bars were calculated from four independent determinations of mRNA abundance in each sample. The ** represents the P-value less than 0.01.

Similar articles

Cited by

References

    1. Alba R. R., Diana R., Beatriz R. V., Víctor Tierrafría, Romina R. S., Daniel S. G., et al. (2016). Transcriptomic analysis of a classical model of carbon catabolite regulation in Streptomyces coelicolor. BMC Microbiol. 16:77. 10.1186/s12866-016-0690-y - DOI - PMC - PubMed
    1. Antonio R. G., Barreiro C., Solalanda A. (2010). Genome-wide transcriptomic and proteomic analysis of the primary response to phosphate limitation in Streptomyces coelicolor M145 and in a DeltaphoP mutant. Proteomics 7 2410–2429. 10.1002/pmic.200600883 - DOI - PubMed
    1. Blanc M. P., Panighini C., Gadani F., Rossi L. (2004). Activity of spinosad on stored-tobacco insects and persistence on cured tobacco stripst. Pest Manag. Sci. 60 1091–1098. 10.1002/ps.930 - DOI - PubMed
    1. Chubukov V., Gerosa L., Kochanowski K., Sauer U. (2014). Coordination of microbial metabolism. Nat. Rev. Microbiol. 12 327–340. 10.1038/nrmicro3238 - DOI - PubMed
    1. Daniel J. K. (2019). Energy metabolism, oxygen flux, and iron in bacteria: the mössbauer report. J. Biol. Chem. 294 63–64. 10.1074/jbc.h118.006703 - DOI - PMC - PubMed