Regulatory Diversity and Functional Analysis of Two-Component Systems in Cyanobacterium Synechocystis sp. PCC 6803 by GC-MS Based Metabolomics
- PMID: 32256471
- PMCID: PMC7090099
- DOI: 10.3389/fmicb.2020.00403
Regulatory Diversity and Functional Analysis of Two-Component Systems in Cyanobacterium Synechocystis sp. PCC 6803 by GC-MS Based Metabolomics
Abstract
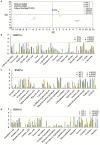
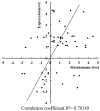
Two-component signal transduction systems are still poorly functionally characterized in the model cyanobacterium Synechocystis sp. PCC 6803. To address the issue, a GC-MS based comparative metabolomic analysis was conducted on a library of 44 knockout mutants for the response regulators (RRs) in Synechocystis. The metabolomic profiling analysis showed that 7 RRs mutants, namely Δslr1909, Δsll1291, Δslr6040, Δsll1330, Δslr2024, Δslr1584, and Δslr1693, were significantly different at metabolomic level, although their growth patterns are similar to the wild type under the normal autotrophic growth condition, suggesting regulatory diversity of RRs at metabolite level in Synechocystis. Additionally, a detailed metabolomic analysis coupled with RT-PCR verification led to useful clues for possible function of these 7 RRs, which were found involved in regulation of multiple aspects of cellular metabolisms in Synechocystis. Moreover, an integrative metabolomic and evolutionary analysis of all RR showed that four groups of RR genes clustered together in both metabolomic and evolutionary trees, suggesting of possible functional conservation of these RRs during the evolutionary process. Meanwhile, six groups of RRs with close evolutionary origin were found with different metabolomic profiles, suggesting possible functional changes during evolution. In contrast, more than 10 groups of RR genes with different clustering patterns in the evolutionary tree were found clustered together in metabolomics-based tree, suggesting possible functional convergences during the evolution. This study provided a metabolomic view of RR function, and the most needed functional clues for further characterization of these regulatory proteins in Synechocystis.
Keywords: GC-MS; Synechocystis; metabolomics; response regulators; two-component signal transduction systems.
Copyright © 2020 Shi, Chen and Zhang.
Figures


Similar articles
-
Functional Diversity of Transcriptional Regulators in the Cyanobacterium Synechocystis sp. PCC 6803.Front Microbiol. 2017 Feb 21;8:280. doi: 10.3389/fmicb.2017.00280. eCollection 2017. Front Microbiol. 2017. PMID: 28270809 Free PMC article.
-
Crosstalk of two-component signal transduction systems in regulating central carbohydrate and energy metabolism during autotrophic and photomixotrophic growth of Synechocystis sp. PCC 6803.Integr Biol (Camb). 2017 May 22;9(5):485-496. doi: 10.1039/c7ib00049a. Integr Biol (Camb). 2017. PMID: 28485419
-
Integrated proteomic and metabolomic characterization of a novel two-component response regulator Slr1909 involved in acid tolerance in Synechocystis sp. PCC 6803.J Proteomics. 2014 Sep 23;109:76-89. doi: 10.1016/j.jprot.2014.06.021. Epub 2014 Jul 3. J Proteomics. 2014. PMID: 24998436
-
Signal transduction pathways in Synechocystis sp. PCC 6803 and biotechnological implications under abiotic stress.Crit Rev Biotechnol. 2015 Jun;35(2):269-80. doi: 10.3109/07388551.2013.838662. Epub 2013 Oct 1. Crit Rev Biotechnol. 2015. PMID: 24083451 Review.
-
Evolutionary process of stress response systems controlled by abscisic acid in photosynthetic organisms.Yakugaku Zasshi. 2005 Dec;125(12):927-36. doi: 10.1248/yakushi.125.927. Yakugaku Zasshi. 2005. PMID: 16327238 Review.
Cited by
-
Development of a CRISPR activation system for targeted gene upregulation in Synechocystis sp. PCC 6803.Commun Biol. 2025 May 21;8(1):772. doi: 10.1038/s42003-025-08164-y. Commun Biol. 2025. PMID: 40399557 Free PMC article.
-
Current Status and Future Strategies to Increase Secondary Metabolite Production from Cyanobacteria.Microorganisms. 2020 Nov 24;8(12):1849. doi: 10.3390/microorganisms8121849. Microorganisms. 2020. PMID: 33255283 Free PMC article. Review.
-
Distinct Molecular Patterns of Two-Component Signal Transduction Systems in Thermophilic Cyanobacteria as Revealed by Genomic Identification.Biology (Basel). 2023 Feb 8;12(2):271. doi: 10.3390/biology12020271. Biology (Basel). 2023. PMID: 36829548 Free PMC article.
References
LinkOut - more resources
Full Text Sources
Miscellaneous

