. 2020 Mar 17:11:467.
doi: 10.3389/fimmu.2020.00467. eCollection 2020.

PD-1-Mediated PI3K/Akt/mTOR, Caspase 9/Caspase 3 and ERK Pathways Are Involved in Regulating the Apoptosis and Proliferation of CD4+ and CD8+ T Cells During BVDV Infection in vitro

Affiliations

PD-1-Mediated PI3K/Akt/mTOR, Caspase 9/Caspase 3 and ERK Pathways Are Involved in Regulating the Apoptosis and Proliferation of CD4+ and CD8+ T Cells During BVDV Infection in vitro

Yu Liu et al. Front Immunol. .

Abstract

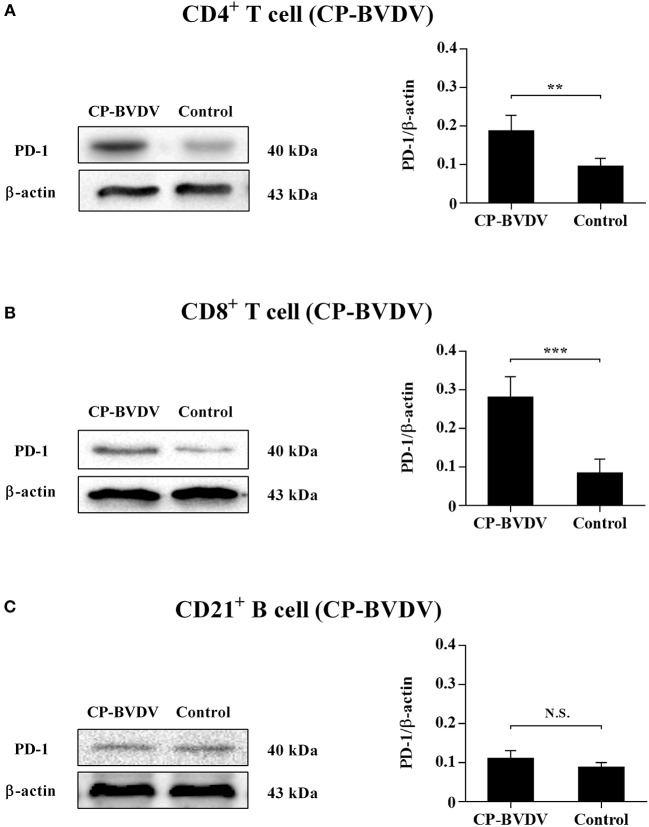
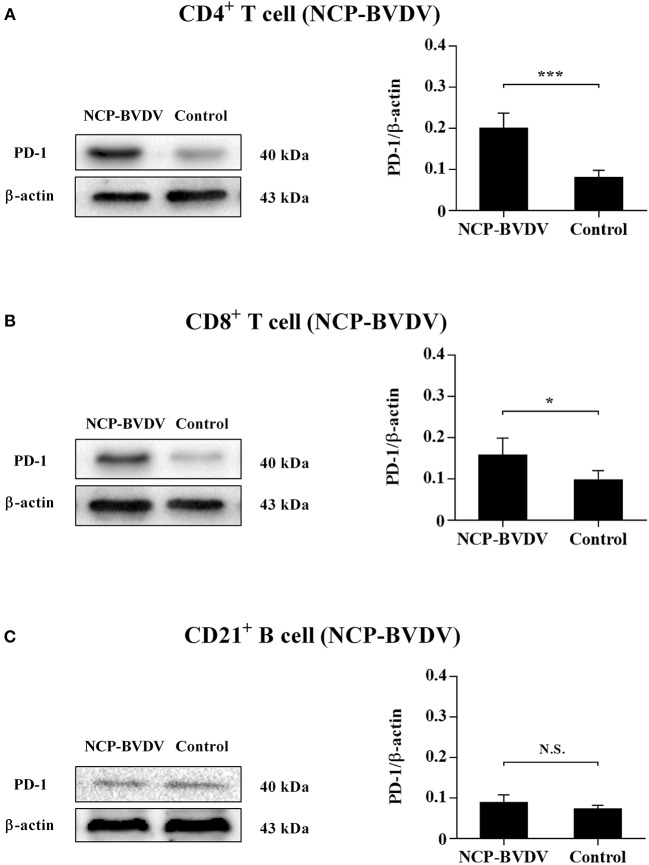
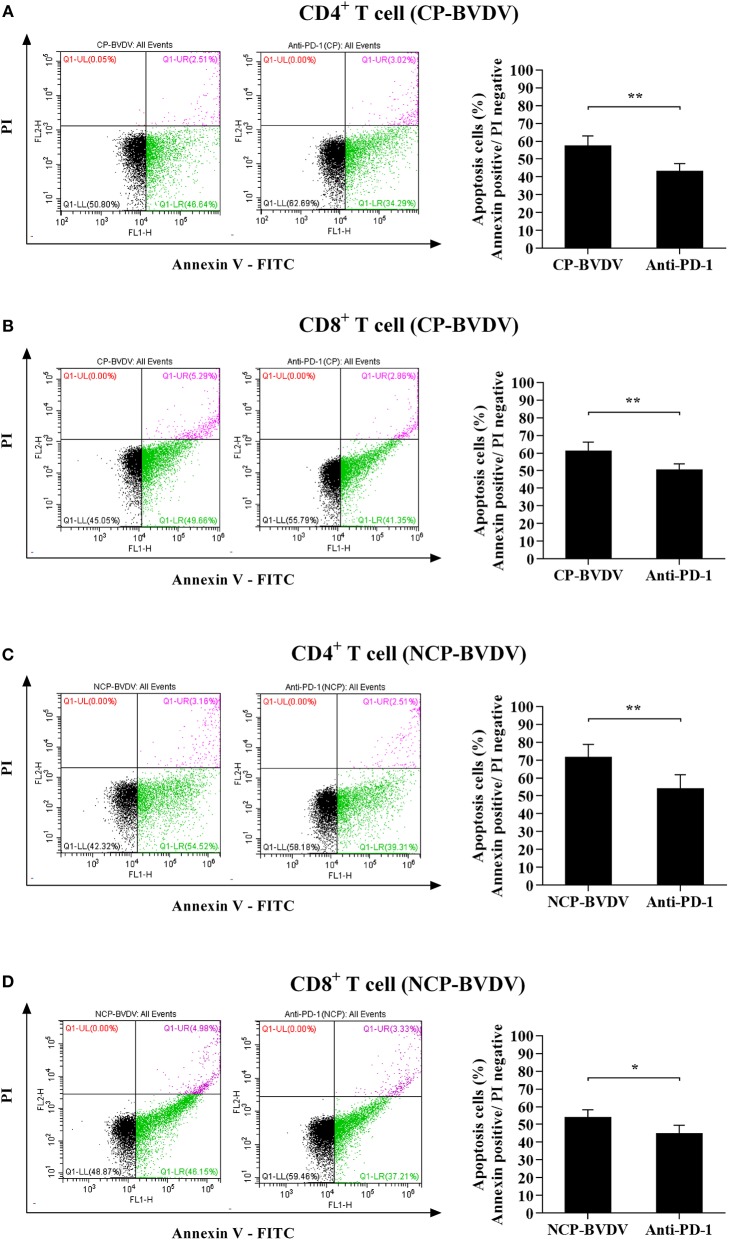
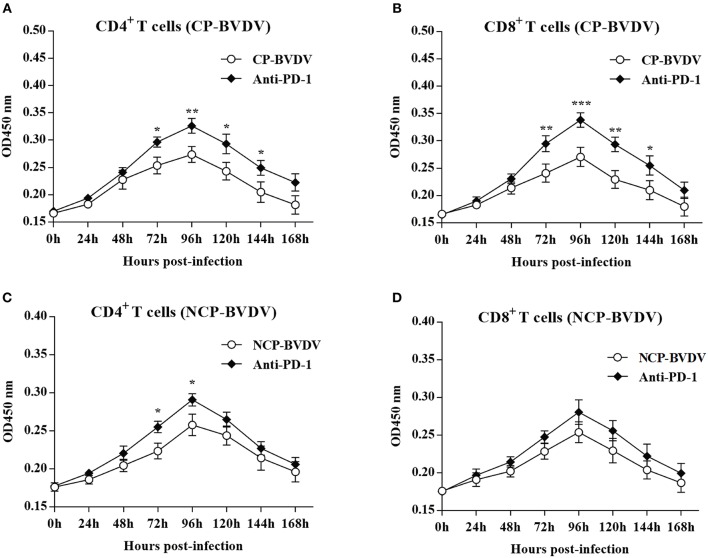
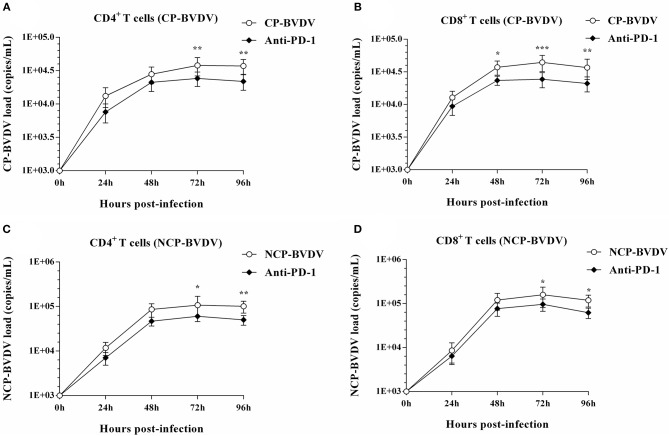
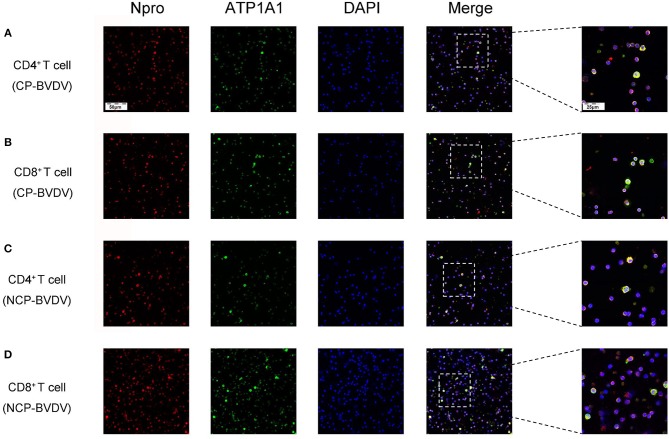
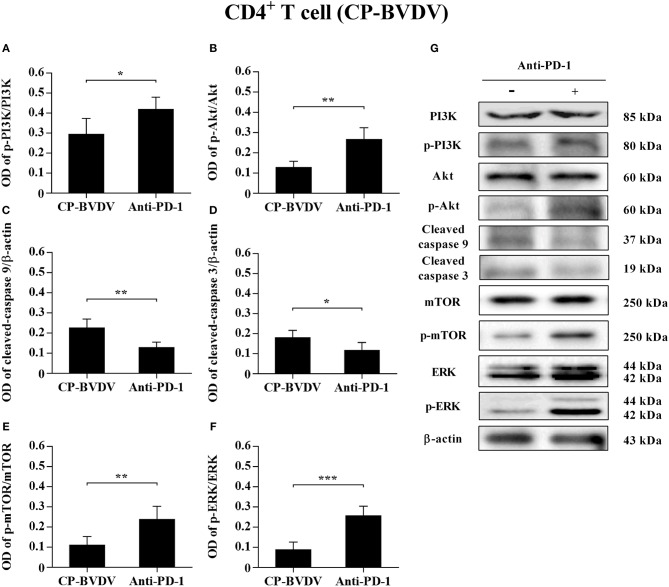
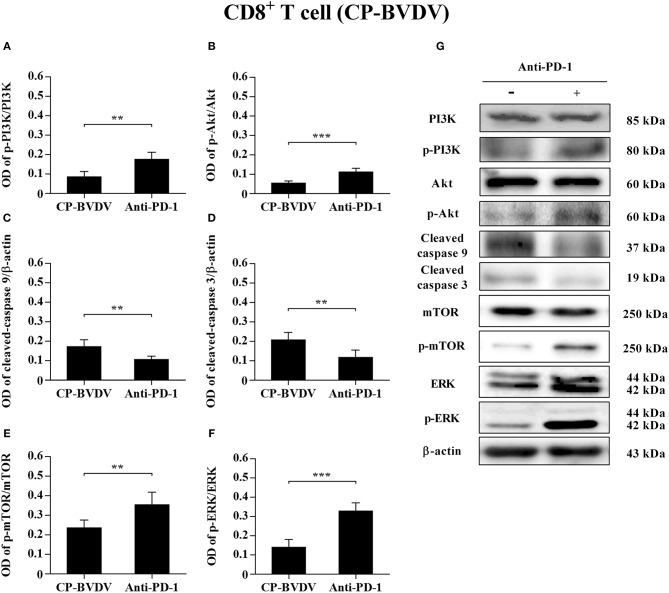
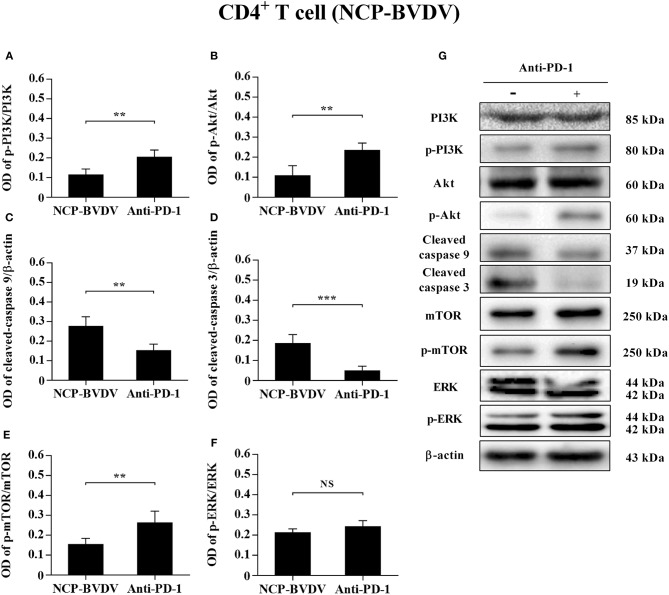
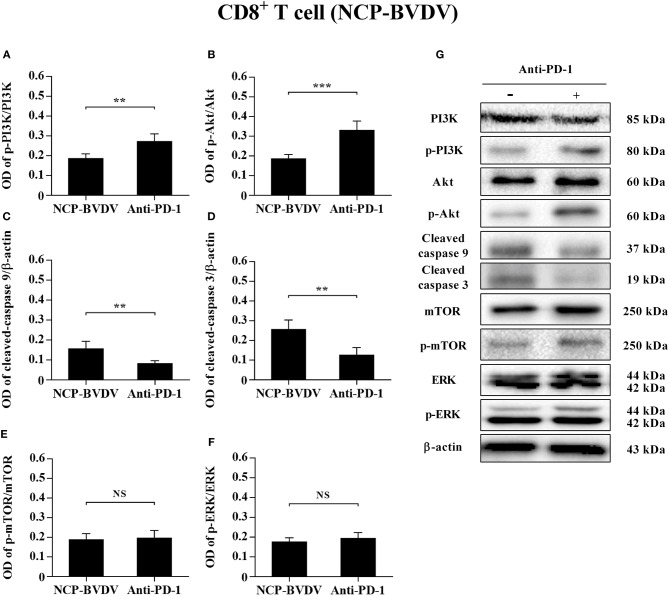
Acute infection of bovine viral diarrhea virus (BVDV) is associated with immune dysfunction and can cause peripheral blood lymphopenia and lymphocyte apoptosis. Our previous study has confirmed that programmed death-1 (PD-1) blockade inhibits peripheral blood lymphocyte (PBL) apoptosis and restores proliferation and anti-viral immune functions of lymphocytes after BVDV infection in vitro. However, the immunomodulatory effects of PD-1 pathway on major PBL subsets are unclear and their underlying molecular mechanisms need to be further studied. Therefore, in this study, we examined PD-1 expression in bovine PBL subsets after BVDV infection in vitro and analyzed the effects of PD-1 blockade on the apoptosis and proliferation of CD4+ and CD8+ T cells and expression of PD-1 downstream signaling molecules. The results showed that PD-1 expression was enhanced on CD4+ and CD8+ T cells, but not on CD21+ B cells after cytopathic (CP) BVDV (strain NADL) and non-cytopathic (NCP) BVDV (strain KD) infection in vitro and PD-1 blockade significantly reduced the apoptosis of CD4+ and CD8+ T cells after these two strains infection. Remarkably, PD-1 blockade significantly increased the proliferation of CD4+ and CD8+ T cells after CP BVDV infection, but only significantly increased the proliferation of CD4+ T cells after NCP BVDV infection. In addition, we confirmed that PD-1-mediated PI3K/Akt/mTOR, caspase 9/caspase 3 and ERK pathways are involved in regulating the apoptosis and proliferation of CD4+ and CD8+ T cells during BVDV infection in vitro. Notably, ERK is involved in the regulation mechanism PD-1 mediated only when the cells are infected with CP BVDV. Our findings provide a scientific basis for exploring the molecular mechanism of immune dysfunction caused by acute BVDV infection.

Keywords: PI3K/Akt/mTOR pathway; bovine viral diarrhea virus (BVDV); immune dysfunction; lymphocyte; programmed death-1 (PD-1).


Figures

Figure 1
Figure 1
Western blot analysis of PD-1 protein expression after CP BVDV infection. Shown are the representative western blot results and densitometric analyses of five independent experiments showing the expression of PD-1 protein on CD4+ T cells (A), CD8+ T cells (B), and CD21+ B cells (C). The uninfected CD4+ T cells, CD8+ T cells, and CD21+ B cells were used as the controls. N.S., not significant, ***p < 0.001, **p < 0.01. Data are presented as mean ± SD (n = 5 per group).
Figure 2
Figure 2
Western blot analysis of PD-1 protein expression after NCP BVDV infection. Shown are the representative western blot results and densitometric analyses of five independent experiments showing the expression of the PD-1 protein on CD4+ T cells (A), CD8+ T cells (B), and CD21+ B cells (C). The uninfected CD4+ T cells, CD8+ T cells, and CD21+ B cells were used as the controls. N.S., not significant, ***p < 0.001, *p < 0.05. Data are presented as mean ± SD (n = 5 per group).
Figure 3
Figure 3
Effect of the PD-1 blockade on the apoptosis of BVDV-infected CD4+ and CD8+ T cells. Shown are the results of flow cytometry analyses of apoptosis of CP BVDV-infected CD4+ T cells (A) and CD8+ T cells (B), as well as NCP BVDV-infected CD4+ T cells (C), and CD8+ T cells (D). The infected CD4+ and CD8+ T cells without antibody were used as the controls. **p < 0.01, *p < 0.05. Data are presented as mean ± SD (n = 5 per group).
Figure 4
Figure 4
Effect of PD-1 blockade on the proliferation of BVDV-infected CD4+ and CD8+ T cells. Shown are the results of proliferation assay of CP BVDV-infected CD4+ T cells (A) and CD8+ T cells (B) as well as NCP BVDV-infected CD4+ T cells (C) and CD8+ T cells (D). The infected CD4+ and CD8+ T cells without antibody were used as the controls. ***p < 0.001, **p < 0.01, *p < 0.05. Data are presented as mean ± SD (n = 5 per group).
Figure 5
Figure 5
Effect of PD-1 blockade on viral replication in CD4+ and CD8+ T cells. The time course of virus replication in CP BVDV-infected CD4+ T cells (A). The time course of virus replication in CP BVDV-infected CD8+ T cells (B). The time course of virus replication in NCP BVDV-infected CD4+ T cells (C). The time course of virus replication in NCP BVDV-infected CD8+ T cells (D). The BVDV-infected cells without antibody were used as control groups. *p < 0.05, **p < 0.01, ***p < 0.001 vs. control group. Data are presented as mean ± SD (n = 5 per group).
Figure 6
Figure 6
CLSM analysis of virus-infected CD4+ and CD8+ T cells at 96 hpi. CP BVDV-infected CD4+ T cells (A). CP BVDV-infected CD8+ T cells (B). NCP BVDV-infected CD4+ T cells (C). NCP BVDV-infected CD8+ T cells (D). The red color denotes BVDV Npro, the green color denotes ATP1A1 and the blue color denotes DAPI.
Figure 7
Figure 7
Effect of PD-1 blockade on the PD-1 downstream signaling molecules in CP BVDV-infected CD4+ T cells. Shown are the results of densitometric analyses of the levels of p-PI3K (A), p-Akt (B), cleaved-caspase 9 (C), cleaved-caspase 3 (D), p-mTOR (E), p-ERK (F) in bar graph format as well as the representative results (G) of Western blot analysis of PI3K, p-PI3K, Akt, p-Akt, cleaved-caspase 9, cleaved-caspase 3, mTOR, p-mTOR, ERK, p-ERK, and β-actin. The infected CD4+ and CD8+ T cells without antibody were used as control groups. ***p < 0.001, **p < 0.01, *p < 0.05. Data are presented as mean ± SD (n = 5 per group).
Figure 8
Figure 8
Effect of PD-1 blockade on downstream signaling molecules in CP BVDV-infected CD8+ T cells. Shown are the results of densitometric analyses of the levels of p-PI3K (A), p-Akt (B), cleaved-caspase 9 (C), cleaved-caspase 3 (D), p-mTOR (E), p-ERK (F) in bar graph format as well as the representative results (G) of Western blot analysis of PI3K, p-PI3K, Akt, p-Akt, cleaved-caspase 9, cleaved-caspase 3, mTOR, p-mTOR, ERK, p-ERK, and β-actin. The infected CD4+ and CD8+ T cells without antibody were used as control groups. ***p < 0.001, **p < 0.01. Data are presented as mean ± SD (n = 5 per group).
Figure 9
Figure 9
Effect of PD-1 blockade on downstream signaling molecules in NCP BVDV-infected CD4+ T cells. Shown are the results of densitometric analyses of the levels of p-PI3K (A), p-Akt (B), cleaved-caspase 9 (C), cleaved-caspase 3 (D), p-mTOR (E), p-ERK (F) in bar graph format as well as the representative results (G) of Western blot analysis of PI3K, p-PI3K, Akt, p-Akt, cleaved-caspase 9, cleaved-caspase 3, mTOR, p-mTOR, ERK, p-ERK, and β-actin. The infected CD4+ and CD8+ T cells without antibody were used as control groups. N.S., not significant, ***p < 0.001, **p < 0.01. Data are presented as mean ± SD (n = 5 per group).
Figure 10
Figure 10
Effect of PD-1 blockade on the PD-1 downstream signaling molecules in NCP BVDV-infected CD8+ T cells. Shown are the results of densitometric analyses of the levels of p-PI3K (A), p-Akt (B), cleaved-caspase 9 (C), cleaved-caspase 3 (D), p-mTOR (E), p-ERK (F) in bar graph format as well as the representative results (G) of Western blot analysis of PI3K, p-PI3K, Akt, p-Akt, cleaved-caspase 9, cleaved-caspase 3, mTOR, p-mTOR, ERK, p-ERK, and β-actin. The infected CD4+ and CD8+ T cells without antibody were used as control groups. N.S., not significant, ***p < 0.001, **p < 0.01. Data are presented as mean ± SD (n = 5 per group).

Similar articles

Cited by

References

    1. Kuca T, Passler T, Newcomer BW, Neill JD, Galik PK, Riddell KP, et al. . Identification of conserved amino acid substitutions during serial infection of pregnant cattle and sheep with bovine viral diarrhea virus. Front Microbiol. (2018) 9:1109. 10.3389/fmicb.2018.01109 - DOI - PMC - PubMed
    1. Salgado R, Hidalgo-Hermoso E, Pizarro-Lucero J. Detection of persistent pestivirus infection in pudú (Pudu puda) in a captive population of artiodactyls in Chile. BMC Vet Res. (2018) 14:37. 10.1186/s12917-018-1363-x - DOI - PMC - PubMed
    1. Chase CC, Thakur N, Darweesh MF, Morarie-Kane SE, Rajput MK. Immune response to bovine viral diarrhea virus—looking at newly defined targets. Anim Health Res Rev. (2015) 16:4–14. 10.1017/S1466252315000110 - DOI - PubMed
    1. Liebler-Tenorio EM, Ridpath JF, Neill JD. Distribution of viral antigen and development of lesions after experimental infection with highly virulent bovine viral diarrhea virus type 2 in calves. Am J Vet Res. (2002) 63:1575–84. 10.2460/ajvr.2002.63.1575 - DOI - PubMed
    1. Liebler-Tenorio EM, Ridpath JF, Neill JD. Distribution of viral antigen and development of lesions after experimental infection of calves with a BVDV 2 strain of low virulence. J Vet Diagn Invest. (2003) 15:221–32. 10.1177/104063870301500303 - DOI - PubMed

Publication types

MeSH terms