

Expression Profile Analysis of the Cell Cycle in Diploid and Tetraploid Carassius auratus red var
- PMID: 32256518
- PMCID: PMC7089929
- DOI: 10.3389/fgene.2020.00203
Expression Profile Analysis of the Cell Cycle in Diploid and Tetraploid Carassius auratus red var
Abstract
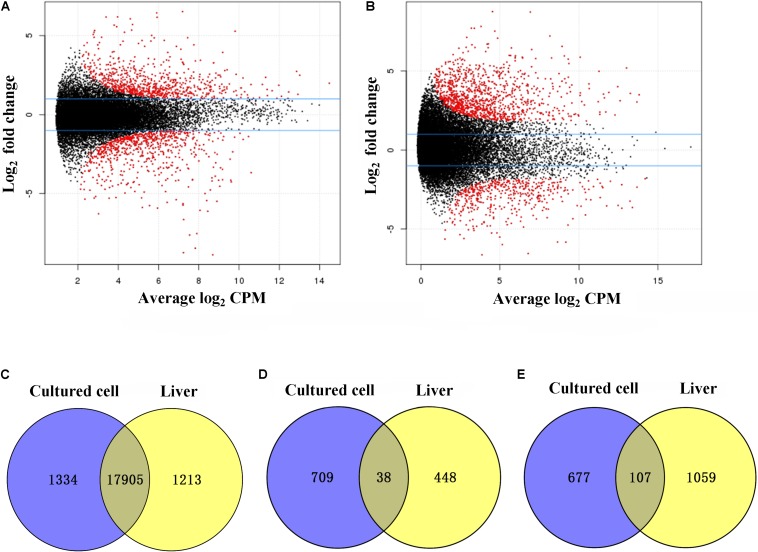
Polyploidization often leads to "transcriptome shock," and is considered an important factor in evolution of species. Analysis of the cell cycle, which is associated with survival in polyploidy, has proved useful in investigating polyploidization. Here, we used mRNA sequencing to investigate global expression in vitro (in cultured cells) and in vivo (in fin and liver tissues) in both the diploid and tetraploid Carassius auratus red var.. Differential expression (DE) of genes in diploid (7482, 36.0%) and tetraploid (3787, 18.2%) states suggested that in vitro and in vivo conditions dramatically change mRNA expression levels. However, of the 20,771 total shared expressed genes, 18,050 (87.0%), including 17,905 (86.2%) non-differentially expressed genes (DEGs) and 145 (0.7%) DEGs between diploids and tetraploids, showed the same expression trends in both cultured cells and liver tissues. Of the DEGs, four of seven genes in the cell cycle pathway had the same expression trends (upregulated in diploids and tetraploids) in both cultured cells and liver tissues. Quantitative PCR analysis confirmed the same expression trends in the nine DEGs associated with regulation of the cell cycle. This research on common characteristics between diploids and tetraploids provides insights into the potential molecular regulatory mechanisms of polyploidization. The steady changes that occur between diploids and tetraploids in vitro and in vivo show the potential value of studying polyploidy processes using cultured cell lines, especially with respect to cell cycle regulation.
Keywords: cell cycle; in vitro; in vivo; mRNA expression; polyploidy.
Copyright © 2020 Ren, Lu, Fan, Hu, Li, Xiao and Liu.
Figures


Similar articles
-
Homoeologue expression insights into the basis of growth heterosis at the intersection of ploidy and hybridity in Cyprinidae.Sci Rep. 2016 Jun 6;6:27040. doi: 10.1038/srep27040. Sci Rep. 2016. PMID: 27265401 Free PMC article.
-
Comparative Transcriptome Analysis Revealed Genes Involved in Sexual and Polyploid Growth Dimorphisms in Loach (Misgurnus anguillicaudatus).Biology (Basel). 2021 Sep 18;10(9):935. doi: 10.3390/biology10090935. Biology (Basel). 2021. PMID: 34571812 Free PMC article.
-
In vitro induction of tetraploids and their phenotypic and transcriptome analysis in Glehnia littoralis.BMC Plant Biol. 2024 May 22;24(1):439. doi: 10.1186/s12870-024-05154-w. BMC Plant Biol. 2024. PMID: 38778255 Free PMC article.
-
The formation of improved tetraploid population of red crucian carp x common carp hybrids by androgenesis.Sci China C Life Sci. 2007 Dec;50(6):753-61. doi: 10.1007/s11427-007-0090-5. Epub 2007 Sep 28. Sci China C Life Sci. 2007. PMID: 17901933
-
The Slow Growth of Adventitious Roots in Tetraploid Hybrid Poplar (Populus simonii × P. nigra var. italica) May Be Caused by Endogenous Hormone-Mediated Meristem Shortening.Plants (Basel). 2024 May 22;13(11):1430. doi: 10.3390/plants13111430. Plants (Basel). 2024. PMID: 38891239 Free PMC article.
Cited by
-
A New Method for Chromosomes Preparation by ATP-Competitive Inhibitor SP600125 via Enhancement of Endomitosis in Fish.Front Bioeng Biotechnol. 2021 Jan 13;8:606496. doi: 10.3389/fbioe.2020.606496. eCollection 2020. Front Bioeng Biotechnol. 2021. PMID: 33520960 Free PMC article.
-
Characteristics of SP600125 Induced Tetraploid Cells in Comparison With Diploid and Tetraploid Cells of Fish.Front Genet. 2021 Dec 6;12:781007. doi: 10.3389/fgene.2021.781007. eCollection 2021. Front Genet. 2021. PMID: 34938322 Free PMC article.
References
-
- Ashcroft M., Vousden K. H. (2001). Tumor Suppressor Protein. Totowa, NJ: Humana Press; p53
LinkOut - more resources
Full Text Sources