

CCNB2, NUSAP1 and TK1 are associated with the prognosis and progression of hepatocellular carcinoma, as revealed by co-expression analysis
- PMID: 32256749
- PMCID: PMC7086186
- DOI: 10.3892/etm.2020.8522
CCNB2, NUSAP1 and TK1 are associated with the prognosis and progression of hepatocellular carcinoma, as revealed by co-expression analysis
Abstract
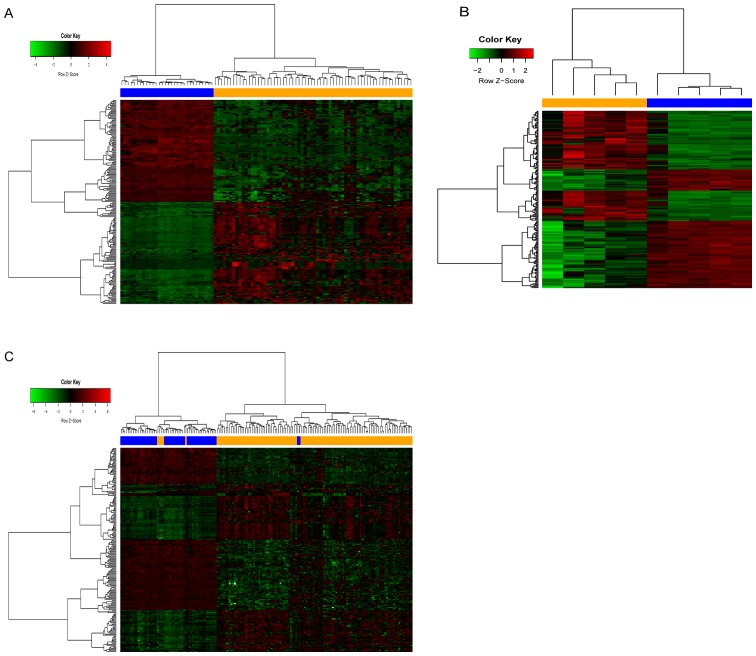
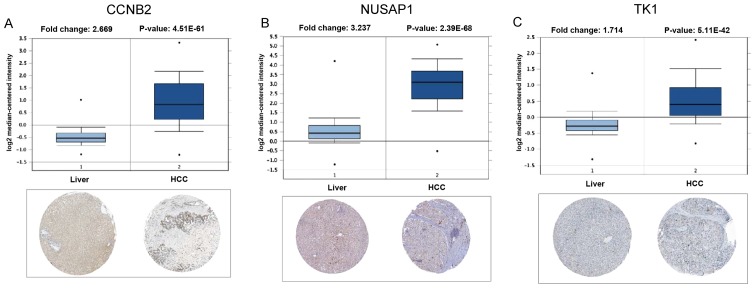
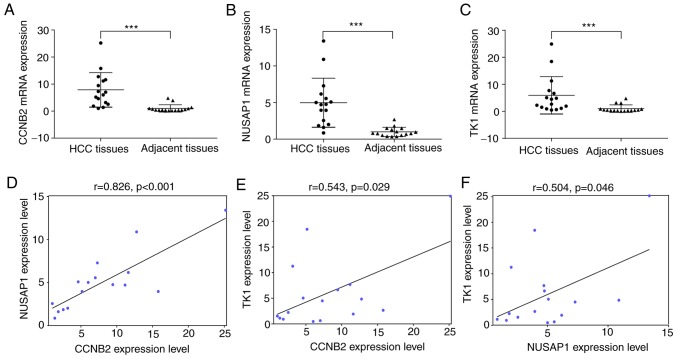
The mortality rate associated with hepatocellular carcinoma (HCC) is the third highest among all digestive system tumors. However, the causes of HCC development and the underlying mechanisms have remained to be fully elucidated. In the present bioinformatics study, genetic markers were identified and their association with HCC was determined. The mRNA expression datasets GSE87630, GSE74656 and GSE76427 were downloaded from the Gene Expression Omnibus (GEO) database. A total of 96 differentially expressed genes (DEGs) were screened from the 3 GEO datasets, including 25 upregulated and 71 downregulated genes. DEGs were uploaded to the database for Annotation, Visualization and Integrated Discovery to screen for enriched Gene Ontology terms in various categories and the Search Tool for the Retrieval of Interacting Genes/Proteins was used to identify the interactions and functions of the DEGs. A total of 3 genetic markers were identified in a stepwise pathway and functional analysis in a previous study. The association of the genetic markers with prognosis was analysed using the UALCAN online analysis tool. Regression analysis was also performed to identify the relationship between HCC grade and disease recurrence and the expression of genetic markers using The Cancer Genome Atlas HCC dataset. In addition, the expression of the 3 genetic markers in HCC tissues was determined using reverse transcription-quantitative PCR, the Oncomine database and the Human Protein Atlas database. The expression levels of the 3 genetic markers cyclin B2 (CCNB2), nucleolar and spindle-associated protein 1 (NUSAP1) and thymidine kinase 1 (TK1) were significantly correlated with each other and high mRNA expression of CCNB2 was significantly associated with poor overall survival of patients with HCC. Receiver operating characteristic curve analysis indicated that NUSAP1 and TK1 were capable of distinguishing between recurrent and non-recurrent HCC. Furthermore, CCNB2, NUSAP1 and TK1 were highly correlated with the HCC grade. It was also indicated that the mRNA expression of CCNB2, NUSAPA and TK1 was increased in primary HCC tissues when compared with that in adjacent tissues. The present study identified that the CCNB2, NUSAP1 and TK1 genes may serve as prognostic markers for HCC, and may be of value from the perspectives of basic research and clinical treatment of HCC.
Keywords: biological marker; gene expression profiling; hepatocellular carcinoma; hub genes; prognosis.
Copyright: © Liu et al.
Figures


Similar articles
-
Identification of Hub Genes Associated With Immune Infiltration and Predict Prognosis in Hepatocellular Carcinoma via Bioinformatics Approaches.Front Genet. 2021 Jan 11;11:575762. doi: 10.3389/fgene.2020.575762. eCollection 2020. Front Genet. 2021. PMID: 33505422 Free PMC article.
-
[Screening core genes and cyclin B2 as a potential diagnosis, treatment and prognostic biomarker of hepatocellular carcinoma based on bioinformatics analysis].Zhonghua Gan Zang Bing Za Zhi. 2020 Sep 20;28(9):773-783. doi: 10.3760/cma.j.cn501113-20200818-00461. Zhonghua Gan Zang Bing Za Zhi. 2020. PMID: 33053978 Chinese.
-
Identification of Key Genes and Prognostic Value Analysis in Hepatocellular Carcinoma by Integrated Bioinformatics Analysis.Int J Genomics. 2019 Nov 22;2019:3518378. doi: 10.1155/2019/3518378. eCollection 2019. Int J Genomics. 2019. PMID: 31886163 Free PMC article.
-
Identification of hub genes involved in the occurrence and development of hepatocellular carcinoma via bioinformatics analysis.Oncol Lett. 2020 Aug;20(2):1695-1708. doi: 10.3892/ol.2020.11752. Epub 2020 Jun 17. Oncol Lett. 2020. PMID: 32724412 Free PMC article.
-
Thymidine kinase 1 through the ages: a comprehensive review.Cell Biosci. 2020 Nov 27;10(1):138. doi: 10.1186/s13578-020-00493-1. Cell Biosci. 2020. PMID: 33292474 Free PMC article. Review.
Cited by
-
Potential tumor-specific antigens and immune landscapes identification for mRNA vaccine in thyroid cancer.Front Oncol. 2024 Sep 30;14:1480028. doi: 10.3389/fonc.2024.1480028. eCollection 2024. Front Oncol. 2024. PMID: 39403328 Free PMC article.
-
Upregulation of CCNB2 and a novel lncRNAs-related risk model predict prognosis in clear cell renal cell carcinoma.J Cancer Res Clin Oncol. 2024 Feb 1;150(2):64. doi: 10.1007/s00432-024-05611-x. J Cancer Res Clin Oncol. 2024. PMID: 38300330 Free PMC article.
-
The role and therapeutic value of NUSAP1 in human cancers.J Transl Med. 2025 Jul 2;23(1):725. doi: 10.1186/s12967-025-06746-2. J Transl Med. 2025. PMID: 40605080 Free PMC article. Review.
-
Construction and validation of NSMC-ASIL, a predictive model for risk assessment of malignant hepatic nodules.Am J Cancer Res. 2022 Nov 15;12(11):5315-5324. eCollection 2022. Am J Cancer Res. 2022. PMID: 36504900 Free PMC article.
-
Identification of the hub gene BUB1B in hepatocellular carcinoma via bioinformatic analysis and in vitro experiments.PeerJ. 2021 Feb 23;9:e10943. doi: 10.7717/peerj.10943. eCollection 2021. PeerJ. 2021. PMID: 33665036 Free PMC article.
References
LinkOut - more resources
Full Text Sources
Research Materials