. 2020 Apr;19(4):3258-3268.
doi: 10.3892/ol.2020.11443. Epub 2020 Mar 3.

Cell proliferation is induced in renal cell carcinoma through miR-92a-3p upregulation by targeting FBXW7

Affiliations

Cell proliferation is induced in renal cell carcinoma through miR-92a-3p upregulation by targeting FBXW7

Rong Zeng et al. Oncol Lett. 2020 Apr.

Abstract

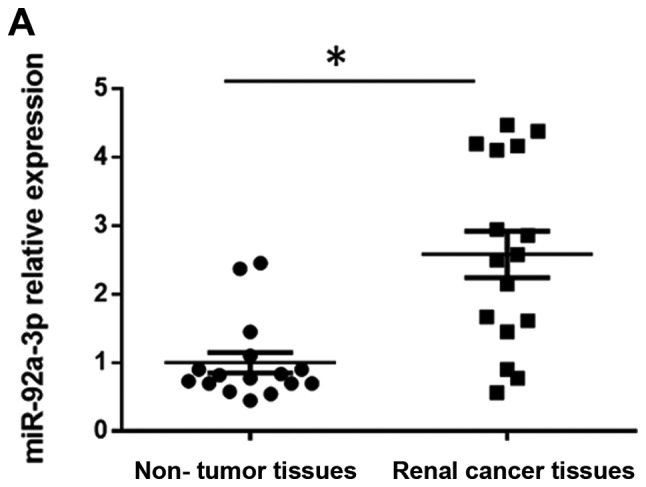
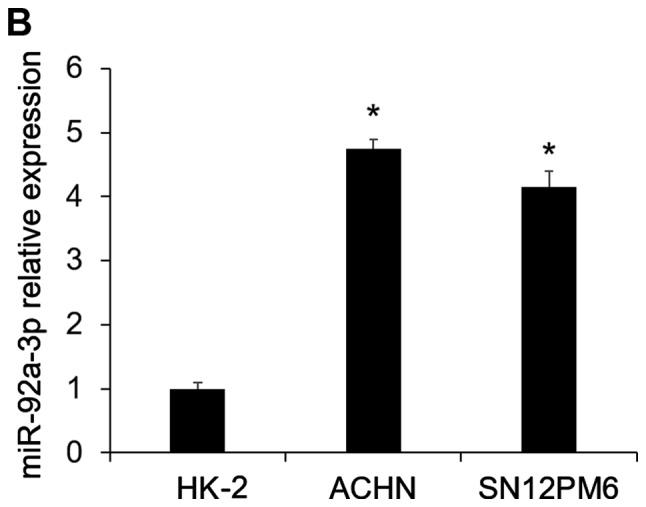
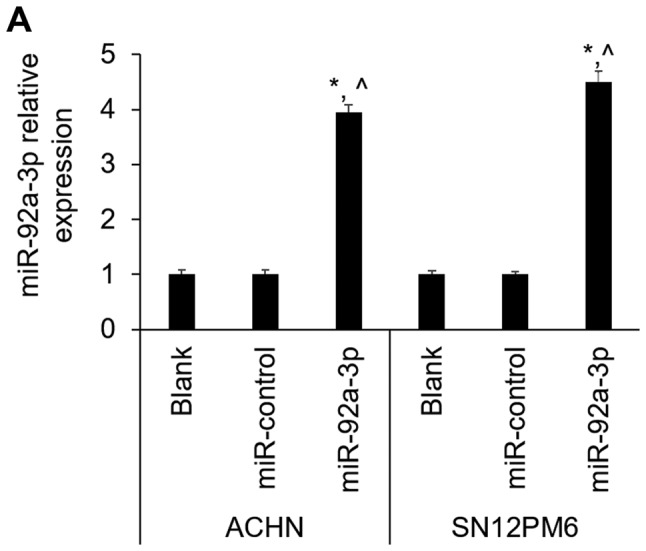
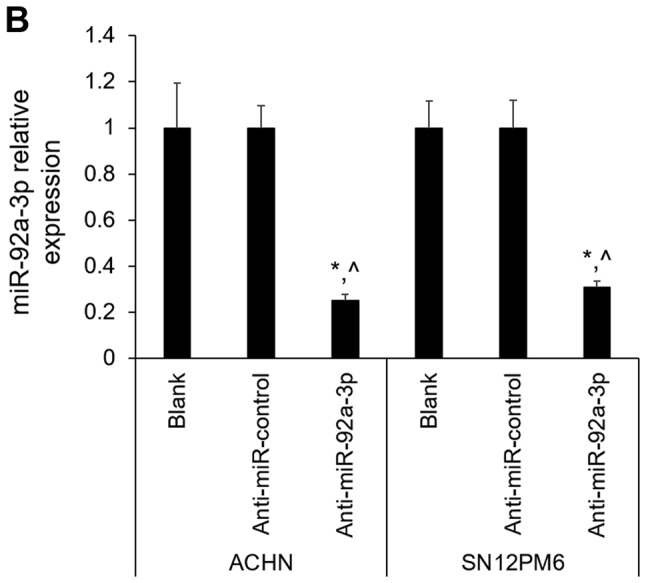
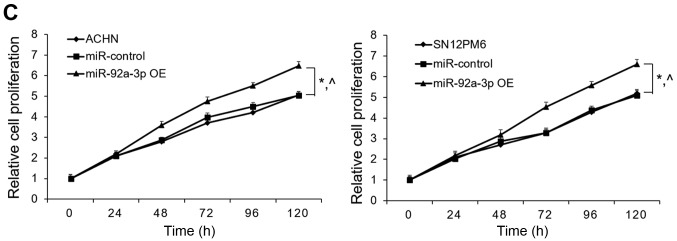
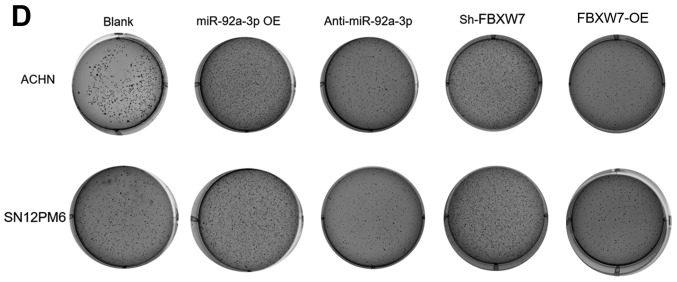
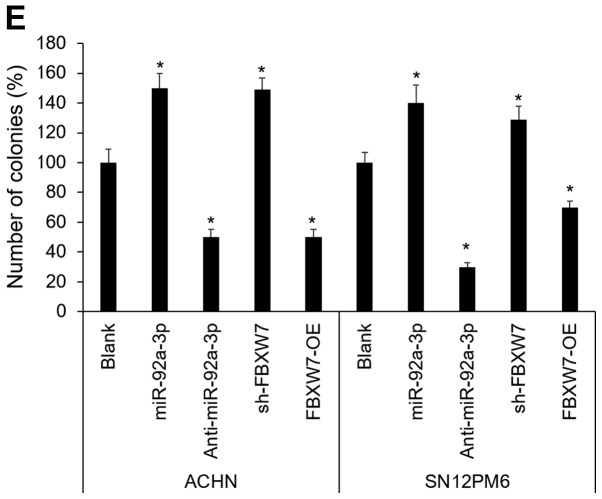
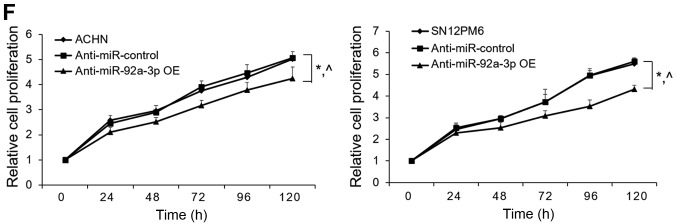
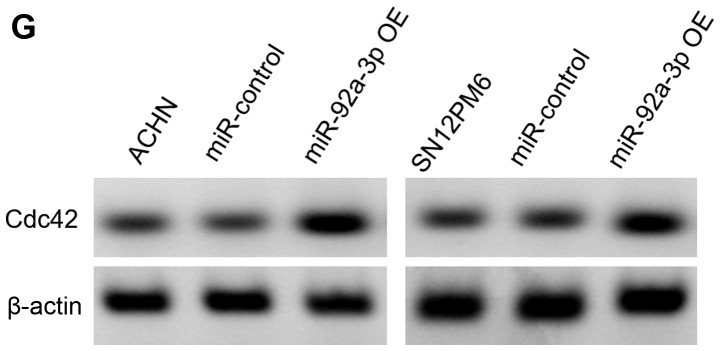
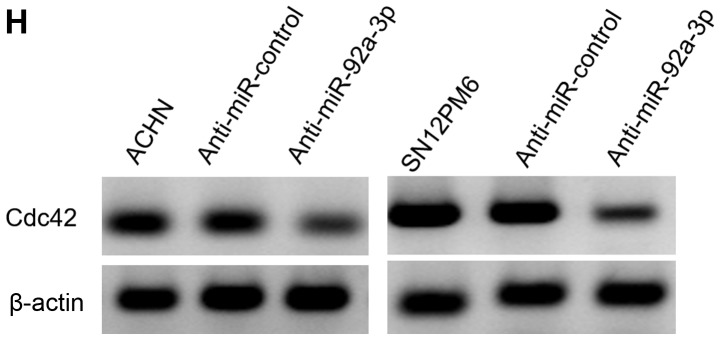
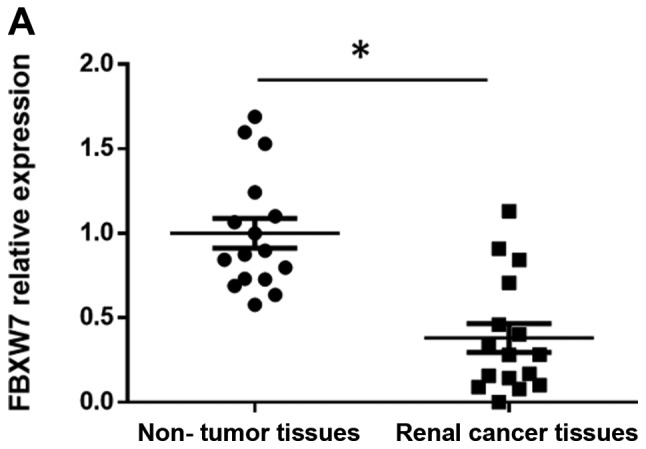
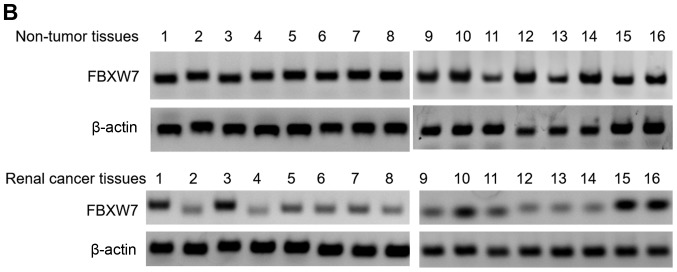
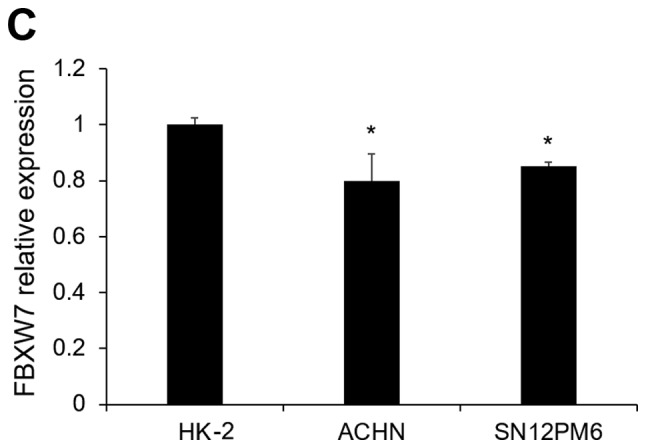
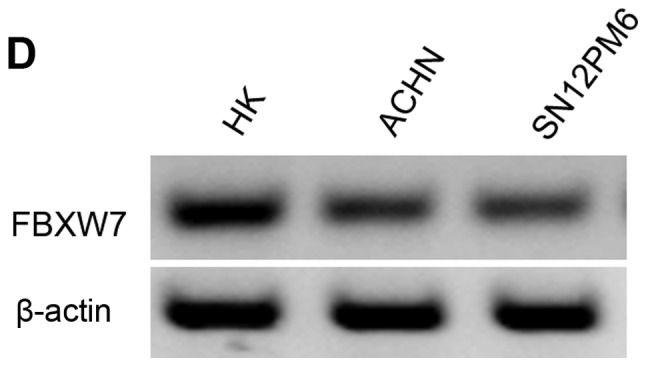
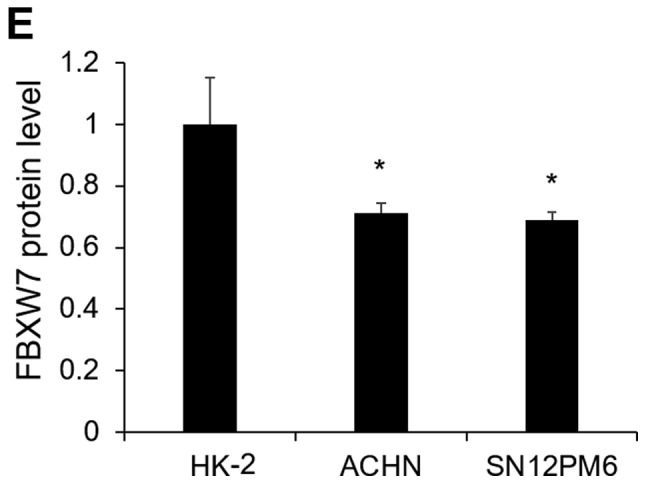
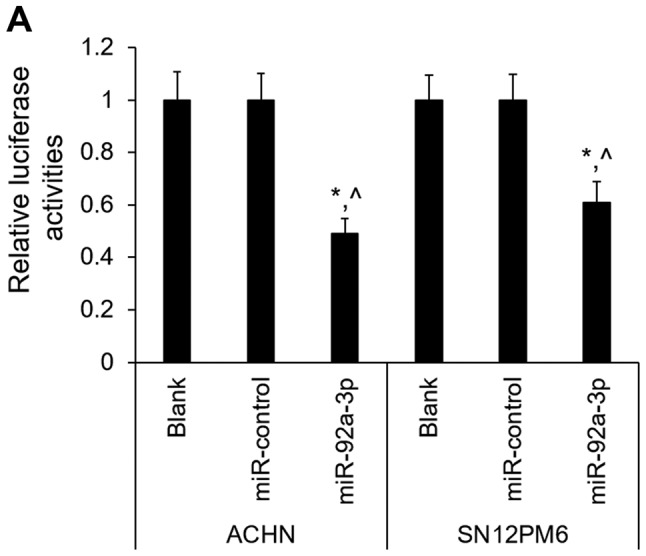
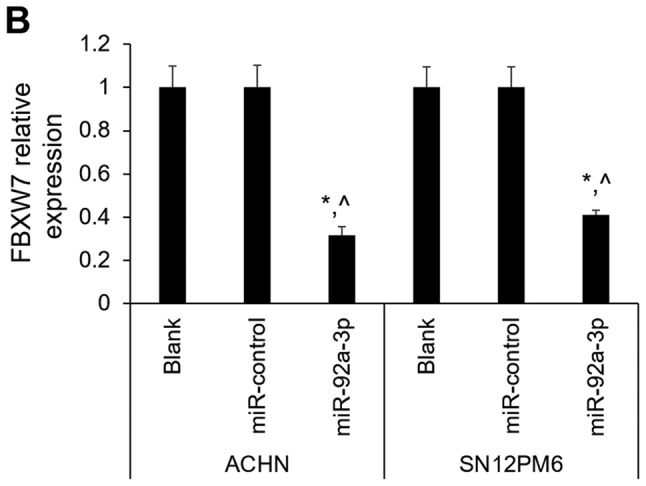
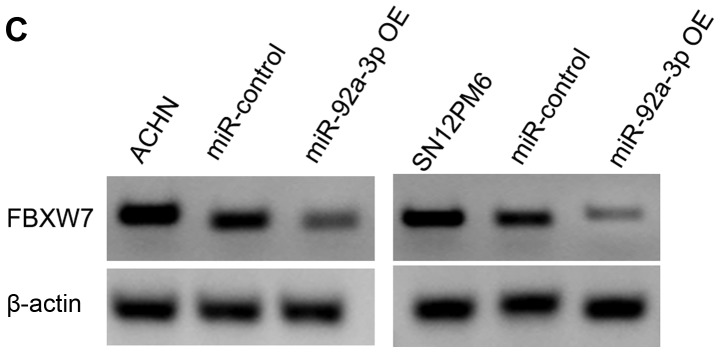
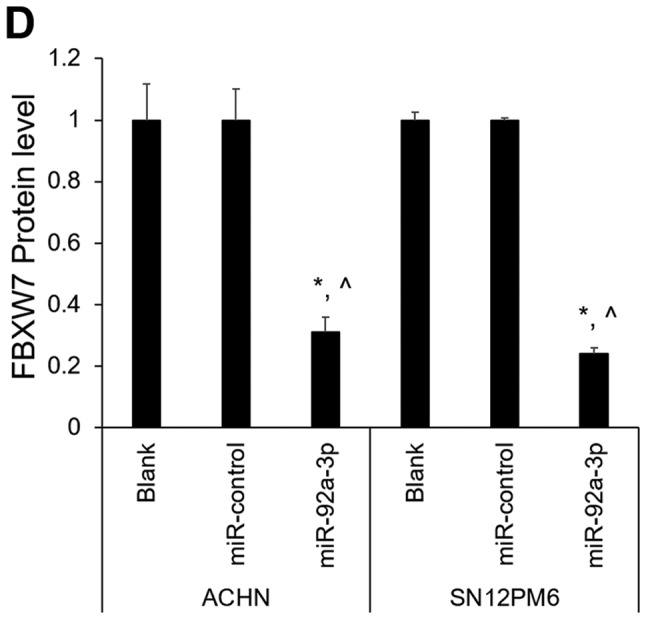
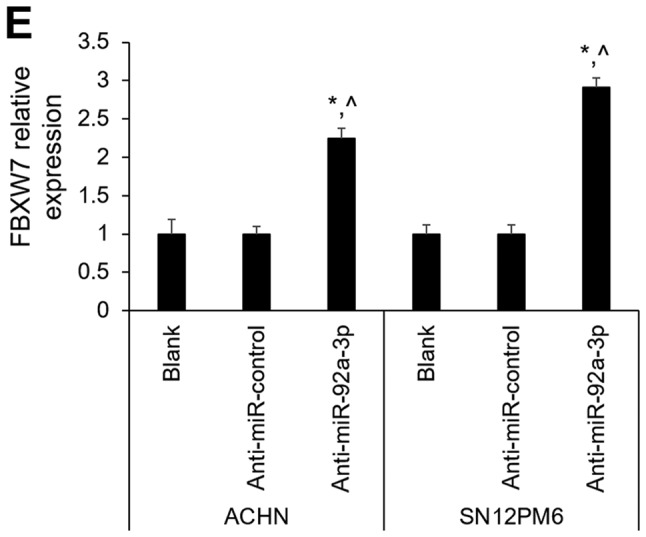
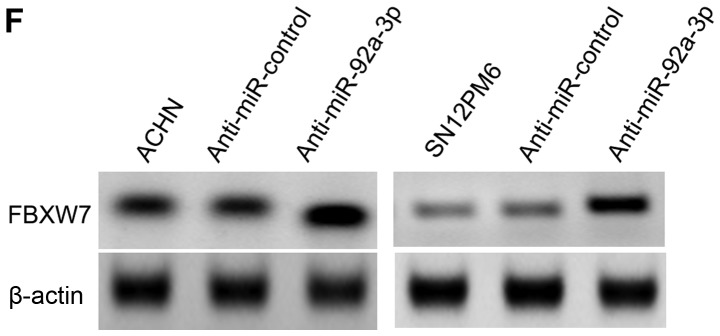
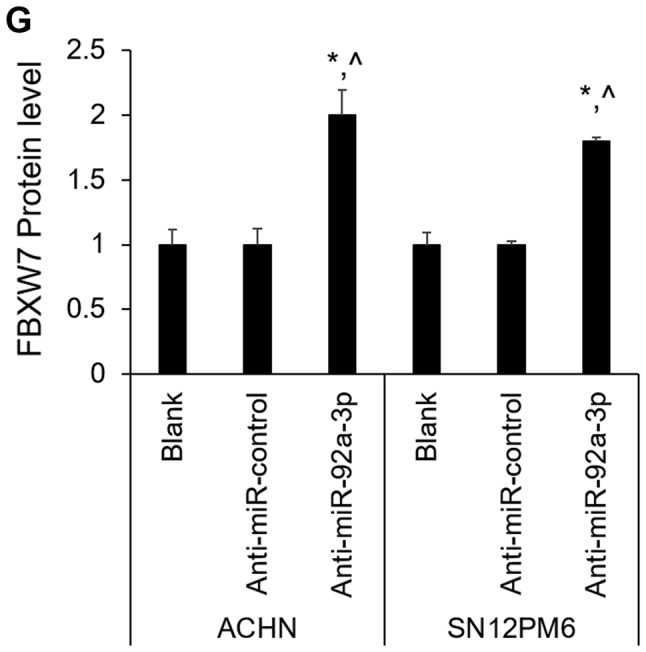
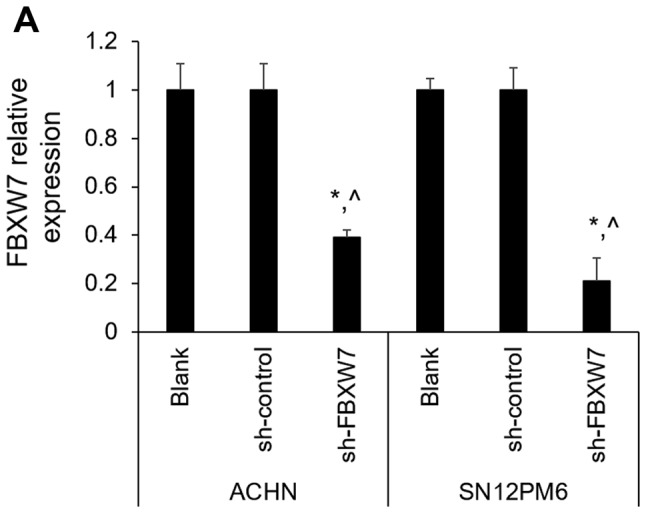
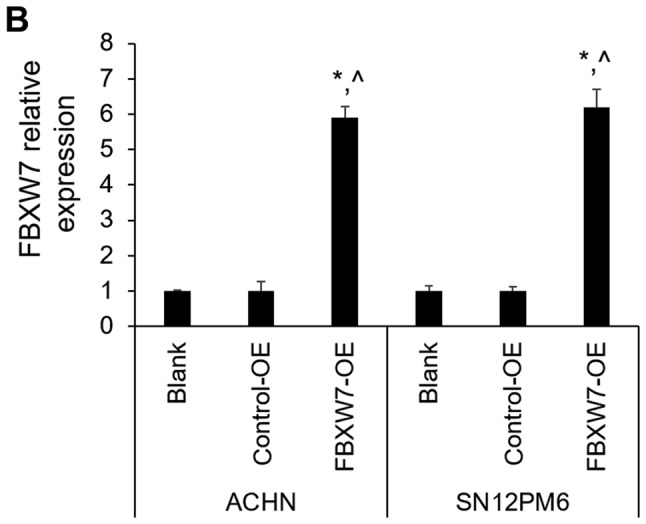
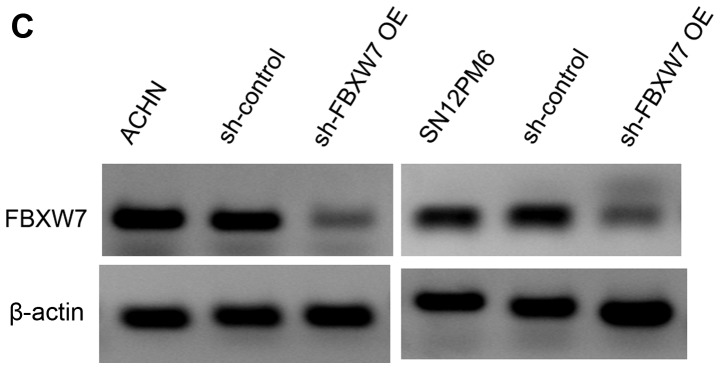
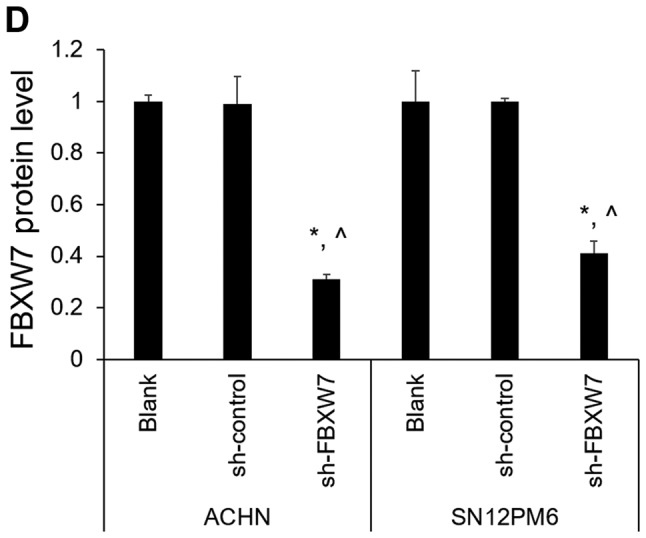
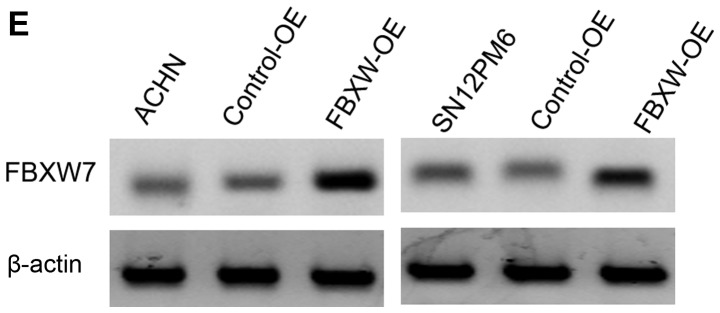
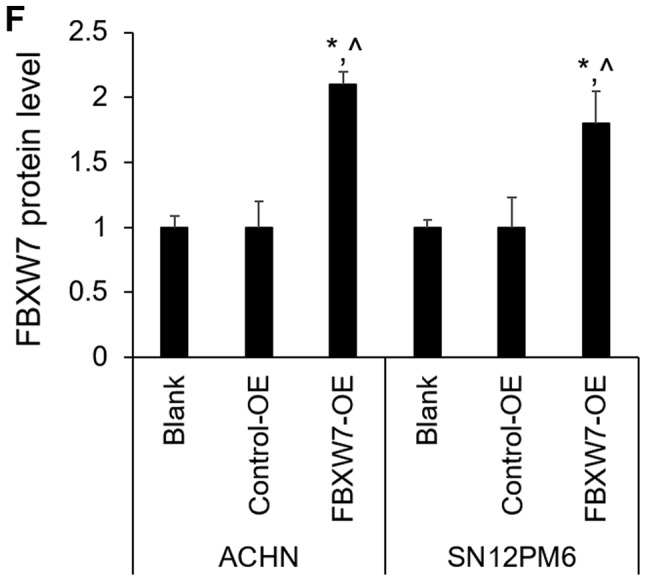
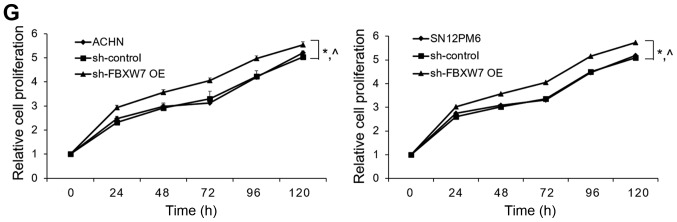
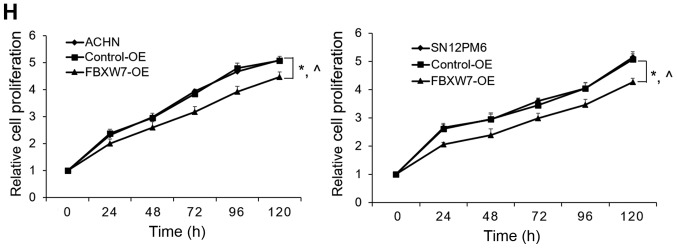
Renal cell carcinoma (RCC) is the most common type of kidney cancer whose incidence has gradually increased worldwide. MicroRNAs (miRNAs) represent a type of short endogenous non-coding RNA containing approximately 22 nucleotides, which are capable of regulating mRNAs at the post-transcriptional level in human cells. miRNAs have been demonstrated to mediate gene expression by influencing important regulatory genes. Accumulating evidence indicates that certain miRNAs are involved in RCC development. The present study investigated the underlying mechanism and functional role of miR-92a-3p in RCC cells using reverse transcription-quantitative polymerase chain reaction, western blotting, 3' UTR luciferase assay, cell proliferation assay and soft agar assay. The results demonstrated that miR-92a-3p expression level is significantly upregulated in RCC tissues and cell lines; however, F-box and WD repeat domain containing 7 (FBXW7) expression level was significantly downregulated in RCC tissues and cell lines. Subsequently, whether FBXW7 could be considered as a direct target of miR-92a-3p in RCC cells was investigated. The results demonstrated that miR-92a-3p overexpression significantly promoted RCC cell proliferation and colony formation. Conversely, miR-92a-3p downregulation significantly inhibited RCC cell proliferation and colony formation. In addition, FBXW7 knockdown significantly enhanced RCC cell proliferation and colony formation. Conversely, FBXW7 overexpression significantly inhibited RCC cell proliferation and colony formation. Collectively, these results demonstrated that miR-92a-3p/FBXW7 pathway may represent a novel strategy and therapeutic target for RCC.

Keywords: F-box and WD repeat domain containing 7; anchorage-independent growth; cell proliferation; microRNA-92a-3p.


Figures

Figure 1.
Figure 1.
miR-92a-3p expression in RCC tissues and cell lines. (A) The mean level of miR-92a-3p expression in RCC tissues was significantly elevated compared with matched non-tumor tissues, as determined by RT-qPCR. *P<0.05 vs. non-tumor tissues (n=16). (B) RT-qPCR was used to compare the differences in miR-92a-3p expression level between the non-tumorigenic renal cell line HK-2 and RCC cell lines ACHN and SN12PM6. *P<0.05 vs. HK-2 (n=3). RCC, renal cell carcinoma; RT-qPCR, reverse transcription-quantitative polymerase chain reaction.
Figure 1.
Figure 1.
miR-92a-3p expression in RCC tissues and cell lines. (A) The mean level of miR-92a-3p expression in RCC tissues was significantly elevated compared with matched non-tumor tissues, as determined by RT-qPCR. *P<0.05 vs. non-tumor tissues (n=16). (B) RT-qPCR was used to compare the differences in miR-92a-3p expression level between the non-tumorigenic renal cell line HK-2 and RCC cell lines ACHN and SN12PM6. *P<0.05 vs. HK-2 (n=3). RCC, renal cell carcinoma; RT-qPCR, reverse transcription-quantitative polymerase chain reaction.
Figure 2.
Figure 2.
Biological effect of miR-92a-3p overexpression on ACHN and SN12PM6 cells. (A) RCC cell lines ACHN and SN12PM6 stably overexpressed miR-92a-3p following miR-92a-3p transfection. *P<0.05 vs. untransfected cells (blank); ^P<0.05 vs. miR-control (n=3). (B) miR-92a-3p was stably downregulated in RCC cell lines ACHN and SN12PM6 following anti-miR-92a-3p transfection. *P<0.05 vs. untransfected cells (blank); ^P<0.05 vs. anti-miR-control (n=3). (C) miR-92a-3p overexpression stimulated ACHN and SN12PM6 cell proliferation. *P<0.05 vs. untransfected cells; ^P<0.05 vs. miR-control (n=3). (D) Colony formation assay demonstrated that miR-92a-3p-overexpression and FBXW7-knockdown accelerated colony formation of ACHN and SN12PM6 cells. Conversely, miR-92a-3p knockdown and FBXW7 overexpression inhibited colony formation of ACHN and SN12PM6 cells. (E) Number of colony forming cells/well expressed as percentage of untransfected cells (blank) and presented as the mean ± standard error. *P<0.05 vs. blank. (F) miR-92a-3p knockdown inhibited ACHN and SN12PM6 cell proliferation. *P<0.05 vs. untransfected cells, ^P<0.05 vs. anti-miR-control (n=3). FBXW7, F-box and WD repeat domain containing 7; RCC, renal cell carcinoma. (G and H) Western blotting determination of Cdc42 protein expression level in ACHN and SN12PM6 cells following miR-92a-3p or anti-miR-92a-3p transfection. FBXW7, F-box and WD repeat domain containing 7; RCC, renal cell carcinoma.
Figure 2.
Figure 2.
Biological effect of miR-92a-3p overexpression on ACHN and SN12PM6 cells. (A) RCC cell lines ACHN and SN12PM6 stably overexpressed miR-92a-3p following miR-92a-3p transfection. *P<0.05 vs. untransfected cells (blank); ^P<0.05 vs. miR-control (n=3). (B) miR-92a-3p was stably downregulated in RCC cell lines ACHN and SN12PM6 following anti-miR-92a-3p transfection. *P<0.05 vs. untransfected cells (blank); ^P<0.05 vs. anti-miR-control (n=3). (C) miR-92a-3p overexpression stimulated ACHN and SN12PM6 cell proliferation. *P<0.05 vs. untransfected cells; ^P<0.05 vs. miR-control (n=3). (D) Colony formation assay demonstrated that miR-92a-3p-overexpression and FBXW7-knockdown accelerated colony formation of ACHN and SN12PM6 cells. Conversely, miR-92a-3p knockdown and FBXW7 overexpression inhibited colony formation of ACHN and SN12PM6 cells. (E) Number of colony forming cells/well expressed as percentage of untransfected cells (blank) and presented as the mean ± standard error. *P<0.05 vs. blank. (F) miR-92a-3p knockdown inhibited ACHN and SN12PM6 cell proliferation. *P<0.05 vs. untransfected cells, ^P<0.05 vs. anti-miR-control (n=3). FBXW7, F-box and WD repeat domain containing 7; RCC, renal cell carcinoma. (G and H) Western blotting determination of Cdc42 protein expression level in ACHN and SN12PM6 cells following miR-92a-3p or anti-miR-92a-3p transfection. FBXW7, F-box and WD repeat domain containing 7; RCC, renal cell carcinoma.
Figure 3.
Figure 3.
FBXW7 downregulation in RCC tissues and cell lines. (A) RT-qPCR demonstrated that FBXW7 expression level was significantly downregulated in RCC tissues compared with matched non-tumor tissues. *P<0.05 vs. non-tumor tissues (n=16). (B) FBXW7 protein expression was determined in RCC tissues and paired non-tumor tissues by western blotting. (C) RT-qPCR was used to compare differences in the expression of FBXW7 between the non-tumorigenic renal cell line HK-2 and RCC cell lines ACHN and SN12PM6. *P<0.05 vs. HK-2 (n=3). (D) FBXW7 protein expression was determined in HK-2, ACHN and SN12PM6 cell lines by western blotting. (E) Western blotting bands were quantified using ImageJ software. Relative FBXW7 expression levels were normalized to β-actin. *P<0.05 vs. HK-2 (n=3). FBXW7, F-box and WD repeat domain containing 7; RCC, renal cell carcinoma; RT-qPCR, reverse transcription-quantitative polymerase chain reaction.
Figure 3.
Figure 3.
FBXW7 downregulation in RCC tissues and cell lines. (A) RT-qPCR demonstrated that FBXW7 expression level was significantly downregulated in RCC tissues compared with matched non-tumor tissues. *P<0.05 vs. non-tumor tissues (n=16). (B) FBXW7 protein expression was determined in RCC tissues and paired non-tumor tissues by western blotting. (C) RT-qPCR was used to compare differences in the expression of FBXW7 between the non-tumorigenic renal cell line HK-2 and RCC cell lines ACHN and SN12PM6. *P<0.05 vs. HK-2 (n=3). (D) FBXW7 protein expression was determined in HK-2, ACHN and SN12PM6 cell lines by western blotting. (E) Western blotting bands were quantified using ImageJ software. Relative FBXW7 expression levels were normalized to β-actin. *P<0.05 vs. HK-2 (n=3). FBXW7, F-box and WD repeat domain containing 7; RCC, renal cell carcinoma; RT-qPCR, reverse transcription-quantitative polymerase chain reaction.
Figure 4.
Figure 4.
FBWX7 was directly suppressed by miR-92a-3p. (A) 3′-UTR luciferase reporter assay was used to confirm that miR-92a-3p bound to specific regions in the FBXW7 3′-UTR region. *P<0.05 vs. blank; ^P<0.05 vs. miR-control (n=3). (B) FBXW7 mRNA level was assessed following miR-92a-3p overexpression by RT-qPCR. *P<0.05 vs. blank; ^P<0.05 vs. miR-control (n=3). (C) Western blotting of FBXW7 in ACHN and SN12PM6 cells not transfected with lentivirus (blank) or transfected with lentivirus expressing miR-92a-3p or miR-control. (D) Western blotting bands were quantified using ImageJ software. Relative FBXW7 expression levels were normalized to β-actin. *P<0.05 vs. blank; ^P<0.05 vs. miR-control (n=3). (E) FBXW7 mRNA level was measured following anti-miR-92a-3p overexpression in ACHN and SN12PM6 cell lines by RT-qPCR. *P<0.05 vs. blank; ^P<0.05 vs. anti-miR-control (n=3). (F) FBXW7 protein expression was determined by western blotting in ACHN and SN12PM6 cell lines not transfected with lentivirus (blank) or transfected with a lentivirus expressing anti-miR-92a-3p or anti-miR-control. (G) Western blotting bands were quantified using ImageJ software. Relative FBXW7 expression levels were normalized to β-actin. *P<0.05 vs. blank, ^P<0.05 vs. anti-miR-control (n=3). FBXW7, F-box and WD repeat domain containing 7; RT-qPCR, reverse transcription-quantitative polymerase chain reaction.
Figure 4.
Figure 4.
FBWX7 was directly suppressed by miR-92a-3p. (A) 3′-UTR luciferase reporter assay was used to confirm that miR-92a-3p bound to specific regions in the FBXW7 3′-UTR region. *P<0.05 vs. blank; ^P<0.05 vs. miR-control (n=3). (B) FBXW7 mRNA level was assessed following miR-92a-3p overexpression by RT-qPCR. *P<0.05 vs. blank; ^P<0.05 vs. miR-control (n=3). (C) Western blotting of FBXW7 in ACHN and SN12PM6 cells not transfected with lentivirus (blank) or transfected with lentivirus expressing miR-92a-3p or miR-control. (D) Western blotting bands were quantified using ImageJ software. Relative FBXW7 expression levels were normalized to β-actin. *P<0.05 vs. blank; ^P<0.05 vs. miR-control (n=3). (E) FBXW7 mRNA level was measured following anti-miR-92a-3p overexpression in ACHN and SN12PM6 cell lines by RT-qPCR. *P<0.05 vs. blank; ^P<0.05 vs. anti-miR-control (n=3). (F) FBXW7 protein expression was determined by western blotting in ACHN and SN12PM6 cell lines not transfected with lentivirus (blank) or transfected with a lentivirus expressing anti-miR-92a-3p or anti-miR-control. (G) Western blotting bands were quantified using ImageJ software. Relative FBXW7 expression levels were normalized to β-actin. *P<0.05 vs. blank, ^P<0.05 vs. anti-miR-control (n=3). FBXW7, F-box and WD repeat domain containing 7; RT-qPCR, reverse transcription-quantitative polymerase chain reaction.
Figure 5.
Figure 5.
Biological effects of FBXW7 alteration in ACHN and SN12PM6 cell lines. (A) FBXW7 mRNA expression level was determined by RT-qPCR following sh-FBXW7 transfection (n=3). (B) FBXW7 mRNA expression level was determined by RT-qPCR following FBXW7 overexpression (n=3). (C) FBXW7 protein expression was determined by western blotting following sh-FBXW7 transfection. (D) Western blotting bands were quantified using ImageJ software. Relative FBXW7 expression levels were normalized to β-actin. *P<0.05 vs. untransfected cells (Blank); ^P<0.05 vs. sh-control (n=3). (E) FBXW7 protein expression was determined by western blotting following FBXW7 overexpression. (F) Western blotting bands were quantified using ImageJ software. Relative FBXW7 expression levels were normalized to β-actin. *P<0.05 vs. untransfected cells (Blank); ^P<0.05 vs. control-OE (n=3). (G) FBXW7 silencing promoted ACHN and SN12PM6 cell proliferation. *P<0.05 vs. untransfected cells; ^P<0.05 vs. sh-control (n=3). FBXW7, F-box and WD repeat domain containing 7; RT-qPCR, reverse transcription-quantitative polymerase chain reaction. (H) FBXW7 overexpression inhibited ACHN and SN12PM6 cell proliferation. *P<0.05 vs. untransfected cells; ^P<0.05 vs. control-OE (n=3). FBXW7, F-box and WD repeat domain containing 7; RT-qPCR, reverse transcription-quantitative polymerase chain reaction.
Figure 5.
Figure 5.
Biological effects of FBXW7 alteration in ACHN and SN12PM6 cell lines. (A) FBXW7 mRNA expression level was determined by RT-qPCR following sh-FBXW7 transfection (n=3). (B) FBXW7 mRNA expression level was determined by RT-qPCR following FBXW7 overexpression (n=3). (C) FBXW7 protein expression was determined by western blotting following sh-FBXW7 transfection. (D) Western blotting bands were quantified using ImageJ software. Relative FBXW7 expression levels were normalized to β-actin. *P<0.05 vs. untransfected cells (Blank); ^P<0.05 vs. sh-control (n=3). (E) FBXW7 protein expression was determined by western blotting following FBXW7 overexpression. (F) Western blotting bands were quantified using ImageJ software. Relative FBXW7 expression levels were normalized to β-actin. *P<0.05 vs. untransfected cells (Blank); ^P<0.05 vs. control-OE (n=3). (G) FBXW7 silencing promoted ACHN and SN12PM6 cell proliferation. *P<0.05 vs. untransfected cells; ^P<0.05 vs. sh-control (n=3). FBXW7, F-box and WD repeat domain containing 7; RT-qPCR, reverse transcription-quantitative polymerase chain reaction. (H) FBXW7 overexpression inhibited ACHN and SN12PM6 cell proliferation. *P<0.05 vs. untransfected cells; ^P<0.05 vs. control-OE (n=3). FBXW7, F-box and WD repeat domain containing 7; RT-qPCR, reverse transcription-quantitative polymerase chain reaction.

Similar articles

Cited by

References

    1. Kabaria R, Klaassen Z, Terris MK. Renal cell carcinoma: Links and risks. Int J Nephrol Renovasc Dis. 2016;9:45–52. - PMC - PubMed
    1. Capitanio U, Bensalah K, Bex A, Boorjian SA, Bray F, Coleman J, Gore JL, Sun M, Wood C, Russo P. Epidemiology of renal cell carcinoma. Eur Urol. 2019;75:74–84. doi: 10.1016/j.eururo.2018.08.036. - DOI - PMC - PubMed
    1. Hsieh JJ, Purdue MP, Signoretti S, Swanton C, Albiges L, Schmidinger M, Heng DY, Larkin J, Ficarra V. Renal cell carcinoma. Nat Rev Dis Primers. 2017;3:17009. doi: 10.1038/nrdp.2017.9. - DOI - PMC - PubMed
    1. Zhou J, Yun EJ, Chen W, Ding Y, Wu K, Wang B, Ding C, Hernandez E, Santoyo J, Pong RC, et al. Targeting 3-phosphoinositide-dependent protein kinase 1 associated with drug-resistant renal cell carcinoma using new oridonin analogs. Cell Death Dis. 2017;8:e2701. doi: 10.1038/cddis.2017.121. - DOI - PMC - PubMed
    1. Campbell SC, Flanigan RC, Clark JI. Nephrectomy in metastatic renal cell carcinoma. Curr Treat Options Oncol. 2003;4:363–372. doi: 10.1007/s11864-003-0037-4. - DOI - PubMed