Comparative Proteomic Investigation of Plasma Reveals Novel Potential Biomarker Groups for Acute Aortic Dissection
- PMID: 32256857
- PMCID: PMC7106916
- DOI: 10.1155/2020/4785068
Comparative Proteomic Investigation of Plasma Reveals Novel Potential Biomarker Groups for Acute Aortic Dissection
Abstract
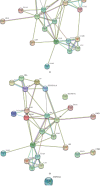
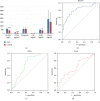
Acute aortic dissection (AAD) is a catastrophic cardiovascular disease with high disability and mortality due to multiple fatal complications. However, the molecular changes of the serum proteome after AAD are not very clear. Here, we performed isobaric tags for relative and absolute quantitation- (iTRAQ-) based comparative proteomic analysis to investigate the proteome profile changes after AAD by collecting plasma samples from 20 AAD patients and 20 controls. Out of the 345 identified proteins, 266 were considered as high-quality quantified proteins (95%confident peptides ≥ 2), of which 25 proteins were accumulated and 12 were reduced in AAD samples. Gene ontology enrichment analysis showed that the 25 AAD-accumulated proteins were enriched in high-density lipoprotein particles for the cellular component category and protein homodimerization acidity for the molecular function category. Protein-protein interaction network analysis showed that serum amyloid A proteins (SAAs), complement component proteins, and carboxypeptidase N catalytic chain proteins (CPNs) possessed the key nodes of the network. The expression levels of six selected AAD-accumulated proteins, B2-GP1, CPN1, F9, LBP, SAA1, and SAA2, were validated by ELISA. Moreover, ROC analysis showed that the AUCs of B2-GP1 and CPN1 were 0.808 and 0.702, respectively. Our data provide insights into molecular change profiles in proteome levels after AAD and indicate that B2-GP1 and CPN1 are potential biomarkers for AAD.
Copyright © 2020 Na Cheng et al.
Conflict of interest statement
The authors declare no competing financial interests.
Figures


Similar articles
-
Applying multi-omics techniques to the discovery of biomarkers for acute aortic dissection.Front Cardiovasc Med. 2022 Dec 15;9:961991. doi: 10.3389/fcvm.2022.961991. eCollection 2022. Front Cardiovasc Med. 2022. PMID: 36588568 Free PMC article. Review.
-
Quantitative proteomics analysis by isobaric tags for relative and absolute quantitation identified Lumican as a potential marker for acute aortic dissection.J Biomed Biotechnol. 2011;2011:920763. doi: 10.1155/2011/920763. Epub 2011 Dec 20. J Biomed Biotechnol. 2011. PMID: 22228989 Free PMC article.
-
Serum amyloid a protein as a potential biomarker in predicting acute onset and association with in-hospital death in acute aortic dissection.BMC Cardiovasc Disord. 2019 Dec 3;19(1):282. doi: 10.1186/s12872-019-1267-0. BMC Cardiovasc Disord. 2019. PMID: 31810459 Free PMC article.
-
Acute Aortic Dissection Biomarkers Identified Using Isobaric Tags for Relative and Absolute Quantitation.Biomed Res Int. 2016;2016:6421451. doi: 10.1155/2016/6421451. Epub 2016 Jun 15. Biomed Res Int. 2016. PMID: 27403433 Free PMC article.
-
N-terminal pro-brain natriuretic peptide and short-term mortality in acute aortic dissection: A meta-analysis.Clin Cardiol. 2020 Nov;43(11):1255-1259. doi: 10.1002/clc.23436. Epub 2020 Jul 31. Clin Cardiol. 2020. PMID: 32735030 Free PMC article.
Cited by
-
Applying multi-omics techniques to the discovery of biomarkers for acute aortic dissection.Front Cardiovasc Med. 2022 Dec 15;9:961991. doi: 10.3389/fcvm.2022.961991. eCollection 2022. Front Cardiovasc Med. 2022. PMID: 36588568 Free PMC article. Review.
-
Diagnostic accuracy of alternative biomarkers for acute aortic syndrome: a systematic review.Emerg Med J. 2024 Oct 23;41(11):678-685. doi: 10.1136/emermed-2023-213772. Emerg Med J. 2024. PMID: 39107052 Free PMC article.
-
Modeling the Impact of Extracellular Vesicle Cargoes in the Diagnosis of Coronary Artery Disease.Biomedicines. 2024 Nov 25;12(12):2682. doi: 10.3390/biomedicines12122682. Biomedicines. 2024. PMID: 39767589 Free PMC article.
References
-
- Howard D. P. J., Banerjee A., Fairhead J. F. Population-Based Study of Incidence and Outcome of Acute Aortic Dissection and Premorbid Risk Factor Control: 10-Year Results From the Oxford Vascular Study. Journal of Vascular Surgery. 2013;58(5):1423–1423. doi: 10.1016/j.jvs.2013.09.018. - DOI - PMC - PubMed
MeSH terms
Substances
LinkOut - more resources
Full Text Sources
Miscellaneous

