

Review
doi: 10.1002/joa3.12308.
eCollection 2020 Apr.
2019 APHRS expert consensus statement on three-dimensional mapping systems for tachycardia developed in collaboration with HRS, EHRA, and LAHRS
Affiliations
- PMID: 32256872
- PMCID: PMC7132207
- DOI: 10.1002/joa3.12308
Item in Clipboard
Review
2019 APHRS expert consensus statement on three-dimensional mapping systems for tachycardia developed in collaboration with HRS, EHRA, and LAHRS
J Arrhythm.
.
No abstract available
Figures
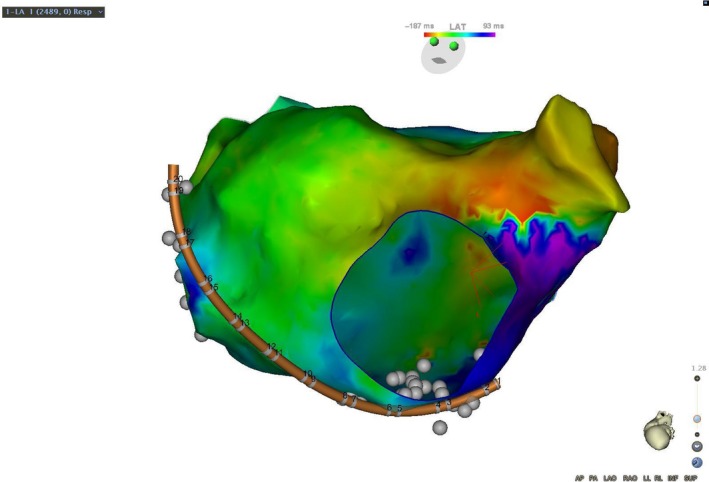
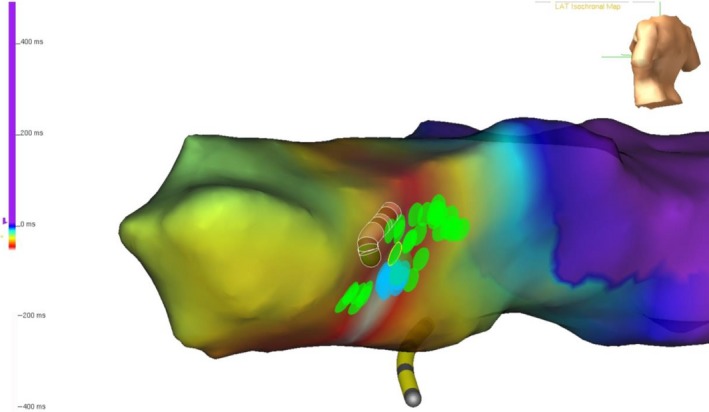
A patient with a prior surgical ablation to isolate the pulmonary veins developed recurrent atypical atrial flutter. The mechanism was determined to be counterclockwise perimitral flutter by a combination of activation and entrainment mapping. Activation propagated superiorly up the lateral left atrium, activating the left atrial appendage and superior left atrium, before propagating down the interatrial septum and floor of the left atrium. The atrial cycle length was 290 milliseconds and the timing reference was in the coronary sinus. The cycle length window was arbitrarily set, resulting in an “early meets late” zone at the base of the left atrial appendage
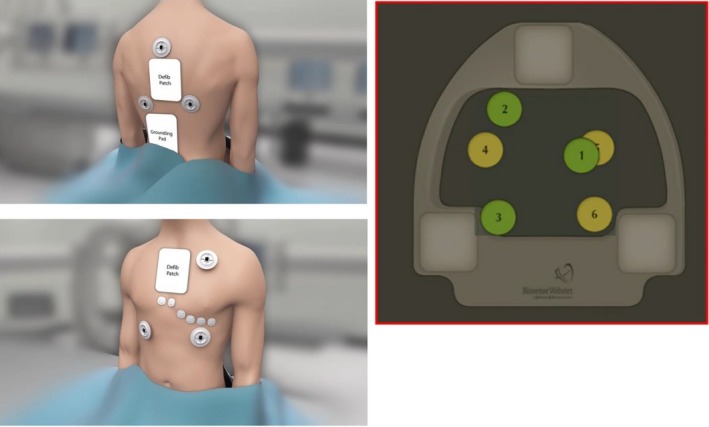
The patch placement of the principle of the CARTO 3 system. The six patches should be placed inside the mapping zone
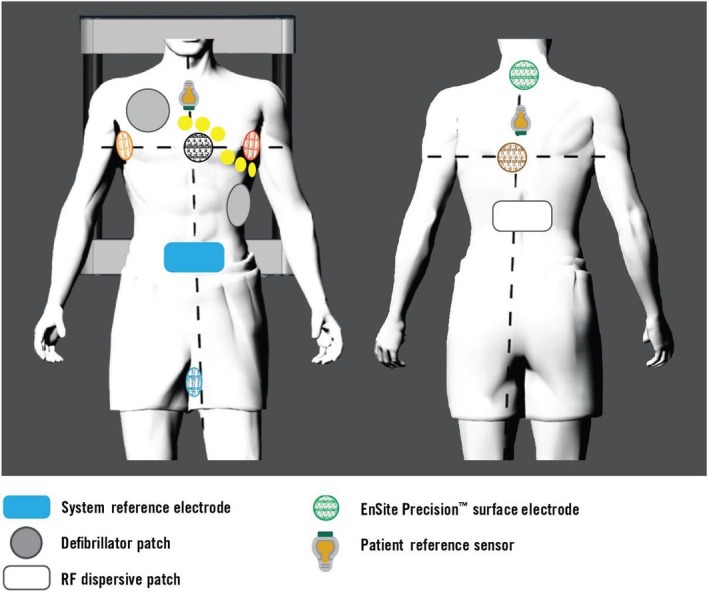
Surface electrodes placed with three transthoracic pairs and two patient reference sensors, along with the other surface electrodes for the EnSite Precision system
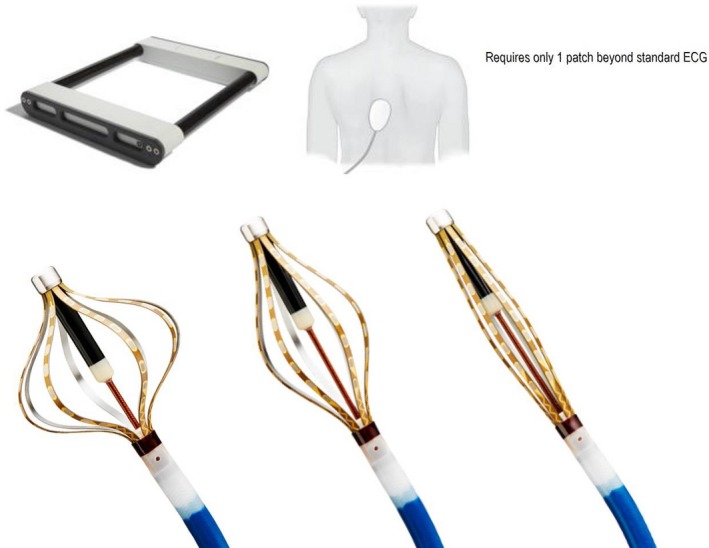
Magnetic field emitter and reference patch on the back of the patient of the Rhythmia system. The lower panel shows the changes in the shape of the IntellaMap Orion catheter
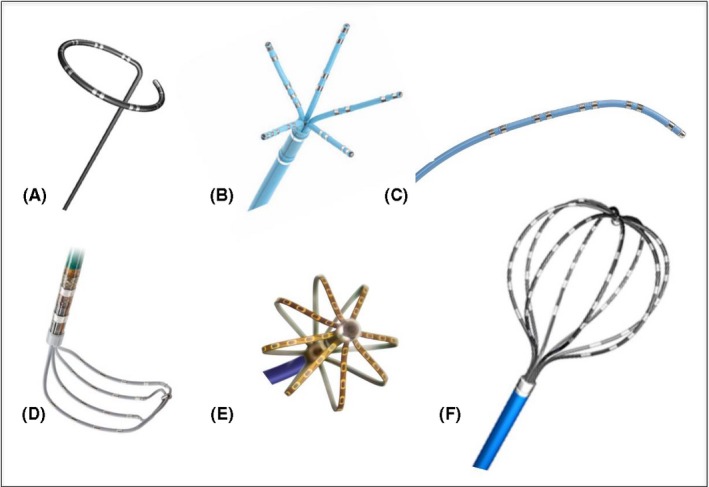
Commercially available dedicated multielectrode mapping catheters. A, Circular loop catheter; B, Five‐splined catheter (PentaRay, Biosense Webster); C, Linear catheter (Decapolar, Biosense Webster); D, Grid catheter (HD Grid, Abbott); E, Mini‐basket catheter (Orion, Boston Scientific); F, Basket catheter (Constellation, Boston Scientific)
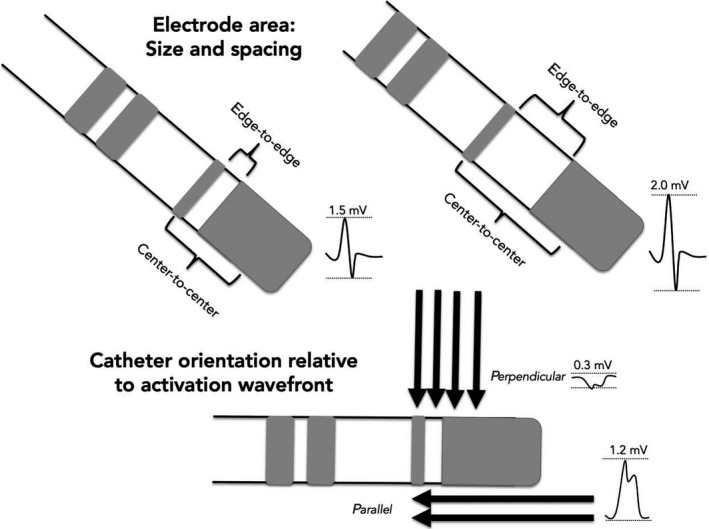
Determinants of bipolar amplitude: Electrode area and catheter orientation relative to activation wavefront. Larger interelectrode spacing increases the field of sensing and results in higher bipolar amplitude compared to smaller distance between bipoles. A perpendicular wavefront may result in cancellation of forces and reduced bipolar electrogram amplitude where as a wavefront that runs parallel activates a bipolar pair in sequence and results in a higher amplitude
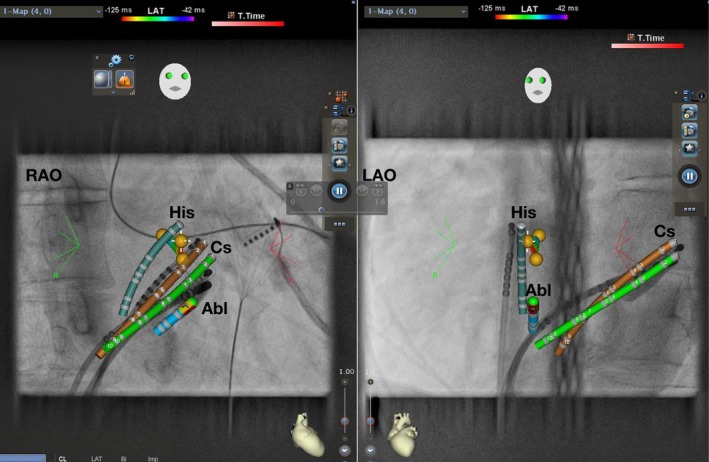
AVNRT ablation using CARTO Univu. RAO 30° and LAO 40° projection. Yellow dots represent His EGM. Green: real‐time CS. Brown: shadow CS allowing detection of catheter dislodgement. Abl, Ablation catheter; AVNRT, atrioventricular nodal reentrant tachycardia; Cs, coronary sinus catheter; EGM, electrogram; His, His catheter; LAO, left anterior oblique; RAO, right anterior oblique
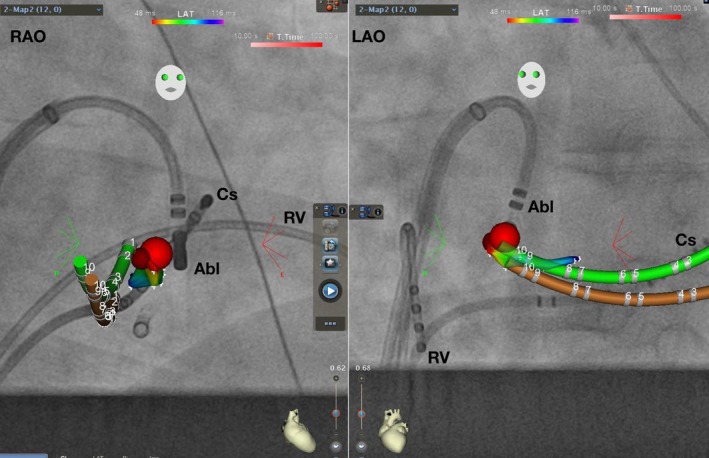
AVRT ablation using CARTO Univu. RAO 30° and LAO 40° projection. Coronary sinus activation map shows earliest ventricular signal during preexcitation in red color. Red dot represents successful ablation site. Green: real‐time CS. Brown: shadow CS allowing detection of catheter dislodgement. Abl, Ablation catheter; AVRT, atrioventricular reentrant tachycardia; Cs, coronary sinus catheter; LAO, left anterior oblique; RAO, right anterior oblique
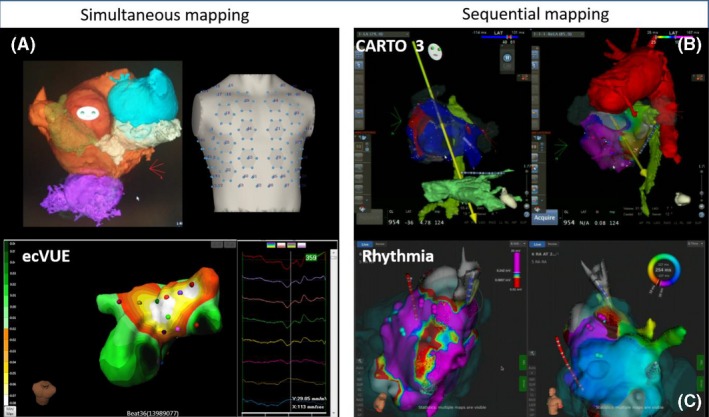
Options of 3D mapping systems. 3D, three‐dimensional
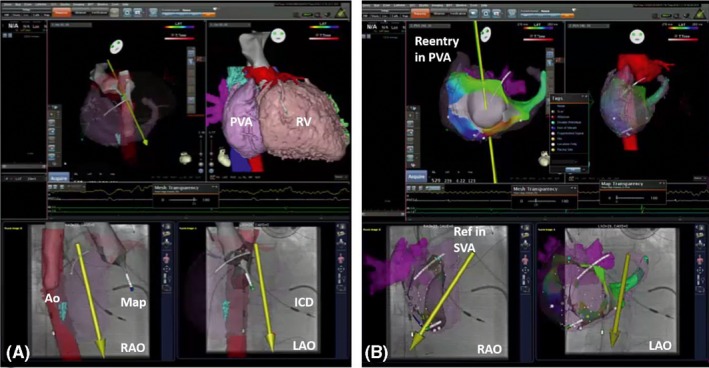
Example of picture‐in‐picture 3D imaging + 3D mapping. Examples of 3D image integration from 3D DICOM files (CT) in a patient with transposition of the great arteries (TGA) and Mustard repair plus ICD implantation. A, The merging of the 3D fast anatomical map (FAM) of the aorta during retrograde remote‐controlled mapping to allow best registration. Please note that the magnetic catheter has just crossed the aortic valve and is aligned in parallel to the magnetic field vector (yellow arrow). B, The 3D local activation time (LAT) map of a peritricuspid reentry in the pulmonary venous atrium (PVA). Please note the timing reference catheter (REF) in the systemic venous atrium (SVA). 3D, three‐dimensional
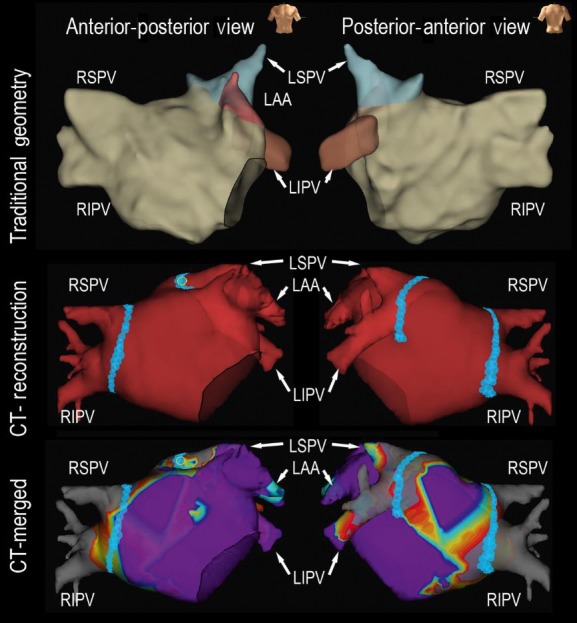
A representative case using CT reconstruction for paroxysmal atrial fibrillation catheter ablation. Upper panel: 3D geometry created by traditional circular catheter; Middle panel: Merged CT reconstruction geometry during catheter ablation; Lower panel: Merged CT reconstruction with 3D bipolar voltage mapping using a circular mapping catheter. 3D, three‐dimensional; CT, computed tomography; LAA, left atrial appendage; LIPV, left inferior pulmonary vein; LSPV, left superior pulmonary vein; RIPV, right inferior pulmonary vein; RSPV, right superior pulmonary vein
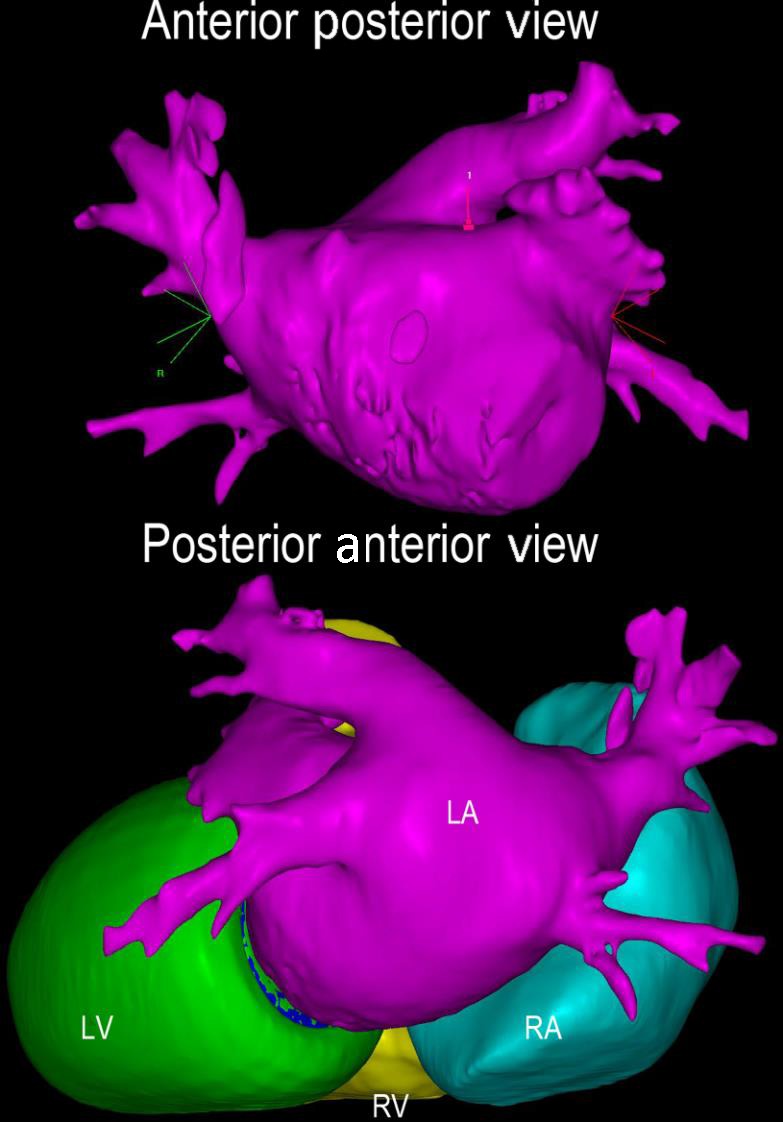
Contrast‐enhanced CT with three‐dimensional reconstruction. Contrast‐enhanced CT images were uploaded to CARTOSEG CT Segmentation Module software (Biosense Webster, Inc). Structures of the left and right atria and ventricles were created without any prior manual input. CT, computed tomography; LA, left atrium; LV, left ventricle; RA, right atrium; RV, right ventricle
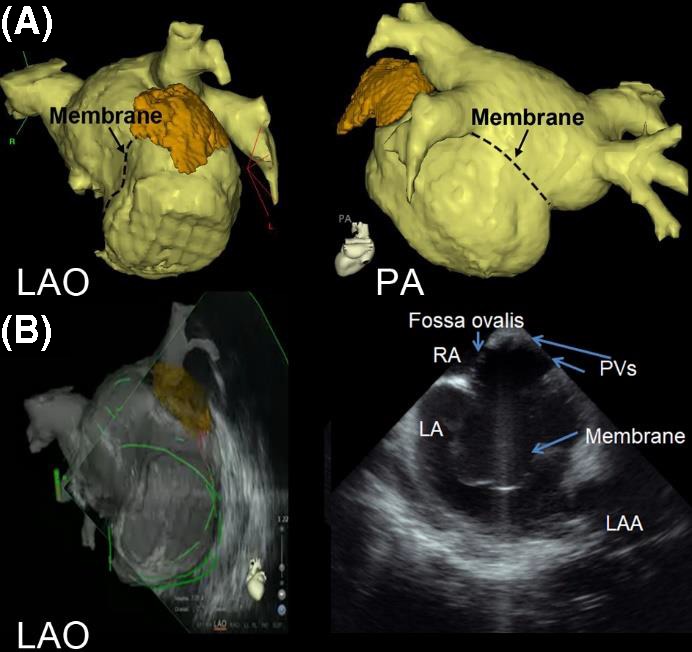
A representative case using intracardiac echocardiography and CT reconstruction for atrial fibrillation catheter ablation in a patient with cor triatriatum. A, 3D reconstruction of the LA image by computed tomography (CT) is shown in LAO view and PA view. The location of the membrane is marked with dotted lines. B, LA geometry is created by real‐time intracardiac echocardiography under the guidance of reconstructed CT. The PVs are identified above the membrane by intracardiac echocardiography and the sound geometry is created. 3D, three‐dimensional; LA, left atrium; CT, computed tomography; LAO, left anterior oblique; PA, posterior anterior; PV, pulmonary vein
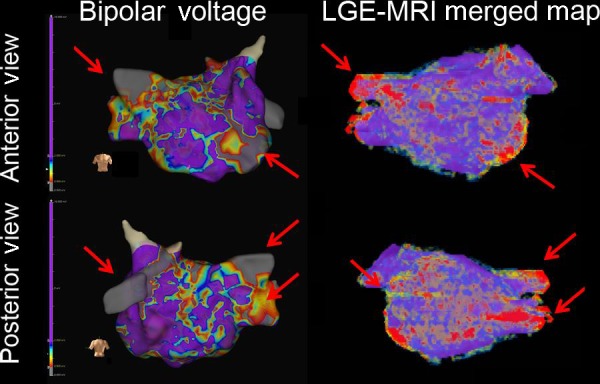
A representative case using LGE‐MRI reconstruction for persistent atrial fibrillation catheter ablation. 3D mapping (left panel) with bipolar voltage mapping is shown in anterior view (upper panel) and posterior view (lower panel). The LGE‐MRI reconstruction (right panel) showed compatible fibrosis areas in the mitral area, RSPV, RIPV, and LIPV. MRI was merged with 3D electroanatomic mapping during the procedure. 3D, three‐dimensional; LA, left atrium; LGE‐MRI, late gadolinium enhancement‐magnetic resonance imaging; LIPV, left inferior pulmonary vein; RIPV, right inferior pulmonary vein; RSPV, right superior pulmonary vein
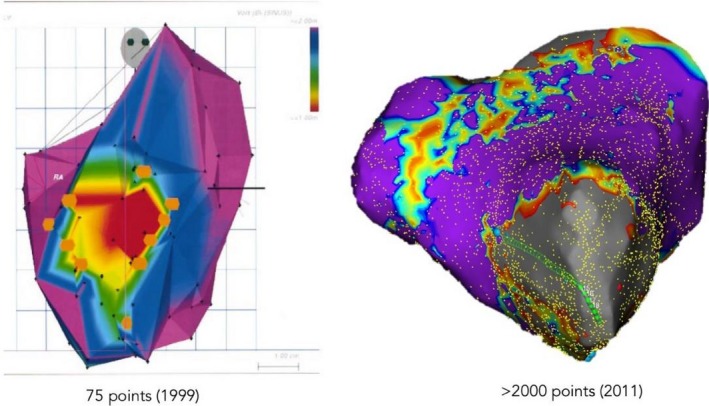
Evolution of mapping systems with depiction of anteroapical scar from porcine validation of single‐point mapping systems (CARTO) to higher resolution mapping with multielectrode acquisition in human (NavX)
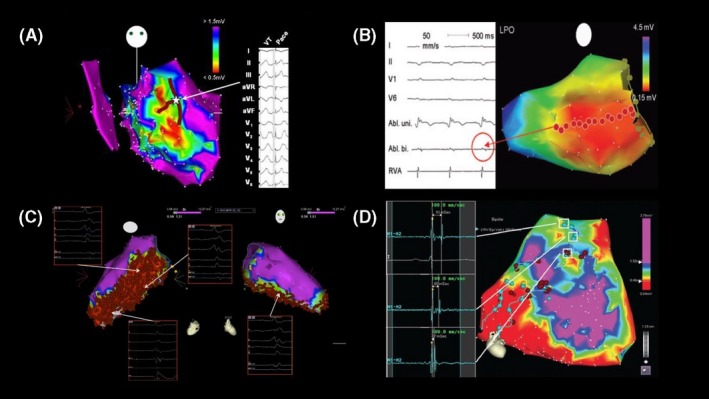
Anatomically based substrate ablation strategies during sinus rhythm. A, Border zone modification with T‐shaped lesions; B, Linear transection; C, Extensive homogenization; D, Dechanneling
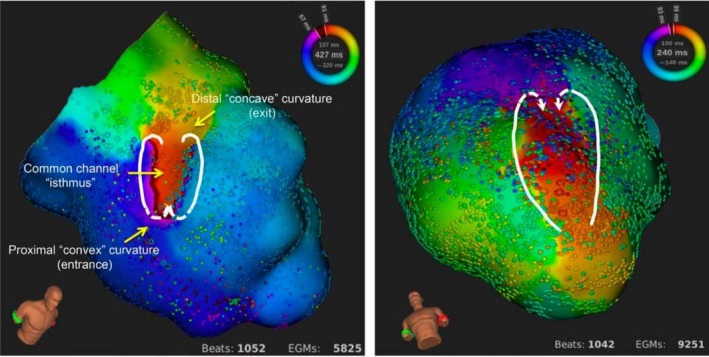
High‐resolution mapping of complete endocardial reentrant circuit with mini‐basket automated system (Rhythmia)
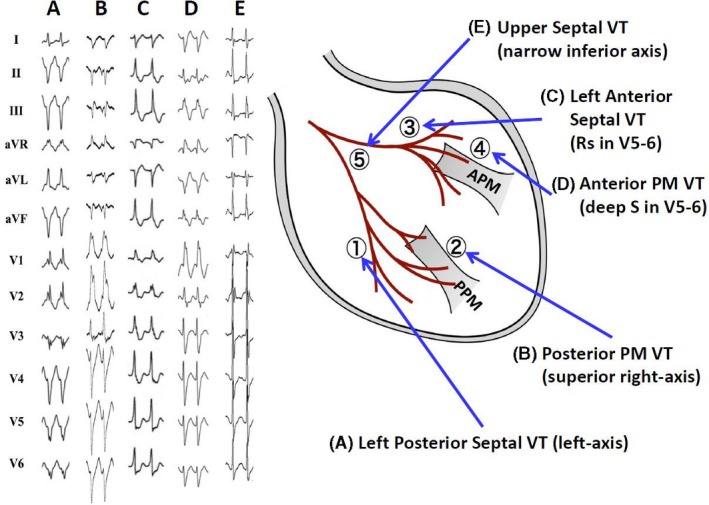
New classification of verapamil‐sensitive left fascicular‐Purkinje ventricular tachycardia (VT). According to the QRS morphology and site of successful ablation, VT can be classified into five subtypes (From Komatsu Y, Nogami A, Kurosaki K, et al. Non‐Reentrant Fascicular Tachycardia: Clinical and Electrophysiological Characteristics of a Distinct Type of Idiopathic Ventricular Tachycardia. Circ Arrhythm Electrophysiol. 2017; 10. pii: e004549. With permission.)
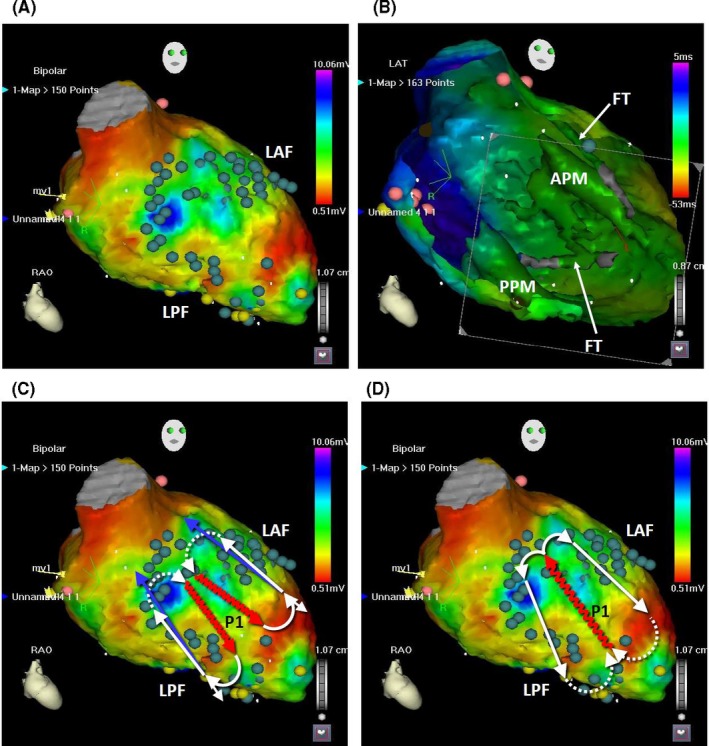
The position of fascicular VT circuits and the Purkinje potentials during sinus rhythm. A, The tags in the CARTOMERGE image indicate the potentials of the left anterior fascicle (LAF), posterior fascicle (LPF), and distal Purkinje fibers during sinus rhythm. B, In the left ventricular cavity, the anterior papillary muscle (APM), posterior papillary muscle (PPM), and false tendons (FT) are observed (endoscopic view). C, The circuits of the left posterior fascicular VT and left anterior fascicular VT are shown. The dotted lines indicate the ventricular myocardium as the proximal bridge between the diastolic and presystolic Purkinje potentials. The undulating line represents a zone of slow conduction. D, The circuit of the left upper septal fascicular VT is shown
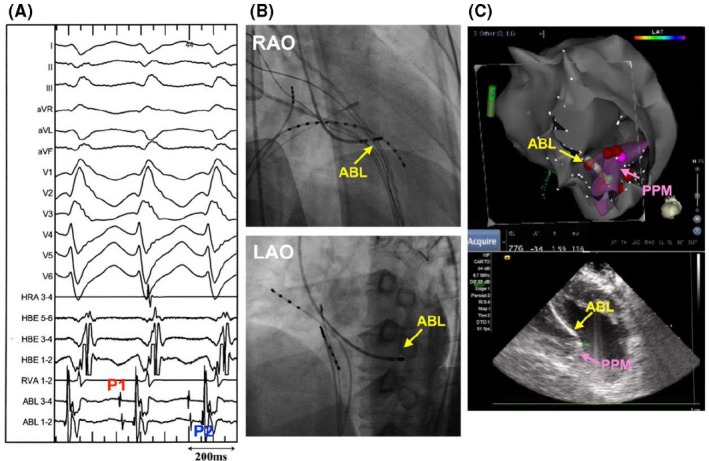
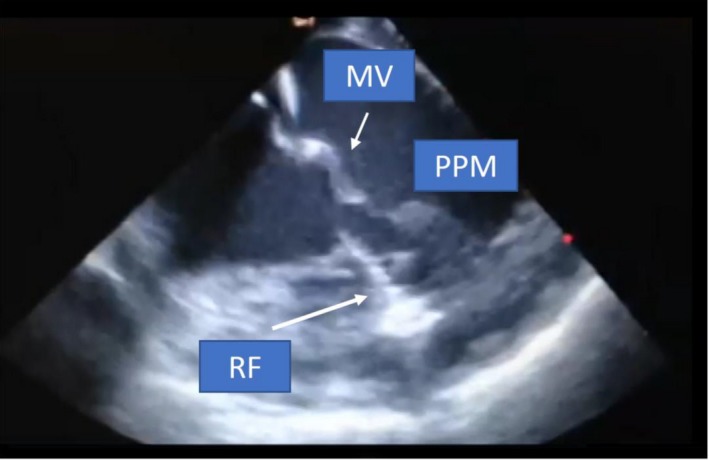
Catheter ablation of posterior papillary muscle fascicular‐Purkinje VT. A and B, VT exhibited RBBB configuration and superior right‐axis deviation. At the successful ablation site, both P1 and P2 are recorded during VT. C, The successful ablation site was located on the posterior papillary muscles (PPM), which is confirmed by real‐time intracardiac ultrasound image (Supplemental Video 9‐1). ABL, ablation catheter; LAO, left oblique projections; and RAO, right oblique projections (From Komatsu Y, Nogami A, Kurosaki K, et al. Non‐Reentrant Fascicular Tachycardia: Clinical and Electrophysiological Characteristics of a Distinct Type of Idiopathic Ventricular Tachycardia. Circ Arrhythm Electrophysiol. 2017; 10. pii: e004549. With permission.)
Anatomic approach when diastolic Purkinje potential cannot be recorded during VT. While the earliest myocardial activation site is observed at the inferoapical septum, diastolic potential could not be recorded (Supplemental Video 9‐2). RF energy was delivered to the exit site, but that was ineffective. Proximal linear lesion successfully suppressed the VT. LAT, lateral projection; LV, left ventricle; RAO, right anterior oblique projection
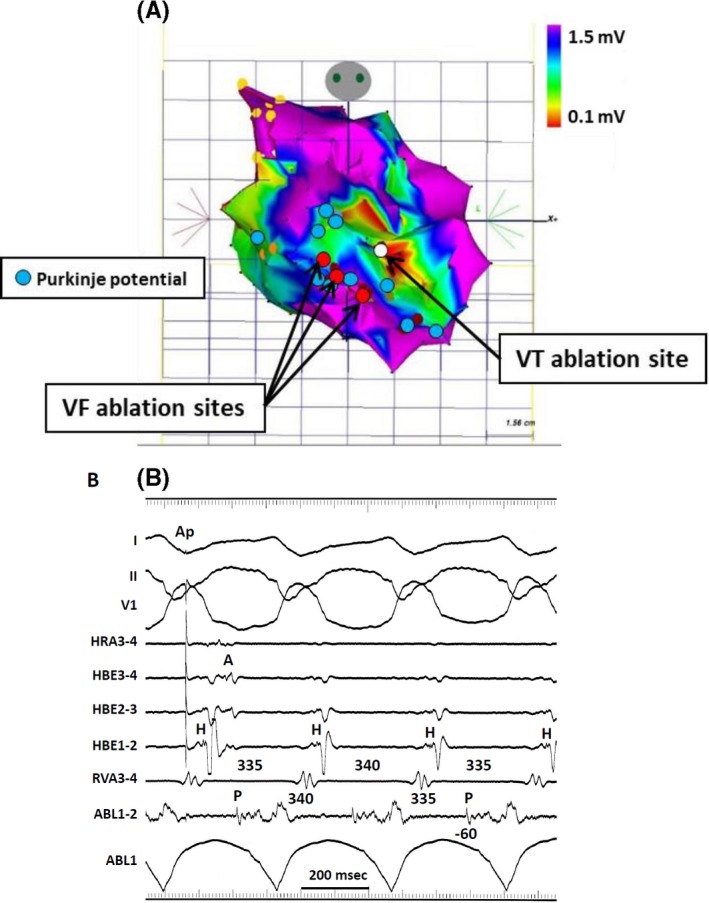
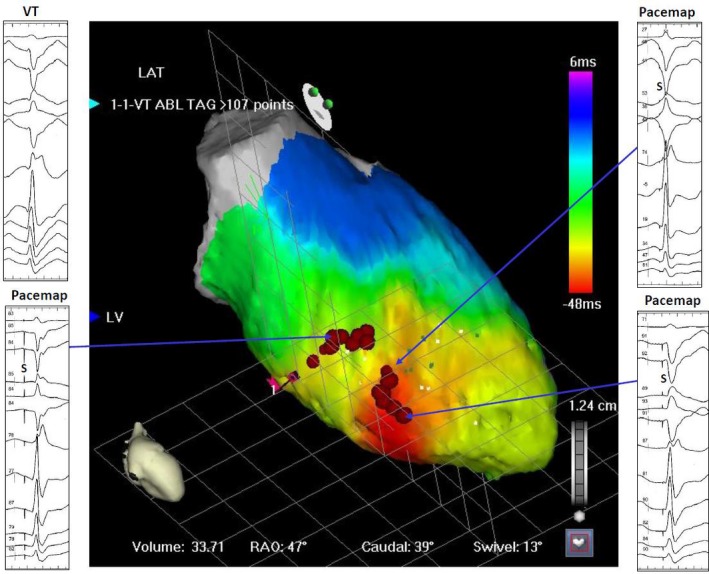
Electroanatomical mapping of postinfarction, Purkinje‐fiber mediated VT. A, The electroanatomical map was created during the second session for monomorphic VT. The red tag indicates the ablation site for ventricular fibrillation in the first session, superimposed on the same map. The white tag indicates the successful ablation site for VT in the second session. The blue tags indicate the Purkinje potentials during sinus rhythm. B, Diastolic Purkinje potentials were recorded during VT and the change of P‐P intervals preceded the changed of V‐V intervals. Single RF energy delivery terminated the VT (From Masuda K, Nogami A, Kuroki K, et al. Conversion to Purkinje‐related monomorphic ventricular tachycardia after ablation of ventricular fibrillation in ischemic heart disease. Circ Arrhythm Electrophysiol. 2016; 9. pii: e004224. With permission.)
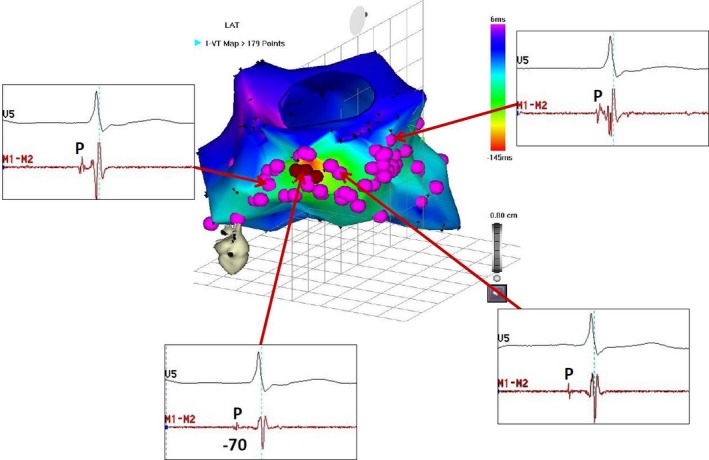
Ablation of non‐reentrant fascicular VT with RBBB configuration and left‐axis deviation. A, Electroanatomic mapping during VT (Supplemental Video 9‐3). Tags indicate the sites with the presystolic Purkinje potential during VT. The earliest Purkinje potential was recorded at the basal inferior wall, and radiofrequency current delivered to this site suppressed the VT. ABL, Ablation catheter; CS, coronary sinus; HBE, His‐bundle electrogram; HRA, high right atrium; LAT, local activation time; RAO, right anterior oblique projection; RVA, right ventricular apex
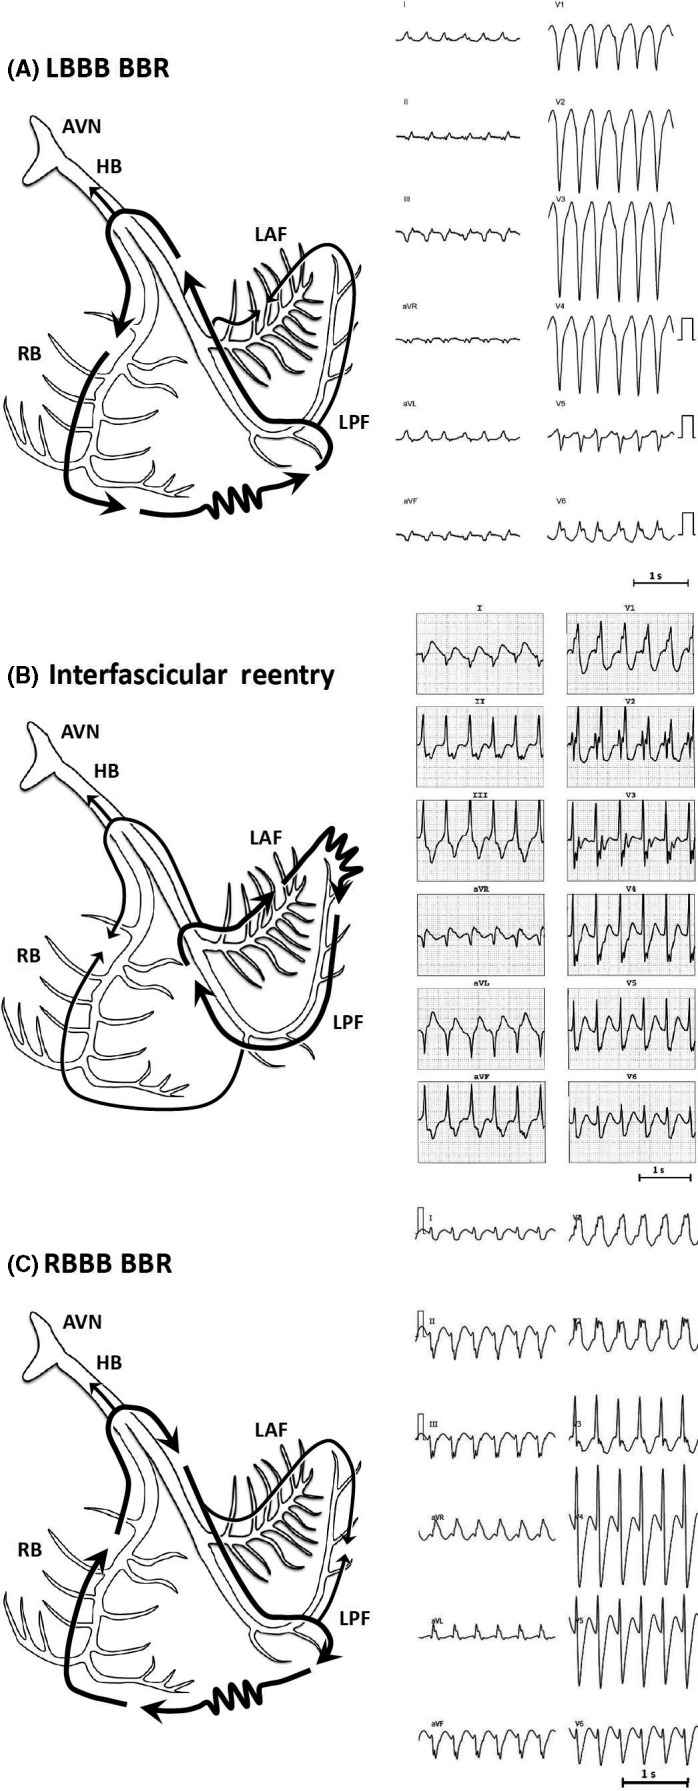
Twelve‐lead ECGs and schematic illustrations of reentrant circuits for BBR and interfascicular reentry tachycardias. A, Type A: Typical type of BBR in which retrograde conduction occurs via the left bundle branch (LBB) and anterograde conduction over the right bundle (RBB) branch. B, Type B: Interfascicular reentry with anterograde and retrograde conduction over opposing fascicles of the LBB. C, Type C. Reversal of the circuit depicted in type A AVN, Atrioventricular node; BBR, bundle branch reentry; HB, His bundle; LAF, left anterior fascicle; LPF, left posterior fascicle; RBB, right bundle branch (Modified from Nogami A: Purkinje‐related arrhythmias. Part I: Monomorphic ventricular tachycardias. Pacing Clin Electrophysiol 34:624‐650, 2011.40)
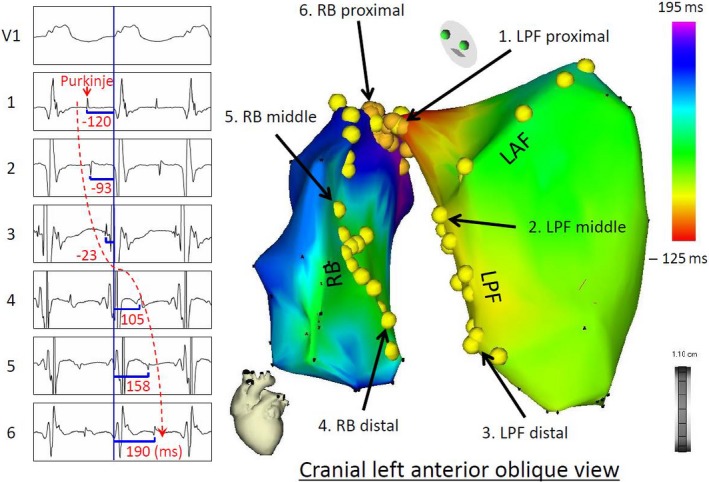
A 3D activation map (right panel) of BBR‐VT descending the left posterior fascicle (LPF) and ascending the right bundle branch (RBB), with the earliest activation displayed in red (LPF proximal) and the latest in violet (RBB proximal). The yellow dots and the numbered sites with arrows indicate fascicular potentials and local activations of the His‐Purkinje system (left panel), respectively. Sequential activations of the local His‐Purkinje system accounted for the entire tachycardia cycle length. The propagation map of BBR‐VT also demonstrated that anterograde activation through the left anterior fascicle and LPF resulted in a collision at the middle portion of the left anterior fascicle—a bystander of the reentrant circuit (Supplemental Video 9‐4). From Machino T, et al: Three‐dimensional visualization of the entire reentrant circuit. Heart Rhythm 10:459‐460, 2013. With permission
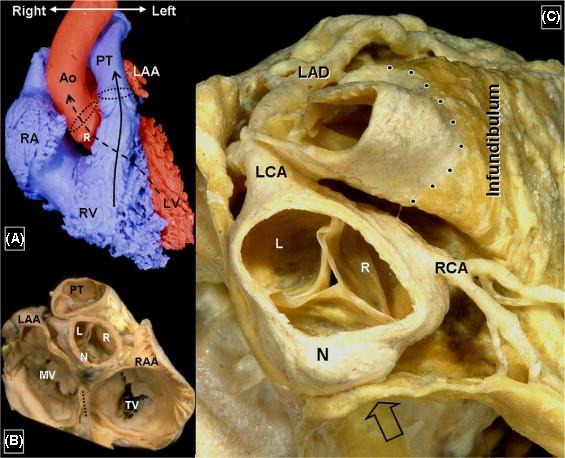
Anatomical specimen of the ventricular outflow tract (from: Ho SY. Anatomic insights for catheter ablation of ventricular tachycardia. Heart Rhythm 2009;6:S77‐80). Ao: aorta; L: left coronary cusp; LAA: left atrial appendage; LAD: left anterior decending artery; LCA: left circumflex artery; LV: left ventricle; MV: mitral valve; N: noncoronary cusp; PT: pulmonary trunk; R: right coronary cusp; RAA: right atrial appendage; RCA: right coronary artery; RV: right ventricle; TV: tricuspid valve
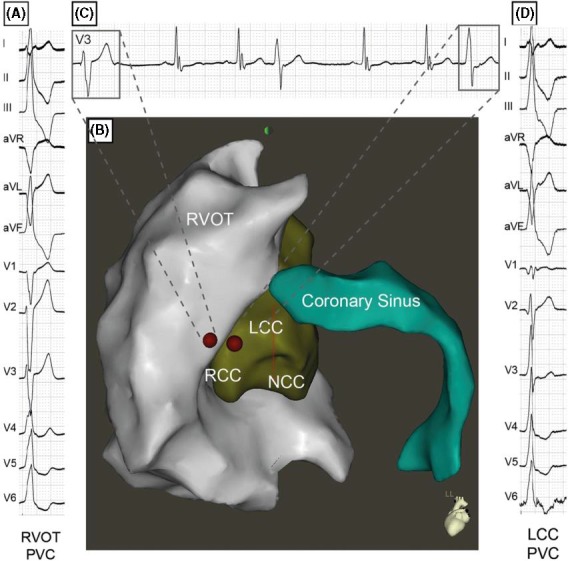
3D map (B) and electrograms showing the changing exit site from a PVC initially ablated from the RVOT (A). The subtle change in QRS morphology in V3 (C) indicates a changing exit to the left coronary cusp (D) where it was successfully ablated (Pavlovic N, Knecht S, Kuhne M, Sticherling C. Changing exits in ventricular outflow tract tachycardia. Heart Rhythm 2014;11:1495‐6). RVOT: right ventricular outflow tract; LCC: left coronary cusp; NCC: noncoronary cusp; PVC: premature ventricular contraction; RCC: right coronary cusp; RVOT: right ventricular outflow tract
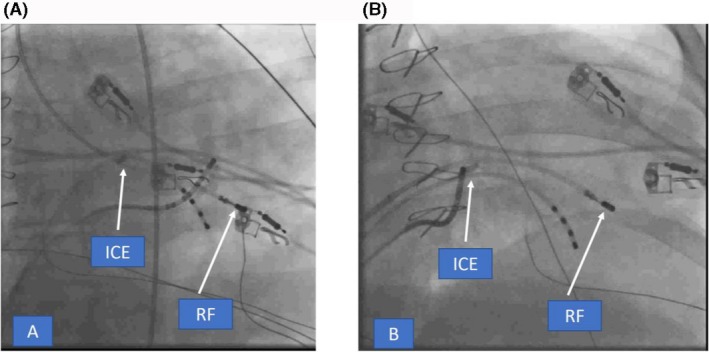
Fluoro pictures in RAO showing retrograde (A) and transseptal (B) accesses to map the posterior PM in the LV. ICE catheter is depicted in the RV (arrows). ICE, intracardiac echocardiography; LV, left ventricle; PM, papillary muscle; RAO, right anterior oblique; RV, right ventricle
ICE picture acquired from the RV showing RFCA at the base in one of the posterior PM. Evident tissue edema due to RF application is seen as bright white lesion on ICE (arrow). ICE, intracardiac echocardiography; PM, papillary muscle; RV, right ventricle
NavX‐guided LV activation map after PVC ablation in the PMs, showing focal pattern of activation and depicting the best RF application sites (blue dots) as well as the extra lesions in different segments of the PM to ensure all exits were targeted (green dots). LV, left ventricle; PM, papillary muscle; PVC, premature ventricular contraction
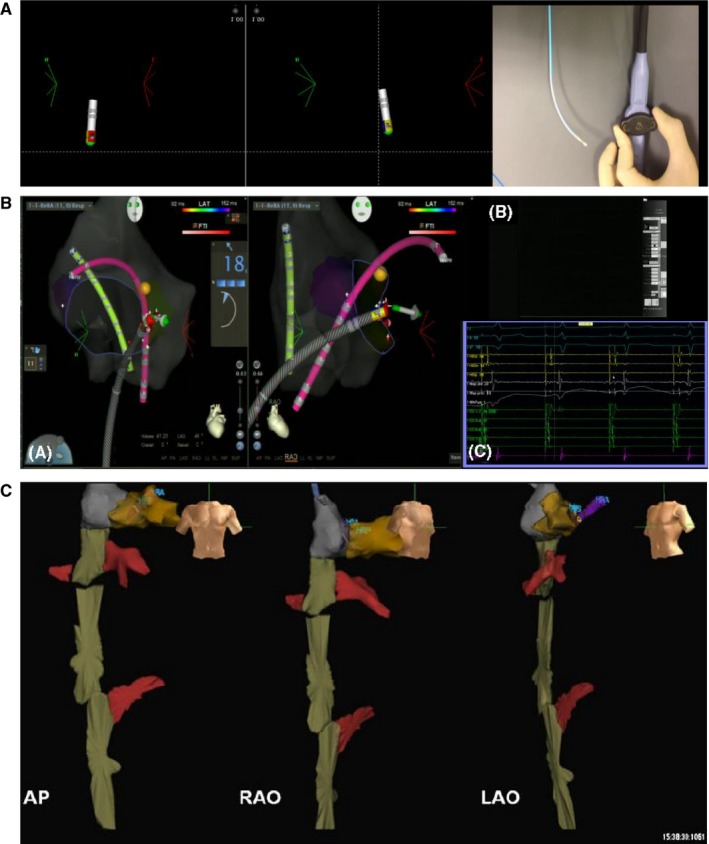
Examples of fluoro‐less catheter manipulation. A, Depiction of the color of deflection of a bidirectional catheter (Navistar, Biosense Webster): the smaller curve on the handle deflects the catheter toward the red color of the tip, while the larger curve deflects toward blue. Rotation in clockwise or counterclockwise fashion allows due to a fairly stiff catheter (torque) to navigate completely nonfluoroscopically. B, Example of a nonfluoroscopic manual ablation of a midseptal accessory pathway using 3D EAM guidance (A). Please note the 3D depiction of the right atrial anatomy with tagging of the compact AV node (yellow tag) and depiction of two diagnostic catheters. The fluoroscopic system is not used at all (B) and all electrograms are displayed on the EP recording system (C). C, Example of 3D visualization of the vasculature after femoral venous access using the NavX system (courtesy of Dr L. Vitalli‐Serdoz). Please note the renal and hepatic veins (in red). This allows to advance the mapping catheter nonfluoroscopically to the right atrium (in grey) which upon “arrival” will show an atrial signal. 3D, three‐dimensional
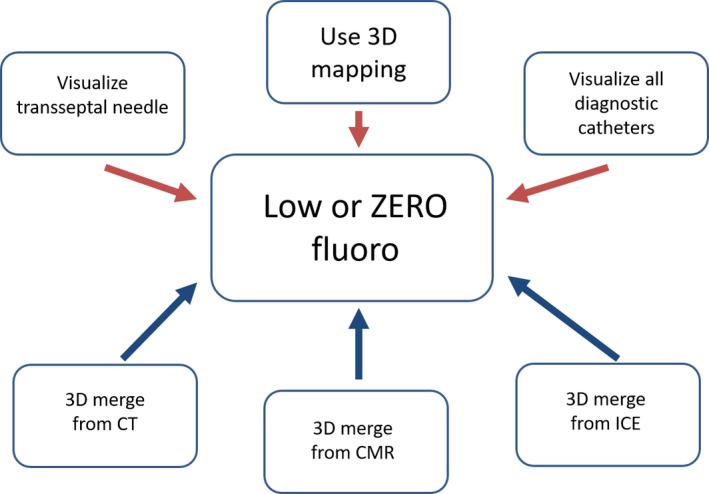
Schematic of options for reduction in fluoroscopy exposure. Concept of using all available information for 3D visualization of catheters and other tools (such as transseptal needle (upper panels, red), as well as all available anatomical information (lower panels, blue) from either 3D merge (computed tomographies (CT) or cardiac magnetic resonance (CMR) imaging) or intracardiac echocardiography (ICE). 3D: three‐dimensional
References
-
- Asirvatham S, Narayan O. Advanced catheter mapping and navigation system In: Huang S, Wood M, editors. Catheter ablation of cardiac arrhythmias. Philadelphia, PA: Saunders/Elsevier, 2006; p. 135–61.
-
- Gurevitz OT, Glikson M, Asirvatham S, Kester TA, Grice SK, Munger TM, et al. Use of advanced mapping systems to guide ablation in complex cases: experience with noncontact mapping and electroanatomic mapping systems. Pacing Clin Electrophysiol. 2005;28:316–23. - PubMed
-
- Corrado D, Basso C, Leoni L, Tokajuk B, Bauce B, Frigo G, et al. Three‐dimensional electroanatomic voltage mapping increases accuracy of diagnosing arrhythmogenic right ventricular cardiomyopathy/dysplasia. Circulation. 2005;111:3042–50. - PubMed
-
- Nakagawa H, Shah N, Matsudaira K, Overholt E, Chandrasekaran K, Beckman KJ, et al. Characterization of reentrant circuit in macroreentrant right atrial tachycardia after surgical repair of congenital heart disease: isolated channels between scars allow "focal" ablation. Circulation. 2001;103:699–709. - PubMed
Publication types
LinkOut - more resources
Full Text Sources
Other Literature Sources
