

FUNCTIONAL PRINCIPAL VARIANCE COMPONENT TESTING FOR A GENETIC ASSOCIATION STUDY OF HIV PROGRESSION
- PMID: 32256927
- PMCID: PMC7111467
- DOI: 10.1214/18-AOAS1135
FUNCTIONAL PRINCIPAL VARIANCE COMPONENT TESTING FOR A GENETIC ASSOCIATION STUDY OF HIV PROGRESSION
Abstract
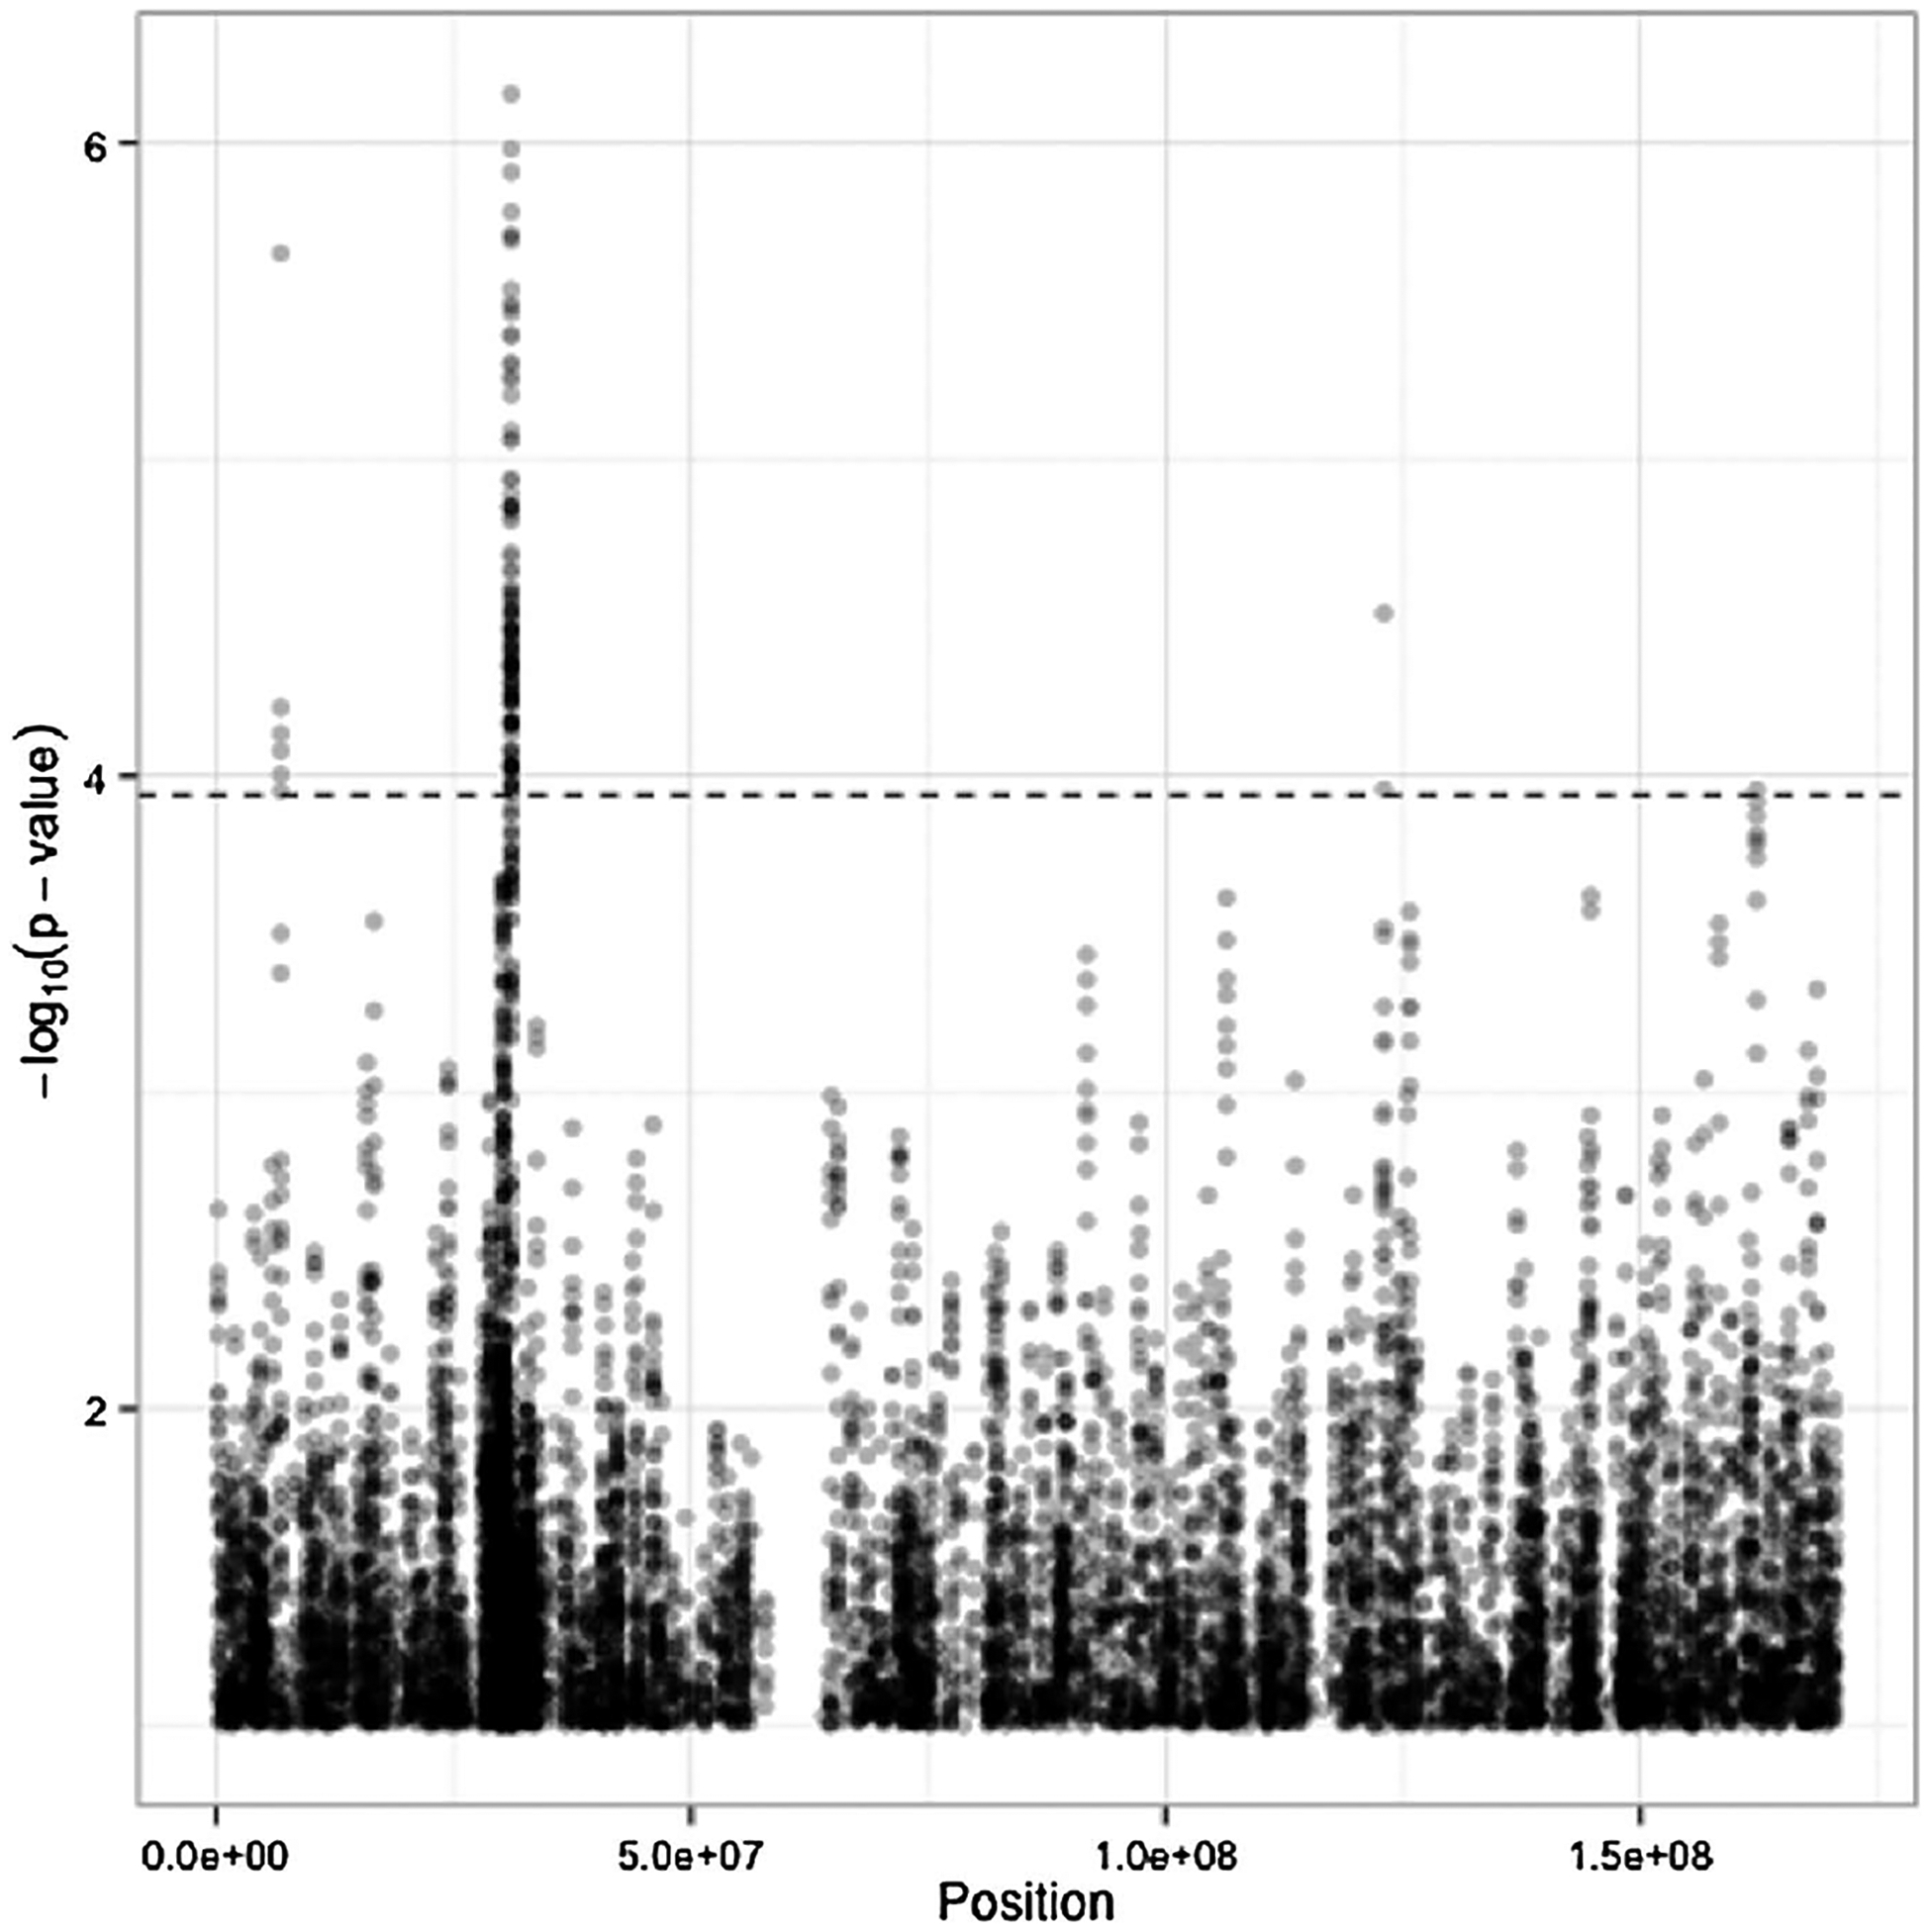
HIV-1C is the most prevalent subtype of HIV-1 and accounts for over half of HIV-1 infections worldwide. Host genetic influence of HIV infection has been previously studied in HIV-1B, but little attention has been paid to the more prevalent subtype C. To understand the role of host genetics in HIV-1C disease progression, we perform a study to assess the association between longitudinally collected measures of disease and more than 100,000 genetic markers located on chromosome 6. The most common approach to analyzing longitudinal data in this context is linear mixed effects models, which may be overly simplistic in this case. On the other hand, existing flexible and nonparametric methods either require densely sampled points, restrict attention to a single SNP, lack testing procedures, or are cumbersome to fit on the genome-wide scale. We propose a functional principal variance component (FPVC) testing framework which captures the nonlinearity in the CD4 and viral load with low degrees of freedom and is fast enough to carry out thousands or millions of times. The FPVC testing unfolds in two stages. In the first stage, we summarize the markers of disease progression according to their major patterns of variation via functional principal components analysis (FPCA). In the second stage, we employ a simple working model and variance component testing to examine the association between the summaries of disease progression and a set of single nucleotide polymorphisms. We supplement this analysis with simulation results which indicate that FPVC testing can offer large power gains over the standard linear mixed effects model.
Keywords: Genomic association studies; HIV disease progression; functional principal component analysis; longitudinal data; mixed effects models; variance component testing.
Figures


References
-
- Antoniadis A and Sapatinas T (2007). Estimation and inference in functional mixed-effects models. Comput. Statist. Data Anal 51 4793–4813.
-
- Baum MK, Campa A, Lai S, Martinez SS, Tsalaile L, Burns P, Farahani M, Li Y, Van Widenfelt E, Page JB et al. (2013). Effect of micronutrient supplementation on disease progression in asymptomatic, antiretroviral-naive, HIV-infected adults in Botswana: A randomized clinical trial. JAMA 310 2154–2163. - PMC - PubMed
-
- Benjamini Y and Hochberg Y (1995). Controlling the false discovery rate: A practical and powerful approach to multiple testing. J. Roy. Statist. Soc. Ser. B 57 289–300.
-
- Castro PE, Lawton WH and Sylvestre EA (1986). Principal modes of variation for processes with continuous sample curves. Technometrics 28 329–337.
Grants and funding
LinkOut - more resources
Full Text Sources
Research Materials