. 2020 Jan 17:2020:3062807.
doi: 10.1155/2020/3062807. eCollection 2020.

Acute Effects of Triathlon Race on Oxidative Stress Biomarkers

Affiliations

Acute Effects of Triathlon Race on Oxidative Stress Biomarkers

Simona Mrakic-Sposta et al. Oxid Med Cell Longev. .

Abstract

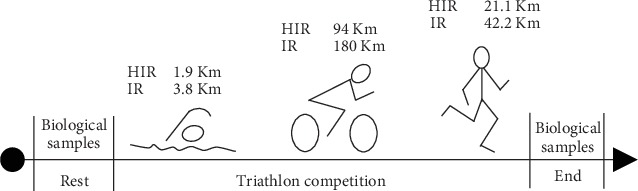
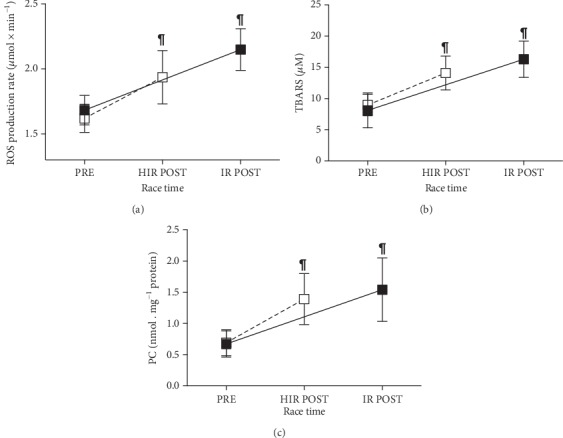
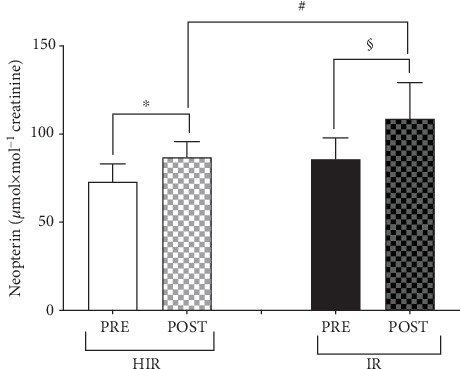
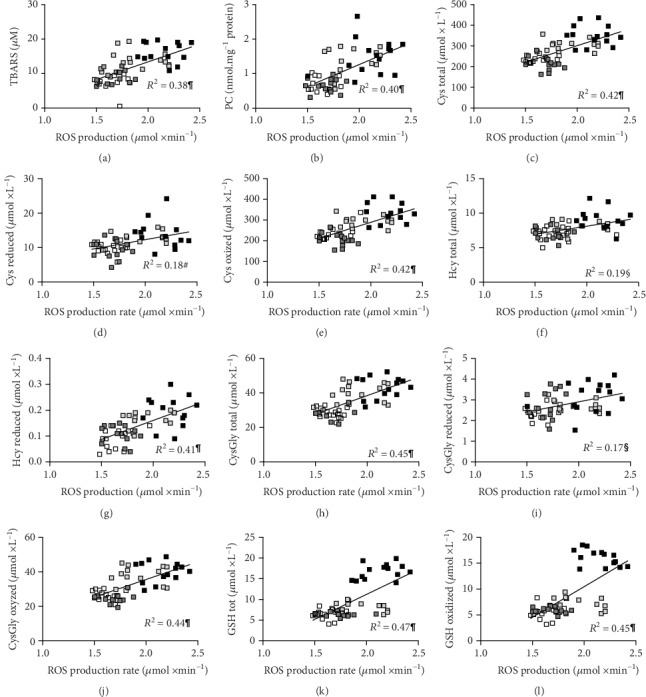
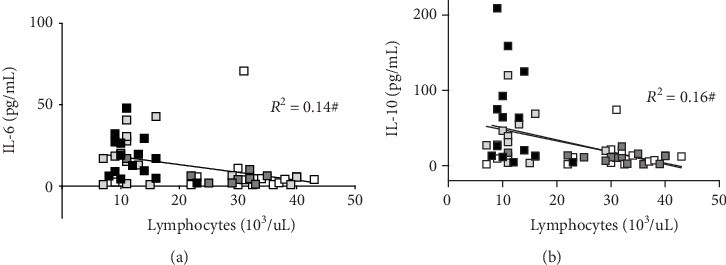
The response to strenuous exercise was investigated by reactive oxygen species (ROS) production, oxidative damage, thiol redox status, and inflammation assessments in 32 enrolled triathlon athletes (41.9 ± 7.9 yrs) during Ironman® (IR), or half Ironman® (HIR) competition. In biological samples, inflammatory cytokines, aminothiols (glutathione (GSH), homocysteine (Hcy), cysteine (Cys), and cysteinylglycine (CysGly)), creatinine and neopterin, oxidative stress (OxS) biomarkers (protein carbonyl (PC), thiobarbituric acid-reactive substances (TBARS)), and ROS were assessed. Thirteen HIR and fourteen IR athletes finished the race. Postrace, ROS (HIR +20%; IR +28%; p < 0.0001), TBARS (HIR +57%; IR +101%), PC (HIR +101%; IR +130%) and urinary neopterin (HIR +19%, IR +27%) significantly (range p < 0.05-0.0001) increased. Moreover, HIR showed an increase in total Cys +28%, while IR showed total aminothiols, Cys, Hcy, CysGly, and GSH increase by +48, +30, +58, and +158%, respectively (range p < 0.05-0.0001). ROS production was significantly correlated with TBARS and PC (R 2 = 0.38 and R 2 = 0.40; p < 0.0001) and aminothiols levels (range R 2 = 0.17-0.47; range p < 0.01-0.0001). In particular, ROS was directly correlated with the athletes' age (R 2 = 0.19; p < 0.05), with ultraendurance years of training (R 2 = 0.18; p < 0.05) and the days/week training activity (R 2 = 0.16; p < 0.05). Finally, the days/week training activity (hours/in the last 2 weeks) was found inversely correlated with the IL-6 postrace (R 2 = -0.21; p < 0.01). A strenuous performance, the Ironman® distance triathlon competition, alters the oxidant/antioxidant balance through a great OxS response that is directly correlated to the inflammatory parameters; furthermore, the obtained data suggest that an appropriate training time has to be selected in order to achieve the lowest ROS production and IL-6 concentration at the same time.


Conflict of interest statement

The authors declare that there are no conflicts of interest.

Figures

Figure 1
Figure 1
Experimental protocol adopted to measure the OxS parameters on the biological samples collected from the Elbaman (IR) and Elbaman 73 (HIR) selected participants.
Figure 2
Figure 2
Plots of the (a) ROS production rate (μmol·min−1); (b) TBARS (μM), and (c) PC (nmol·mg−1 protein) data collected from the HIR (empty square) and IR (full square) groups. Data are expressed as the mean ± SD. The lines connecting PRE and POST data are displayed as guide for the eyes. Changes over time (POST vs. PRE) were significant at p < 0.0001.
Figure 3
Figure 3
Neopterin concentrations (μmol·mol−1 creatinine) measured from the HIR (empty and grey bars) and IR (full bars) athletes. Results are expressed as the mean ± SD. Significantly different data are displayed between brackets. Changes over time (POST vs. PRE) were significant at p < 0.05, #p < 0.01, and §p < 0.001.
Figure 4
Figure 4
Panel plot showing the individual ROS production rate concentration values (μmol·min−1) plotted versus the following: (a) TBARS (μM); (b) PC (nmol·mg−1 protein); (c) total, (d) reduced, and (e) oxidized Cys (μmol·L−1); (f) total and (g) reduced Hcy (μmol·L−1); (h) total, (i) reduced, and (j) oxidized CysGly (μmol·L−1); (k) total and (l) oxidized glutathione (μmol·L−1) values obtained in HIR athletes at PRE (empty square) and POST (light grey square) and in IR athletes at PRE (dark grey square) and POST (black square). The linear regression lines (solid lines) and the correlation coefficients (R2) are reported in each panel. Significant relationships: #p < 0.01, §p < 0.001, and p < 0.0001.
Figure 5
Figure 5
Panel plot showing the lymphocyte count (103/μL) versus cytokine (a) IL-6 and (b) IL-10 concentrations (pg/mL) obtained from HIR subjects at PRE (empty square) and POST (light grey square) and from IR subjects at PRE (dark grey square) and POST (black square). The linear regression lines (solid lines) and the correlation coefficients (R2) are reported in each panel. Significant relationships: #p < 0.01.

References

    1. Garrett W. E., Kirkendall D. T. Exercise and sport science. Lippincott Williams & Wilkins; 2000.
    1. Etxebarria N., Mujika I., Pyne D. B. Training and competition readiness in triathlon. Sports. 2019;7(5):p. 101. doi: 10.3390/sports7050101. - DOI - PMC - PubMed
    1. Vleck V., Millet G. P., Alves F. B. The impact of triathlon training and racing on athletes' general health. Sports Medicine. 2014;44(12):1659–1692. doi: 10.1007/s40279-014-0244-0. - DOI - PMC - PubMed
    1. Smith L. L., Anwar A., Fragen M., Rananto C., Johnson R., Holbert D. Cytokines and cell adhesion molecules associated with high-intensity eccentric exercise. European Journal of Applied Physiology. 2000;82(1-2):61–67. doi: 10.1007/s004210050652. - DOI - PubMed
    1. Hew-Butler T., Collins M., Bosch A., et al. Maintenance of plasma volume and serum sodium concentration despite body weight loss in Ironman triathletes. Clinical Journal of Sport Medicine. 2007;17(2):116–122. doi: 10.1097/JSM.0b013e3180326836. - DOI - PubMed

LinkOut - more resources