

Chidamide Inhibits Glioma Cells by Increasing Oxidative Stress via the miRNA-338-5p Regulation of Hedgehog Signaling
- PMID: 32256960
- PMCID: PMC7086450
- DOI: 10.1155/2020/7126976
Chidamide Inhibits Glioma Cells by Increasing Oxidative Stress via the miRNA-338-5p Regulation of Hedgehog Signaling
Retraction in
-
RETRACTION: Chidamide Inhibits Glioma Cells by Increasing Oxidative Stress via the miRNA-338-5p Regulation of Hedgehog Signaling.Oxid Med Cell Longev. 2025 Aug 1;2025:9783207. doi: 10.1155/omcl/9783207. eCollection 2025. Oxid Med Cell Longev. 2025. PMID: 40786144 Free PMC article.
Abstract
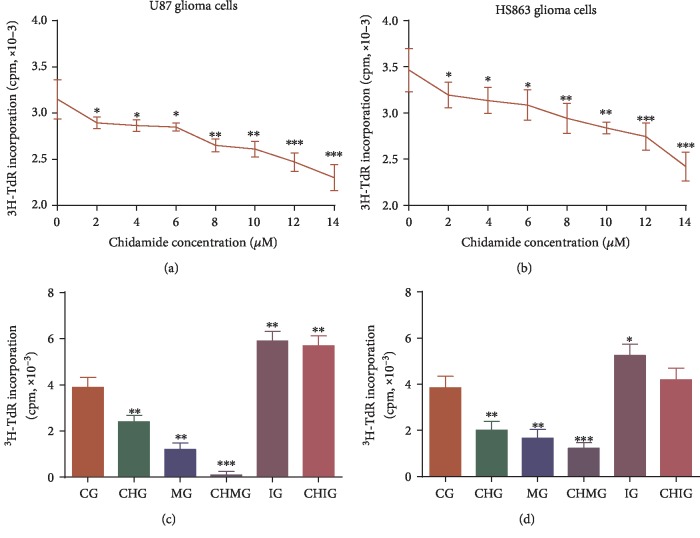
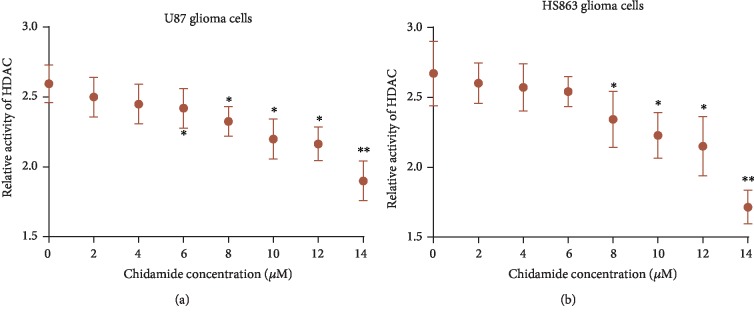
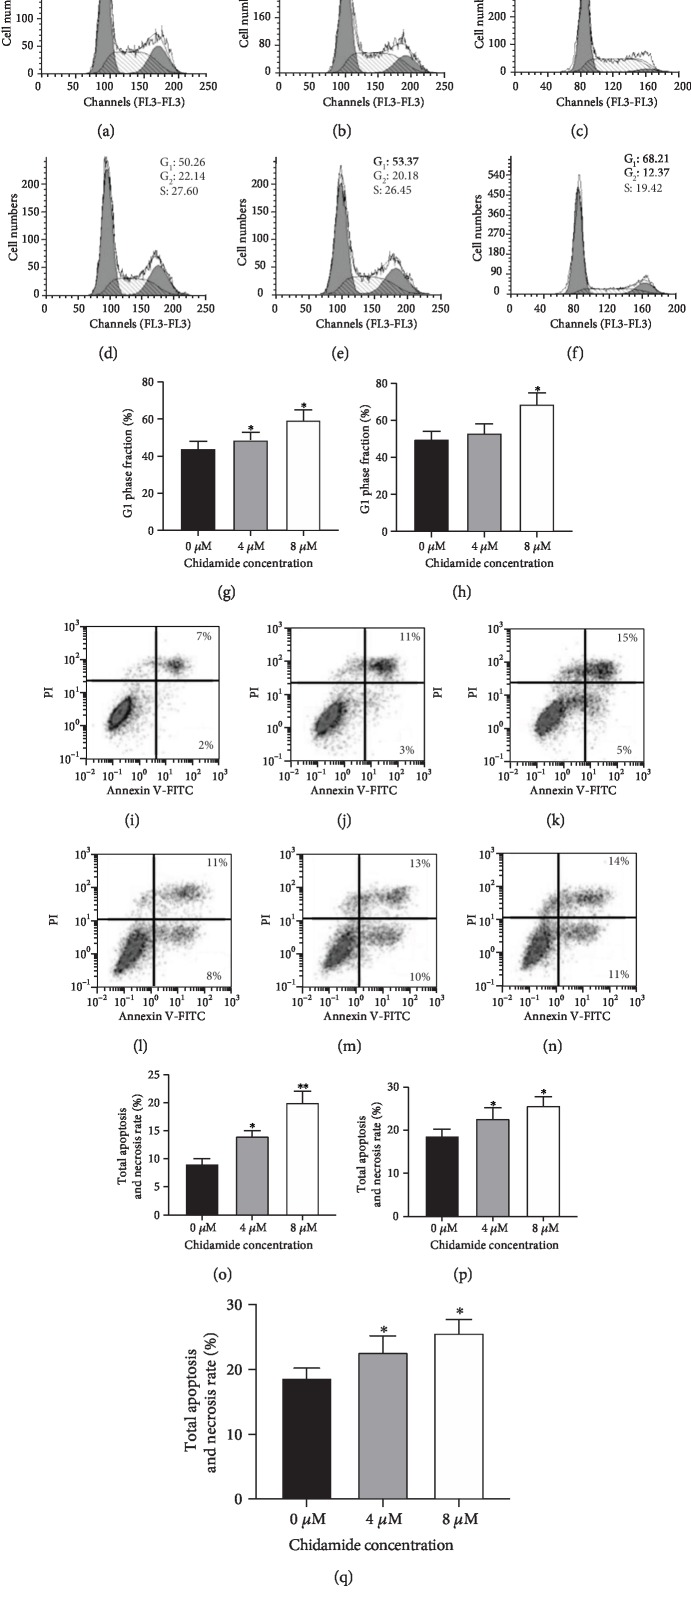
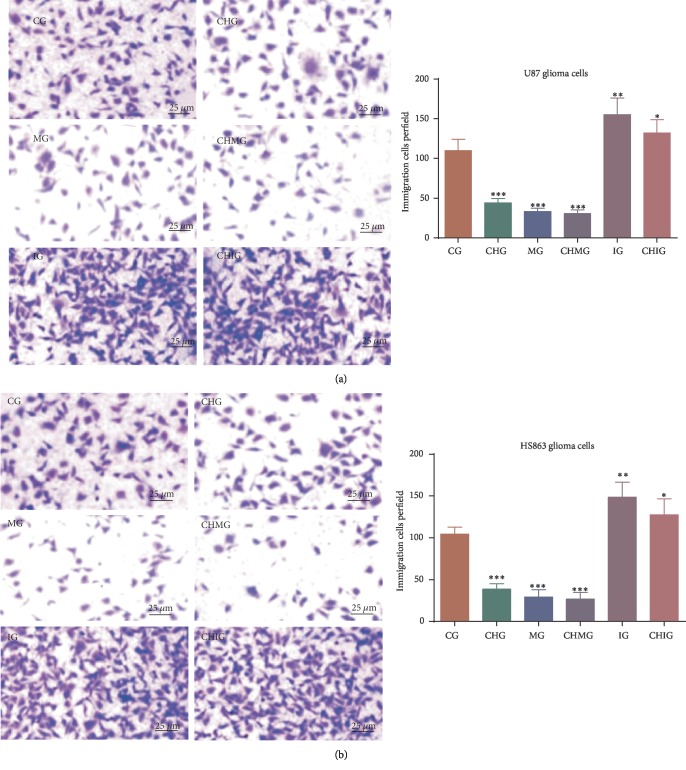
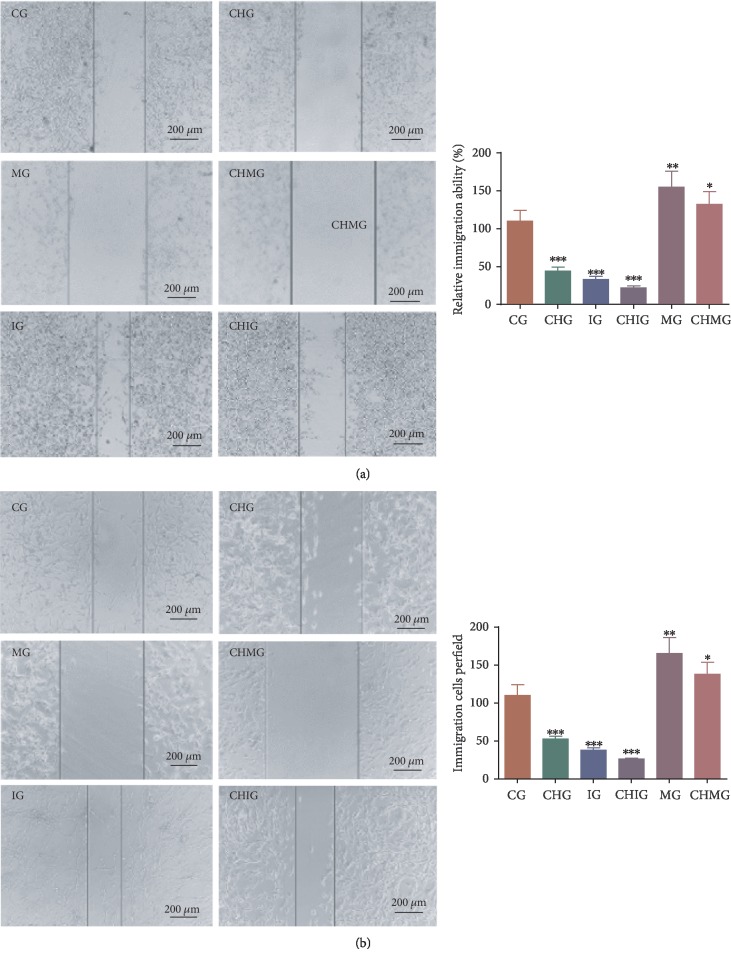
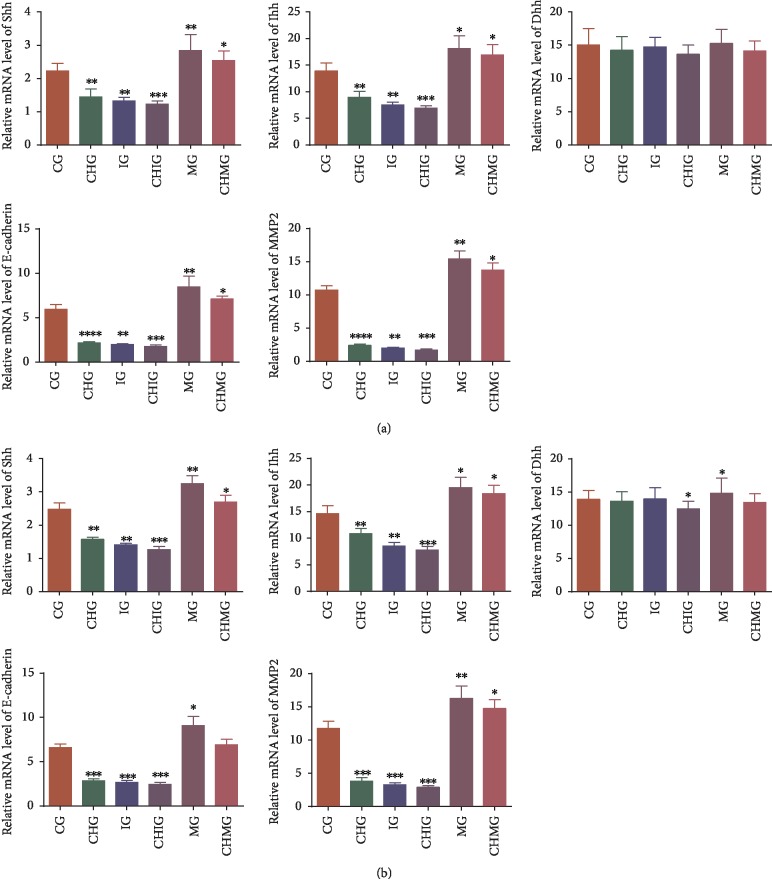
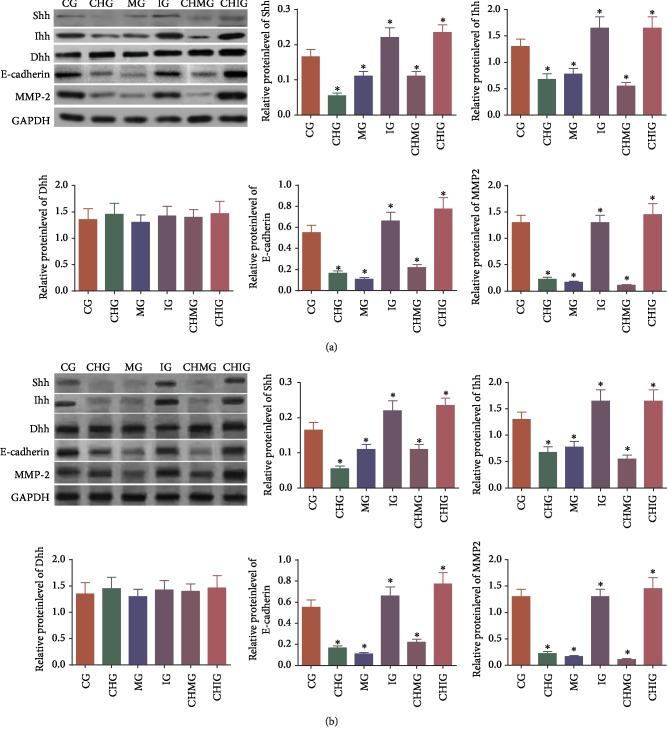
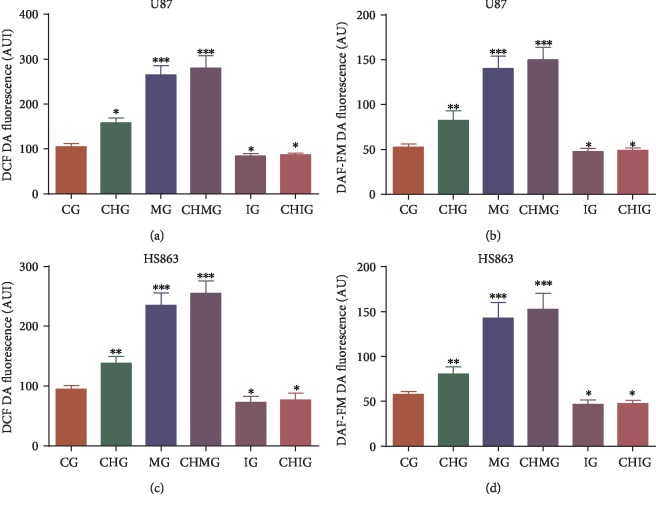
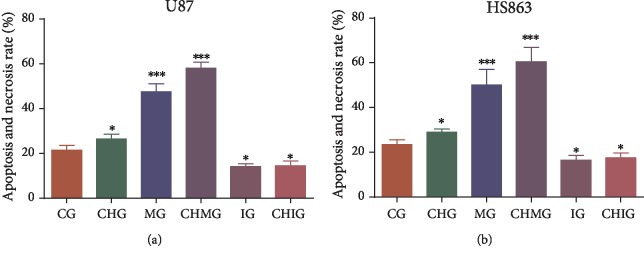
Objective: Chidamide has a broad spectrum of antitumor activity but its function on glioma remains unknown. The increase of reactive oxygen species (ROS) and reactive nitrogen species (RNS) may control glioma risk by promoting its apoptosis and necrosis. Hedgehog pathway is crucial to glioma cell proliferation and controls ROS production. We aimed to explore the effects of chidamide on the levels of miR-338-5p (glioma cell inhibitor), which may regulate Hedgehog signaling, resulting in the changes of RNS. Materials and Methods. Migration and invasion activities of glioma cells were measured by using the Transwell chamber assay. The expression levels of Sonic Hedgehog (Shh), Indian Hedgehog (Ihh), Desert Hedgehog (Dhh), miR-338-5p, and related molecules were detected by using real-time PCR (RT-PCR) and or Western Blot in U87 and HS683 glioma cells. The effects of chidamide on these molecules were measured by using the miR-338-5p inhibitor or mimics in U87 and HS683 glioma cell lines. ROS and RNS were measured by DCF DA and DAF-FM DA fluorescence. Biomarkers of oxidative stress were measured by using a corresponding kit. Apoptosis and necrosis rates were measured by using flow cytometry.
Results: Chidamide inhibited the growth rate, migration, and invasion of human malignant glioma cells and increased the level of miR-338-5p. miR-338-5p inhibitor or mimics increased or inhibited the growth rate of U87 and HS683 glioma cells. Chidamide inhibited the levels of Shh, Ihh, migration protein E-cadherin, and invading protein MMP-2. The increase in the level of Shh and Ihh led to the reduction in the ROS and RNS levels. miR-338-5p inhibitor or mimics also showed a promoting or inhibitory function for the levels of Shh and Ihh. Furthermore, miR-338-5p mimics and inhibitor inhibited or promoted the migration and invasion of the glioma cells (P < 0.05). Evaluated levels of miR-338-5p increased oxidative stress level and apoptosis and necrosis rate by regulating the levels of biomarkers of oxidative stress (P < 0.05). Evaluated levels of miR-338-5p increased oxidative stress level and apoptosis and necrosis rate by regulating the levels of biomarkers of oxidative stress (.
Conclusion: Chidamide inhibits glioma cells by increasing oxidative stress via the miRNA-338-5p regulation of Hedgehog signaling. Chidamide may be a potential drug in the prevention of glioma development.
Copyright © 2020 Haixia Zhou et al.
Conflict of interest statement
The authors declare that there are no other nonfinancial competing interests.
Figures

Similar articles
-
MicroRNA-338-5p plays a tumor suppressor role in glioma through inhibition of the MAPK-signaling pathway by binding to FOXD1.J Cancer Res Clin Oncol. 2018 Dec;144(12):2351-2366. doi: 10.1007/s00432-018-2745-y. Epub 2018 Sep 17. J Cancer Res Clin Oncol. 2018. PMID: 30225541 Free PMC article.
-
Shikonin inhibits epithelial-mesenchymal transition in glioblastoma cells by upregulating p53 and promoting miR-361-5p level to suppress ZEB1 expression.BMC Neurosci. 2025 Jul 1;26(1):37. doi: 10.1186/s12868-025-00956-6. BMC Neurosci. 2025. PMID: 40597639 Free PMC article.
-
Brusatol suppresses malignant progression of glioma via modulating the miR-574-5p/USP10/PLK1 axis.Phytomedicine. 2025 Oct;146:157142. doi: 10.1016/j.phymed.2025.157142. Epub 2025 Aug 6. Phytomedicine. 2025. PMID: 40779822
-
The effectiveness and cost-effectiveness of carmustine implants and temozolomide for the treatment of newly diagnosed high-grade glioma: a systematic review and economic evaluation.Health Technol Assess. 2007 Nov;11(45):iii-iv, ix-221. doi: 10.3310/hta11450. Health Technol Assess. 2007. PMID: 17999840
-
Inducer microRNAs in the glioma development: a concise review of mechanisms and insights into targeted therapy.J Egypt Natl Canc Inst. 2025 Aug 18;37(1):55. doi: 10.1186/s43046-025-00308-9. J Egypt Natl Canc Inst. 2025. PMID: 40820060 Review.
Cited by
-
Potential targets and treatments affect oxidative stress in gliomas: An overview of molecular mechanisms.Front Pharmacol. 2022 Jul 22;13:921070. doi: 10.3389/fphar.2022.921070. eCollection 2022. Front Pharmacol. 2022. PMID: 35935861 Free PMC article. Review.
-
Emerging role of non-coding RNAs in the regulation of Sonic Hedgehog signaling pathway.Cancer Cell Int. 2022 Sep 13;22(1):282. doi: 10.1186/s12935-022-02702-y. Cancer Cell Int. 2022. PMID: 36100906 Free PMC article. Review.
-
The increasing expression of GPX7 related to the malignant clinical features leading to poor prognosis of glioma patients.Chin Neurosurg J. 2021 Mar 10;7(1):21. doi: 10.1186/s41016-021-00235-3. Chin Neurosurg J. 2021. PMID: 33750478 Free PMC article.
-
Chidamide Suppresses the Growth of Cholangiocarcinoma by Inhibiting HDAC3 and Promoting FOXO1 Acetylation.Stem Cells Int. 2022 Jan 28;2022:3632549. doi: 10.1155/2022/3632549. eCollection 2022. Stem Cells Int. 2022. PMID: 35126526 Free PMC article.
-
hsa_circ_0072389, hsa_circ_0072386, hsa_circ_0008621, hsa_circ_0072387, and hsa_circ_0072391 aggravate glioma via miR-338-5p/IKBIP.Aging (Albany NY). 2021 Dec 12;13(23):25213-25240. doi: 10.18632/aging.203740. Epub 2021 Dec 12. Aging (Albany NY). 2021. PMID: 34897031 Free PMC article.
References
-
- Jensen M. Chimeric Immunoreceptor Useful in Treating Human Gliomas. 2009. Google Patents.
-
- Costa Nunes F., Silva L. B., Winter E., et al. Tacrine derivatives stimulate human glioma SF295 cell death and alter important proteins related to disease development: an old drug for new targets. Biochimica et Biophysica Acta (BBA) - General Subjects. 2018;1862(7):1527–1536. doi: 10.1016/j.bbagen.2018.04.019. - DOI - PubMed
Publication types
MeSH terms
Substances
LinkOut - more resources
Full Text Sources
Medical
Miscellaneous
