The climatic association of population divergence and future extinction risk of Solanum pimpinellifolium
- PMID: 32257092
- PMCID: PMC7107907
- DOI: 10.1093/aobpla/plaa012
The climatic association of population divergence and future extinction risk of Solanum pimpinellifolium
Abstract
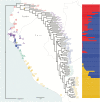
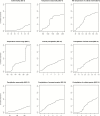
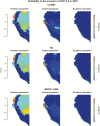
Under intraspecific differentiation driven by differential climatic adaptation, it may be expected that intraspecific genetic groups occur at distinct environments. Populations occupying different niches may therefore differ in their ability to cope with climate change. Here, we addressed this hypothesis with a wild tomato, Solanum pimpinellifolium. This species is distributed from the west side of Andes to the coastal region in Peru and Ecuador and occupies a wide environmental diversity. This environmental diversity is related to the genetic structure of the species providing an ideal material to investigate the isolation by environment hypothesis. While previous hypothesis stated that S. pimpinellifolium originated from northern Peru and migrated northwards and southwards, our results support that S. pimpinellifolium originated from Ecuador and expanded to northern and southern Peru, and during this process, the niche space of S. pimpinellifolium became more associated with cold and drought. We further predicted its fate under anthropogenic climate change. According to our predictions, the northern group will maintain its current extent or even expand to the entire western region of Ecuador. In contrast, we predicted low habitat suitability for the southern group which could potentially lead to the shrinkage of its distribution. In conclusion, we revealed the distinct fates among the differentiated populations driven by environment under global warming conditions.
Keywords: Solanum pimpinellifolium; climate change; isolation by environment; species distribution modelling.
© The Author(s) 2020. Published by Oxford University Press on behalf of the Annals of Botany Company.
Figures


Similar articles
-
Regional differences in the abiotic environment contribute to genomic divergence within a wild tomato species.Mol Ecol. 2020 Jun;29(12):2204-2217. doi: 10.1111/mec.15477. Epub 2020 Jun 9. Mol Ecol. 2020. PMID: 32419208
-
Population structure and phylogeography of Solanum pimpinellifolium inferred from a nuclear gene.Mol Ecol. 2004 Jul;13(7):1871-82. doi: 10.1111/j.1365-294X.2004.02191.x. Mol Ecol. 2004. PMID: 15189210
-
Intraspecific genetic variation matters when predicting seagrass distribution under climate change.Mol Ecol. 2021 Aug;30(15):3840-3855. doi: 10.1111/mec.15996. Epub 2021 Jun 8. Mol Ecol. 2021. PMID: 34022079
-
Evidence of cryptic introgression in tomato (Solanum lycopersicum L.) based on wild tomato species alleles.BMC Plant Biol. 2012 Aug 7;12:133. doi: 10.1186/1471-2229-12-133. BMC Plant Biol. 2012. PMID: 22871151 Free PMC article.
-
Assessment of Genetic Differentiation and Linkage Disequilibrium in Solanum pimpinellifolium Using Genome-Wide High-Density SNP Markers.G3 (Bethesda). 2019 May 7;9(5):1497-1505. doi: 10.1534/g3.118.200862. G3 (Bethesda). 2019. PMID: 30858236 Free PMC article.
Cited by
-
Edaphoclimatic Descriptors of Wild Tomato Species (Solanum Sect. Lycopersicon) and Closely Related Species (Solanum Sect. Juglandifolia and Sect. Lycopersicoides) in South America.Front Genet. 2021 Nov 17;12:748979. doi: 10.3389/fgene.2021.748979. eCollection 2021. Front Genet. 2021. PMID: 34868219 Free PMC article.
-
Unveiling diversity and adaptations of the wild tomato Microbiome in their center of origin in the Ecuadorian Andes.Sci Rep. 2025 Jul 1;15(1):22448. doi: 10.1038/s41598-025-05816-1. Sci Rep. 2025. PMID: 40594354 Free PMC article.
-
Genetic Analysis of Root-to-Shoot Signaling and Rootstock-Mediated Tolerance to Water Deficit in Tomato.Genes (Basel). 2020 Dec 23;12(1):10. doi: 10.3390/genes12010010. Genes (Basel). 2020. PMID: 33374834 Free PMC article.
-
Population transcriptomic sequencing reveals allopatric divergence and local adaptation in Pseudotaxus chienii (Taxaceae).BMC Genomics. 2021 May 26;22(1):388. doi: 10.1186/s12864-021-07682-3. BMC Genomics. 2021. PMID: 34039278 Free PMC article.
-
Introduction to the Special Issue: The ecology and genetics of population differentiation in plants.AoB Plants. 2021 Sep 6;13(6):plab057. doi: 10.1093/aobpla/plab057. eCollection 2021 Dec. AoB Plants. 2021. PMID: 34804467 Free PMC article. Review.
References
-
- Alvarado-Serrano DF, Knowles LL. 2014. Ecological niche models in phylogeographic studies: applications, advances and precautions. Molecular Ecology Resources 14:233–248. - PubMed
-
- Atkins KE, Travis JM. 2010. Local adaptation and the evolution of species’ ranges under climate change. Journal of Theoretical Biology 266:449–457. - PubMed
-
- Banta JA, Ehrenreich IM, Gerard S, Chou L, Wilczek A, Schmitt J, Kover PX, Purugganan MD. 2012. Climate envelope modelling reveals intraspecific relationships among flowering phenology, niche breadth and potential range size in Arabidopsis thaliana. Ecology Letters 15:769–777. - PubMed
-
- Bay RA, Harrigan RJ, Underwood VL, Gibbs HL, Smith TB, Ruegg K. 2018. Genomic signals of selection predict climate-driven population declines in a migratory bird. Science 359:83–86. - PubMed
Publication types
LinkOut - more resources
Full Text Sources

