

Thermography mapping patterns in temporal lobe epilepsy surgery
- PMID: 32257556
- PMCID: PMC7110298
- DOI: 10.25259/SNI_549_2019
Thermography mapping patterns in temporal lobe epilepsy surgery
Abstract
Background: In several epilepsy etiologies, the macroscopic appearance of the epileptogenic tissue is identical to the normal, which makes it hard to balance between how much cytoreduction or disconnection and brain tissue preservation must be done. A strategy to tackle this situation is by evaluating brain metabolism during surgery using infrared thermography mapping (IrTM).
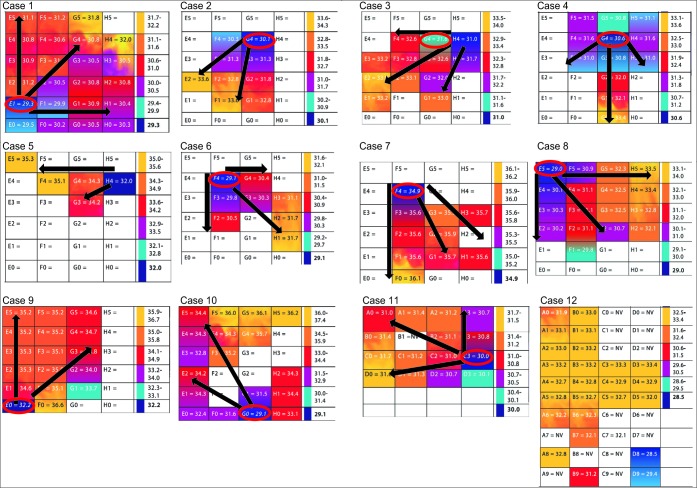
Methods: In 12 epilepsy surgery cases that involved the temporal lobe, we correlated the IrTM, electrocorticography, and neuropathology results.
Results: Irritative zones (IZ) had a lower temperature in comparison to the surrounding cortex with normal electric activity (difference in temperature (ΔT) from 1.2 to 7.1, mean 3.40°C standard deviation ± 1.61). The coldest zones correlated exactly with IZ in 9/10 cortical dysplasia (CD) cases. In case 3, the coldest area was at 1 cm away from the IZ. In 10/10 dysplasia cases (cases 1-4, 6-11), there was a radial heating pattern originating from the coldest cortical point. In 2/2 neoplasia cases, the temporal lobe cortical temperature was more homogeneous than in the CD cases, with no radial heating pattern, and there were no IZ detected. In case 8, we found the coldest IrTM recording in the hippocampus, which correlated to the maximal irritative activity recorded by strip electrodes. The ΔT is inversely proportional to epilepsy chronicity.
Conclusion: IrTM could be useful in detecting hypothermic IZ in CD cases. As the ΔT is inversely proportional to epilepsy chronicity, this variable could affect the metabolic thermic patterns of the human brain.
Keywords: Cortical dysplasia; Electrocorticography; Epilepsy surgery; Functional mapping; Hypothermic irritative zone; Infrared thermography brain mapping; Refractory epilepsy; Thermography patterns.
Copyright: © 2020 Surgical Neurology International.
Conflict of interest statement
There are no conflicts of interest.
Figures


References
-
- Ecker RD, Goerss SJ, Meyer FB, Cohen-Gadol AA, Britton JW, Levine JA. Vision of the future: Initial experience with intraoperative real-time high-resolution dynamic infrared imaging. Technical note. J Neurosurg. 2002;97:1460–71. - PubMed
-
- Elkins KC, Moncayo VM, Kim H, Olson LD. Utility of gray-matter segmentation of ictal-interictal perfusion SPECT and interictal 18F-FDG-PET in medically refractory epilepsy. Epilepsy Res. 2017;130:93–100. - PubMed
-
- Hoffmann N, Weidner F, Urban P, Meyer T, Schnabel C, Radev Y, et al. Framework for 2D-3D image fusion of infrared thermography with preoperative MRI. Biomed Tech (Berl) 2017;62:599–607. - PubMed
-
- Kateb B, Yamamoto V, Yu C, Grundfest W, Gruen JP. Infrared thermal imaging: A review of the literature and case report. Neuroimage. 2009;47(Suppl 2):T154–62. - PubMed
LinkOut - more resources
Full Text Sources
Research Materials