Review
. 2020 Apr 1;9(4):409-430.
doi: 10.1002/open.201900363. eCollection 2020 Apr.

Functional Systems Derived from Nucleobase Self-assembly

Affiliations
Review

Functional Systems Derived from Nucleobase Self-assembly

Anselmo Del Prado et al. ChemistryOpen. .

Abstract

Dynamic and reversible non-covalent interactions endow synthetic systems and materials with smart adaptive functions that allow them to response to diverse stimuli, interact with external agents, or repair structural defects. Inspired by the outstanding performance and selectivity of DNA in living systems, scientists are increasingly employing Watson-Crick nucleobase pairing to control the structure and properties of self-assembled materials. Two sets of complementary purine-pyrimidine pairs (guanine:cytosine and adenine:thymine(uracil)) are available that provide selective and directional H-bonding interactions, present multiple metal-coordination sites, and exhibit rich redox chemistry. In this review, we highlight several recent examples that profit from these features and employ nucleobase interactions in functional systems and materials, covering the fields of energy/electron transfer, charge transport, adaptive nanoparticles, porous materials, macromolecule self-assembly, or polymeric materials with adhesive or self-healing ability.

Keywords: functional materials; hydrogen bonding; nucleobases; self-assembly; supramolecular chemistry.


Conflict of interest statement

The authors declare no conflict of interest.

Figures

Figure 1
Figure 1
Natural Adenine (A), Uracil (U), Guanine (G) and Cytosine (C), nucleobases and their complementary Watson−Crick pairs. Dashed bonds indicate donor (D; blue) and acceptor (A; red) H‐bonding sites, which may also establish favorable or unfavorable secondary interactions.
Figure 2
Figure 2
Association of guanine/guanosine molecules into ribbon oligomers or cyclic G‐quartets, which can stack in the presence of cations into G‐quadruplexes of diverse sizes.
Figure 3
Figure 3
Common coordination modes/sites (highlighted with arrows) of purine and pyrimidine nucleobases.
Figure 4
Figure 4
HOMO/LUMO energy levels (E(vac)) of nucleobases relative to the vacuum level, values taken from Ref. [14a]. Similar but different values in [14b,c] have been reported from different measurements. Electrochemical potential E(SHE)=−E(vac) – 4.44. Adapted from Ref. [13b] with permission. Copyright (2015) Wiley‐VCH.
Figure 5
Figure 5
G : C‐mediated excited energy transfer in a) a dimeric Ru(II) tris(bipyridyl)‐Os(II) tris(bipyridyl) donor‐acceptor system and b) a trimeric system composing two Zn(II) porphyrins (electron donor) and a free‐base porphyrin (acceptor). TBDMS=t‐butyldimethylsilyl.
Figure 6
Figure 6
G : C‐mediated photoinduced electron/hole transfer in a) a Zn(II) porphyrin−fullerene dyad and b) a N,N‐dimethylaniline−anthracene dyad. TBDMS=t‐butyldimethylsilyl.
Figure 7
Figure 7
Photoinduced electron transfer mediated by a) a A : T pair in TTF‐T:A‐pyrene to quench pyrene emission, and b) a purine:U pair in 2‐aminopurine:U‐fullerene to give long‐lived charge‐separated ion pairs.
Figure 8
Figure 8
G‐quadruplex self‐assemblies with the concentric arrangement of electron‐rich G (core) and electron‐poor moieties (PDI or ANI‐NDI, periphery) for independent hole and electron transport. Adapted from Ref. [27] with permission. Copyright (2013 and 2015) American Chemical Society.
Figure 9
Figure 9
a) Self‐assembly of an acylated G derivative on a three‐terminal device, consisting of 2 arrow‐shaped Cr/Au electrodes on a SiO2 substrate and a third Ag back electrode. b) Characteristic drain−source current (I ds) dependence on the voltage (V ds) at discrete gate voltages (VG, values shown in the legends). Adapted from Ref. [32b] with permission. Copyright (2003) American Chemical Society.
Figure 10
Figure 10
a) Conductive intermolecular charge‐transfer complexes between nucleobase and TTF and/or TCNQ derivatives. b) Segregated columnar arrangement of TCNQ.− (red) and CHC+ pair (blue) of (CHC+)(TCNQ.−). c) H‐bond sheet of (CHC+)(TCNQ.−). Green lines indicate H‐bond.
Figure 11
Figure 11
Dinucleotide‐oligothiophene conjugates displaying hole conductivities by space‐charge limited current (SCLC) measurements. B1 and B2=nucleobases; t4=quaterthiophene (left) and t5=quinquethiophene (right).
Figure 12
Figure 12
Ordered π‐stacking of the NDI units of NDI‐A, assisted by the formation of [NDI‐A]10:dT10 assembly, resulting in n‐type conductivity. Conductometric detection of Hg2+ can be made possible due to the disruption of A : T H‐bonding by T‐Hg‐T coordination. Adapted from Ref. [38] with permission. Copyright (2016) American Chemical Society.
Figure 13
Figure 13
a) Formation of porous coordination nanoparticles from nucleotides and lanthanide ions. AMP is shown as an example. The flexible coordination to Ln3+ allows adaptive pore structures that can capture guest molecules of various charge, size and shape. b) Eu3+ emission from the AMP/Eu nanoparticles in the presence or absence of tetracycline (Tc). c) Fluorescence images of perylene‐3,4,9,10‐tetracarboxylate doped AMP/Gd nanoparticles added to HeLa cells (left) or tissues of injected mice (right). Adapted from Ref. [42b and 45] with permission. Copyright (2009 and 2012) American Chemical Society.
Figure 14
Figure 14
a) bio‐MOF‐11–14 consisting of Co2+‐adeninate‐carboxylates “paddle‐wheel” clusters that display high and selective CO2 uptake. Reproduced from Ref. [47a] with permission from The Royal Society of Chemistry. b) Cation‐triggered procainamide release from a Zn2+‐adeninate anionic bio‐MOF‐1. Adapted from Ref. [53] with permission. Copyright (2009) American Chemical Society. c) Exposed H‐bonding N1 and N3 sites of adeninate into the pore space in ZnBTCA MOF for guest binding. Adapted from Ref. [54] with permission. Copyright (2015) Wiley‐VCH.
Figure 15
Figure 15
a) Crystalline G‐quadruplex organic frameworks prepared from linear G‐arene‐G molecules featuring segregated π‐stacks of guanines and arenes for charge‐carrier generation, transport, or storage. b) Photogenerated charge‐carriers of microsecond lifetime in donor−acceptor G‐quadruplex organic frameworks indicated by time‐resolved microwave conductivity (TRMC) measurements. c) G2PDI organic frameworks as the cathode materials in Li‐ion batteries showing high and stable coulombic efficiency over hundreds of recharging cycles.
Figure 16
Figure 16
Mesoporous silica nanotube formation using G‐quadruplex supramolecular structures as the template.
Figure 17
Figure 17
Schematic representation of several topologies in nucleobase‐functionalized a) main‐chain or b) side‐chain polymers obtained either by blending the polymers or by combination with cross‐linkers/nucleobase carriers.
Figure 18
Figure 18
a) Structure of the P(VBA‐co‐DMA) copolymer H‐bonded to the complementary P(VBT‐co‐DMA) copolymer. Temperature‐dependent UV‐vis experiments of the b) 1 : 1 A : T copolymers mixture, and c) the individual copolymers in 1,4‐dioxane at 3×10⁻⁵ M. The changes observed upon increasing the temperature are indicated by arrows. The inset on panel b shows the resulting “melting” curve. Adapted from Ref. [74b] with permission. Copyright (2005) American Chemical Society.
Figure 19
Figure 19
a) Chemical structures of the MAT and the MAA monomers. b) Structure of the “zipper‐like” P(MAT‐b‐MAA) block copolymer.
Figure 20
Figure 20
a) Schematic illustration of the A‐ and T‐terminated POM monomers and the hybrid supramolecular polymer chain formed through complementary H‐bonding between A and T units. b) A SEM image of the polymeric fibers prepared by electrospinning. Reproduced from Ref. [77] with permission from The Royal Society of Chemistry.
Figure 21
Figure 21
a) TEM micrograph highlighting the fiber pitch (scale bar: 500 nm). b) Proposed mechanism of the supramolecular twisted fiber formation from the synthesized α‐aminoisobutyric‐based foldamers. c) Schematic illustration of the spherical aggregates formed from gold nanoparticles by A : T chain extension. d–f) SEM images of the spherical aggregates obtained with gold nanoparticles with different magnification scales. Reproduced from Ref. [78] with permission from The Royal Society of Chemistry.
Figure 22
Figure 22
a) ATRP procedure for the preparation of the PEG‐b‐T and PEG‐b‐A block copolymers. b) Schematic illustration of the self‐assembled complementary PEG‐b‐T and PEG‐b‐A block copolymers. Adapted from Ref. [83] with permission. Copyright (2006) Wiley‐VCH.
Figure 23
Figure 23
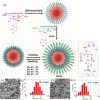
a) Schematic procedure of the preparation of supramolecular micelles from mixed‐corona polymeric nanostructures through a “Grafting To” approach mediated by nucleobase interactions. TEM images and histograms of number‐average diameter distribution of mixed‐corona M4 at (b,c) 20 °C and (d,e) 60 °C. Scale bar: 200 nm. Adapted from Ref. [84c] with permission. Copyright (2017) American Chemical Society.
Figure 24
Figure 24
a) Schematic illustration of the PS‐b‐PVBT/A‐PEO self‐assembly process in DMF. b) Multicompartment micelle structures obtained from the PS‐b‐PVBT/A‐PEO blends, depending on the amount of a cosolvent (H2O:top or MeCN:bottom). Reproduced from Ref. [86] with permission from The Royal Society of Chemistry.
Figure 25
Figure 25
a) Chemical structures of the complementary PCL‐A and PEG‐U block copolymers. b) Size distribution of the self‐assembled micelles obtained from the PCL‐A/PEG‐U mixture determined by DLS, and their corresponding TEM images. c) Scheme of the encapsulation‐release process of DOX by the PCL‐A/PEG‐U entities in water. Adapted from Ref. [90] with permission. Copyright (2011) American Chemical Society.
Figure 26
Figure 26
Illustration of the cross‐linked micelles formed by complementary A : U H‐bonding within the U‐PCL/BA‐PEG copolymer. Reprinted from Ref. [91] with permission. Copyright (2016) Wiley‐VCH.
Figure 27
Figure 27
a) Scheme of the preparation of the H‐bonded H40PCL‐A/PEG‐U multiarm‐grafted copolymer micelles. TEM micrographs of the micelles obtained varying the A/U components molar ratio: b) 1 : 1, c) 1 : 0.8, d) 1 : 0.6, and e) 1 : 0.4. Reproduced from Ref. [99a] with permission from The Royal Society of Chemistry.
Figure 28
Figure 28
a) Schematic illustration of the A : U‐based PHEMA‐g‐PCL‐A/PEG‐U polymer network in water, and its self‐assembly into micelles. b) TEM image of the generated micelles (scale bar=200 nm). Reproduced from Ref. [99b] with permission from The Royal Society of Chemistry.
Figure 29
Figure 29
a) H‐bonded PS‐b‐PVBT block copolymer with the A‐C16 derivative. b) SAXS patterns of the PS‐b‐PVBT/A‐C16 blends at different ratios. c) TEM images of the self‐segregated material obtained from the PS‐b‐PVBT/A‐C16 1:0.5 blend, stained with I2/OsO4 (top) and I2 (bottom). d) Representation of the lamellar structures of the PS‐b‐PVBT block copolymer and the blend. Reproduced from Ref. [102] with permission from The Royal Society of Chemistry.
Figure 30
Figure 30
a) Structures of the acrylic A‐ and T‐functionalized Ac‐A and Ac‐T monomers, and the obtained P(Ac‐A‐b‐nBAc‐b‐Ac‐A) and P(Ac‐T‐b‐nBAc‐b‐Ac‐T) triblock copolymers. b) Graphic illustration of the supramolecular H‐bonded complementary triblock copolymers blend. Reproduced from Ref. [104a] ‐ Published by The Royal Society of Chemistry.
Figure 31
Figure 31
a) Polymer film prepared from POSS‐U/PCL‐A blends. b) Polymeric films prepared from 40 : 60 mixtures of the multifunctional POSS‐T and POSS‐A. Reproduced from Ref. [107a–b] with permission from The Royal Society of Chemistry.
Figure 32
Figure 32
(a) Cartoon of the cross‐linked hydrogel network, and its adhesion to a substrate driven by nucleobase interactions. (b) Synthesis of polyphosphoester‐based hydrogels tackified by nucleobase pairing. c–e) Pictures of the adhered hydrogels to c) plastic, d) glass, and e) fresh live organ of rats. Adapted from Ref. [112] with permission. Copyright (2019) American Chemical Society.
Figure 33
Figure 33
a) Chemical structures of the A‐ and T‐functionalized telechelic PEG polymers. b) Pictures of the A‐PEG10K‐A/T‐PEG10K‐T/α‐CD aqueous solution (PEG/α‐CD 10 : 10 weight%) and the hydrogel obtained with time. c) Representation of the gelation process in the mixture of components. Reproduced from Ref. [113] with permission from The Royal Society of Chemistry.

References

    1. None
    1. Steiner T., Angew. Chem. Int. Ed. 2002, 41, 48–76; - PubMed
    2. Angew. Chem. 2002, 114, 50–80;
    1. Prins L. J., Reinhoudt D. N., Timmerman P., Angew. Chem. Int. Ed. 2001, 40, 2382–2426; - PubMed
    2. Angew. Chem. 2001, 113, 2446–2492;
    1. Li Z.-T., Wu L.-Z., Hydrogen bonded supramolecular structures, Springer, Berlin, 2015;
    1. Gonzalez-Rodriguez D., Schenning A. P. H. J., Chem. Mater. 2011, 23, 310–325.

Publication types

LinkOut - more resources