

Mtrr hypomorphic mutation alters liver morphology, metabolism and fuel storage in mice
- PMID: 32257815
- PMCID: PMC7109458
- DOI: 10.1016/j.ymgmr.2020.100580
Mtrr hypomorphic mutation alters liver morphology, metabolism and fuel storage in mice
Abstract
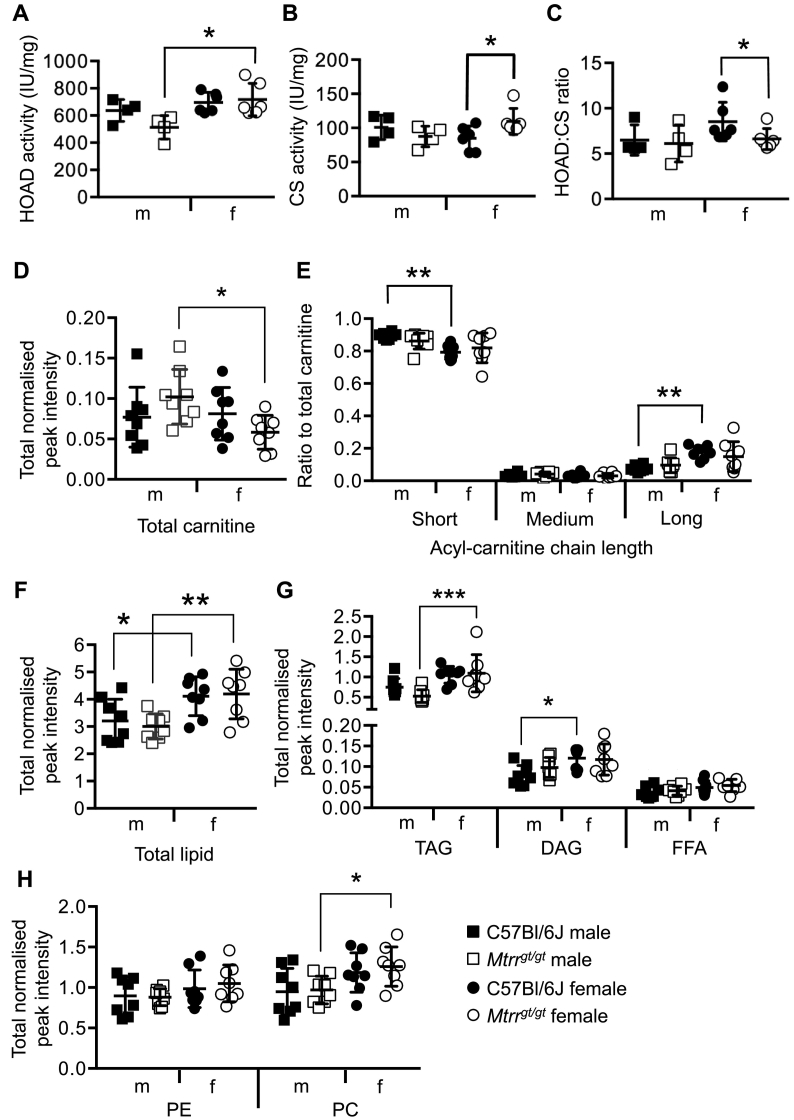
Nonalcoholic fatty liver disease (NAFLD) is associated with dietary folate deficiency and mutations in genes required for one‑carbon metabolism. However, the mechanism through which this occurs is unclear. To improve our understanding of this link, we investigated liver morphology, metabolism and fuel storage in adult mice with a hypomorphic mutation in the gene methionine synthase reductase (Mtrr gt ). MTRR enzyme is a key regulator of the methionine and folate cycles. The Mtrr gt mutation in mice was previously shown to disrupt one‑carbon metabolism and cause a wide-spectrum of developmental phenotypes and late adult-onset macrocytic anaemia. Here, we showed that livers of Mtrr gt/gt female mice were enlarged compared to control C57Bl/6J livers. Histological analysis of these livers revealed eosinophilic hepatocytes with decreased glycogen content, which was associated with down-regulation of genes involved in glycogen synthesis (e.g., Ugp2 and Gsk3a genes). While female Mtrr gt/gt livers showed evidence of reduced β-oxidation of fatty acids, there were no other associated changes in the lipidome in female or male Mtrr gt/gt livers compared with controls. Defects in glycogen storage and lipid metabolism often associate with disruption of mitochondrial electron transfer system activity. However, defects in mitochondrial function were not detected in Mtrr gt/gt livers as determined by high-resolution respirometry analysis. Overall, we demonstrated that adult Mtrr gt/gt female mice showed abnormal liver morphology that differed from the NAFLD phenotype and that was accompanied by subtle changes in their hepatic metabolism and fuel storage.
Keywords: 5-methyl-THF, 5-methyltetrahydofolate; Agl, amylo-alpha-1,6-glucosidase,4-alpha-glucanotransferase gene; BCA, bicinchoninic acid; Bhmt, betaine-homocysteine S-methyltransferase gene; CE, cholesteryl-ester; Cebpa, CCAAT/enhancer binding protein (C/EBP), alpha gene; Cer, ceramide; DAG, diacylglycerol; Ddit3, DNA damage inducible transcript 3 gene; ETS, electron transport system; FCCP, p-trifluoromethoxyphenyl hydrazine; FFA, free fatty acid; G6pc, glucose 6-phophastase gene; Gbe1, glycogen branching enzyme 1 gene; Glycogen; Gsk3, glycogen synthase kinase gene; Gyg, glycogenin gene; Gys2, glycogen synthase 2 gene; HOAD, 3-hydoxyacyl-CoA dehydrogenase; Hepatic fuel storage; Isca1, iron‑sulfur cluster assembly 1 gene; JO2, oxygen flux; LC-MS, liquid chromatography-mass spectrometry; LPC, lysophosphatidylcholine; Lipidomics; Liver metabolism; Mitochondrial function; Mthfr, methylenetetrahydrofolate reductase gene; Mtr, methionine synthase gene (also MS); Mtrr, methionine synthase reductase gene (also MSR); Myc, myelocytomatosis oncogene; NAFLD, non-alcoholic fatty liver disease; NASH, non-alcoholic steatohepatitis; Ndufs, NADH:ubiquinone oxidoreductase core subunit (ETS complex I) gene; OXPHOS, oxidative phosphorylation; One‑carbon metabolism; PA, phosphatidic acid; PAS, periodic acid Schiff; PC, phosphatidylcholine; PE, phosphatidylethanolamine; PG, phosphatidylglycerol; PI, phosphatidylinositol; PIP, phosphatidylinositol phosphate(s); PL, phospholipid; PS, phosphatidylserine; RIPA, Radioimmunoprecipitation assay; SAH, S-adenosylhomocysteine; SAM, S-adenosylmethionine; SM, sphingomyelin; TAG, triacylglycerol; Ugp2, UDP-glucose pyrophophorylase 2 gene; gt, gene-trap.
© 2020 The Authors.
Figures


Similar articles
-
Abnormal folate metabolism causes age-, sex- and parent-of-origin-specific haematological defects in mice.J Physiol. 2018 Sep;596(18):4341-4360. doi: 10.1113/JP276419. Epub 2018 Aug 15. J Physiol. 2018. PMID: 30024025 Free PMC article.
-
Methyl-donor supplementation in obese mice prevents the progression of NAFLD, activates AMPK and decreases acyl-carnitine levels.Mol Metab. 2014 May 20;3(5):565-80. doi: 10.1016/j.molmet.2014.04.010. eCollection 2014 Aug. Mol Metab. 2014. PMID: 25061561 Free PMC article.
-
A human liver chimeric mouse model for non-alcoholic fatty liver disease.JHEP Rep. 2021 Mar 21;3(3):100281. doi: 10.1016/j.jhepr.2021.100281. eCollection 2021 Jun. JHEP Rep. 2021. PMID: 34036256 Free PMC article.
-
Pleiotropic effects of methionine adenosyltransferases deregulation as determinants of liver cancer progression and prognosis.J Hepatol. 2013 Oct;59(4):830-41. doi: 10.1016/j.jhep.2013.04.031. Epub 2013 May 7. J Hepatol. 2013. PMID: 23665184 Review.
-
Nonalcoholic Fatty Liver Disease and Staging of Hepatic Fibrosis.Adv Exp Med Biol. 2024;1460:539-574. doi: 10.1007/978-3-031-63657-8_18. Adv Exp Med Biol. 2024. PMID: 39287864 Review.
Cited by
-
Indigenous people from Amazon show genetic signatures of pathogen-driven selection.Sci Adv. 2023 Mar 10;9(10):eabo0234. doi: 10.1126/sciadv.abo0234. Epub 2023 Mar 8. Sci Adv. 2023. PMID: 36888716 Free PMC article.
-
Enhanced hepatic respiratory capacity and altered lipid metabolism support metabolic homeostasis during short-term hypoxic stress.BMC Biol. 2021 Dec 15;19(1):265. doi: 10.1186/s12915-021-01192-0. BMC Biol. 2021. PMID: 34911556 Free PMC article.
-
Single-nucleotide polymorphisms in genes involved in folate metabolism or selected other metabolites and risk for gestational diabetes mellitus.World J Diabetes. 2025 May 15;16(5):103602. doi: 10.4239/wjd.v16.i5.103602. World J Diabetes. 2025. PMID: 40487628 Free PMC article.
-
MYCT1 alters the glycogen shunt by regulating selective translation of RACK1-mediated enzymes.iScience. 2022 Feb 22;25(3):103955. doi: 10.1016/j.isci.2022.103955. eCollection 2022 Mar 18. iScience. 2022. PMID: 35281731 Free PMC article.
-
Chronic inorganic nitrate supplementation does not improve metabolic health and worsens disease progression in mice with diet-induced obesity.Am J Physiol Endocrinol Metab. 2025 Jan 1;328(1):E69-E91. doi: 10.1152/ajpendo.00256.2024. Epub 2024 Dec 9. Am J Physiol Endocrinol Metab. 2025. PMID: 39653040 Free PMC article.
References
-
- S.C. Lu, L. Alvarez, Z.Z. Huang, L. Chen, W. An, F.J. Corrales, M.A. Avila, G. Kanel, J.M. Mato, Methionine adenosyltransferase 1A knockout mice are predisposed to liver injury and exhibit increased expression of genes involved in proliferation Proc Natl Acad Sci U S A 98 (2001) 5560–5565. - PMC - PubMed
-
- Martinez-Chantar M.L., Vazquez-Chantada M., Ariz U., Martinez N., Varela M., Luka Z., Capdevila A., Rodriguez J., Aransay A.M., Matthiesen R., Yang H., Calvisi D.F., Esteller M., Fraga M., Lu S.C., Wagner C. J.M. Mato. Loss of the glycine N-methyltransferase gene leads to steatosis and hepatocellular carcinoma in mice Hepatology. 2008;47:1191–1199. - PMC - PubMed
-
- Liu S.P., Li Y.S., Chen Y.J., Chiang E.P., Li A.F., Lee Y.H., Tsai T.F., Hsiao M., Huang S.F. Y.M. Chen. Glycine N-Methyltransferase−/− Mice Develop Chronic Hepatitis and Glycogen Storage Disease in the Liver Hepatology. 2007;46:1413–1425. - PubMed
Grants and funding
LinkOut - more resources
Full Text Sources
Molecular Biology Databases
Research Materials
Miscellaneous
