. 2020 Mar 17:8:148.
doi: 10.3389/fcell.2020.00148. eCollection 2020.

Distinct Roles of TRAPPC8 and TRAPPC12 in Ciliogenesis via Their Interactions With OFD1

Affiliations

Distinct Roles of TRAPPC8 and TRAPPC12 in Ciliogenesis via Their Interactions With OFD1

Caiyun Zhang et al. Front Cell Dev Biol. .

Abstract

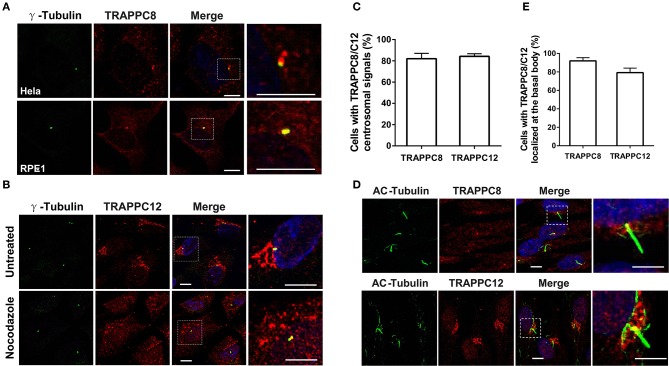
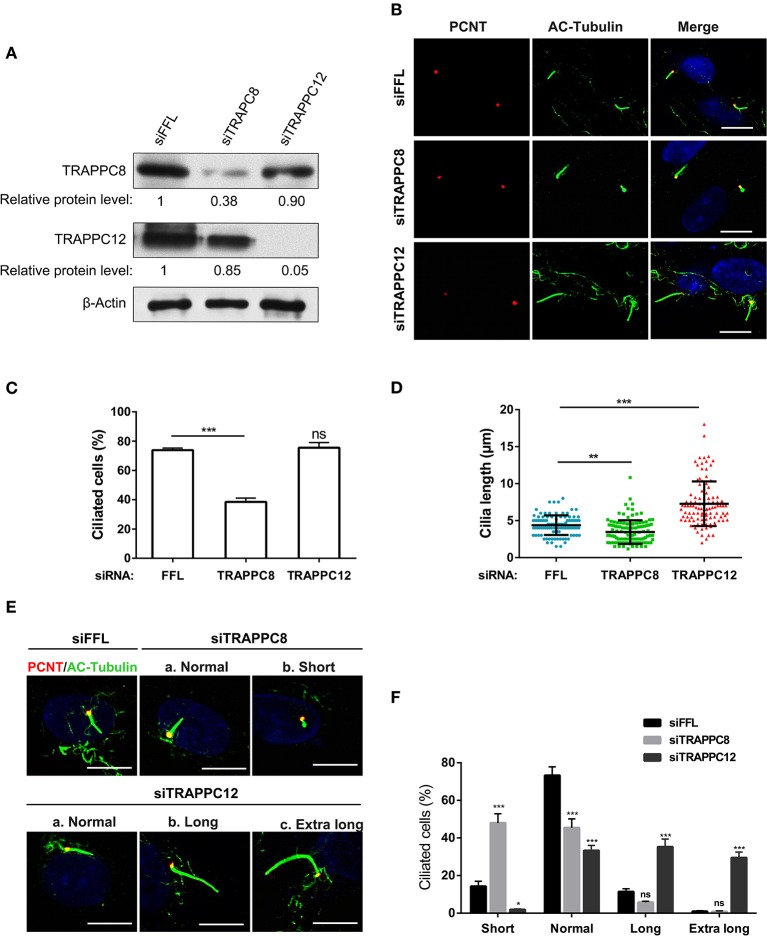
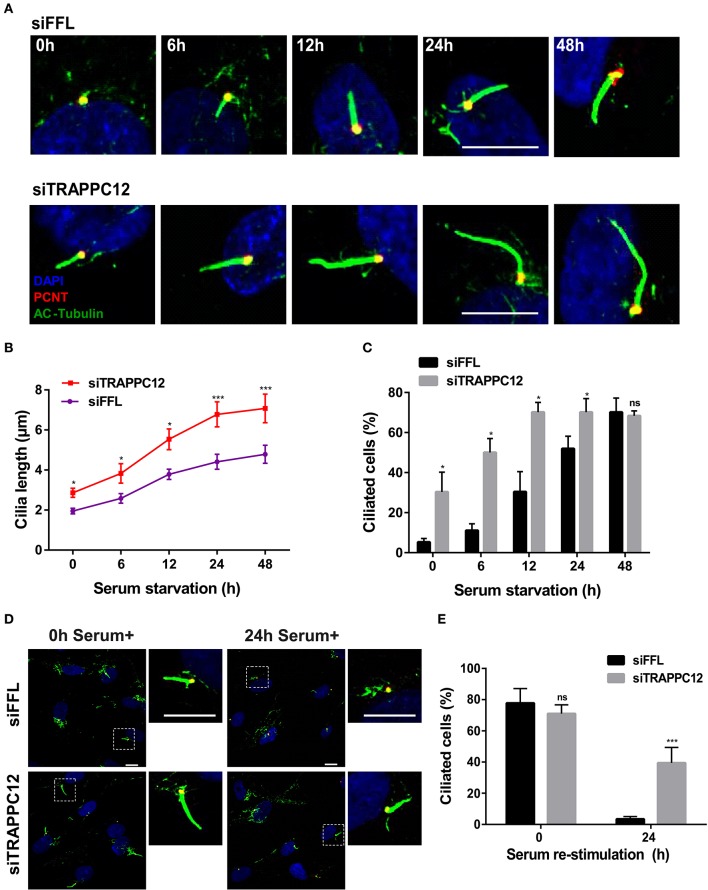
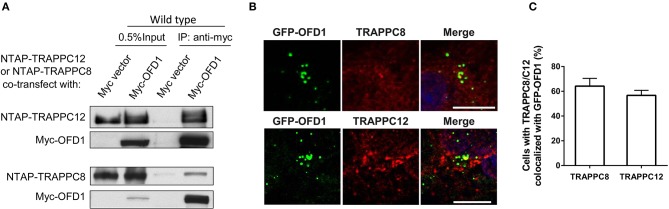
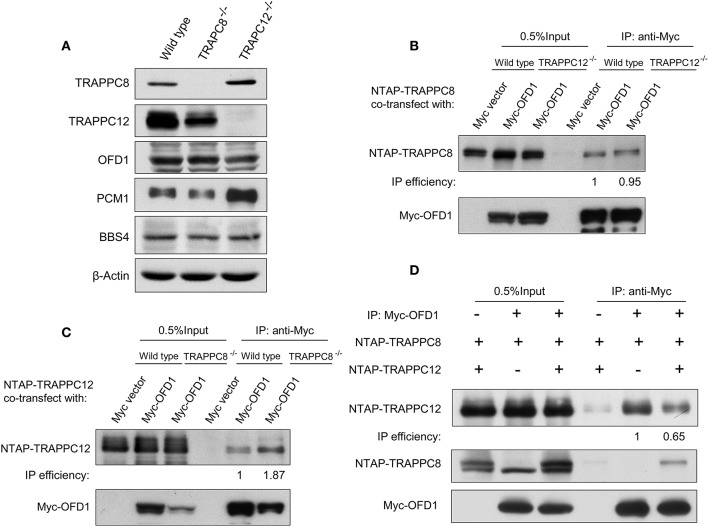
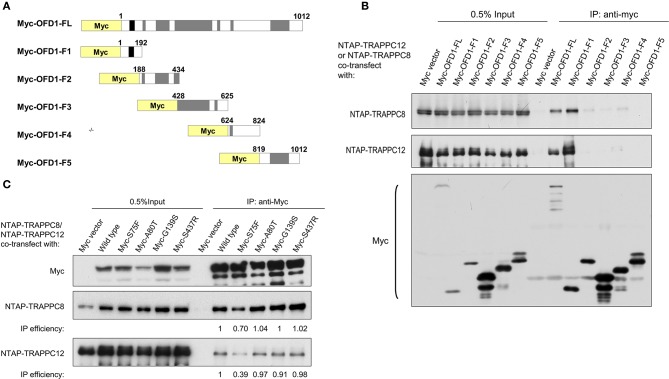
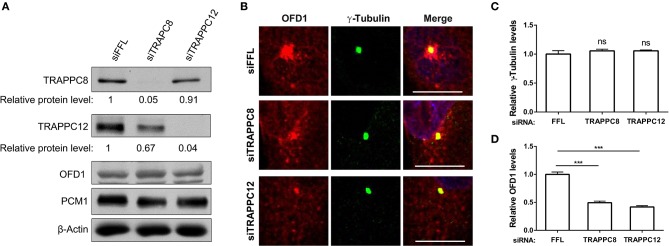
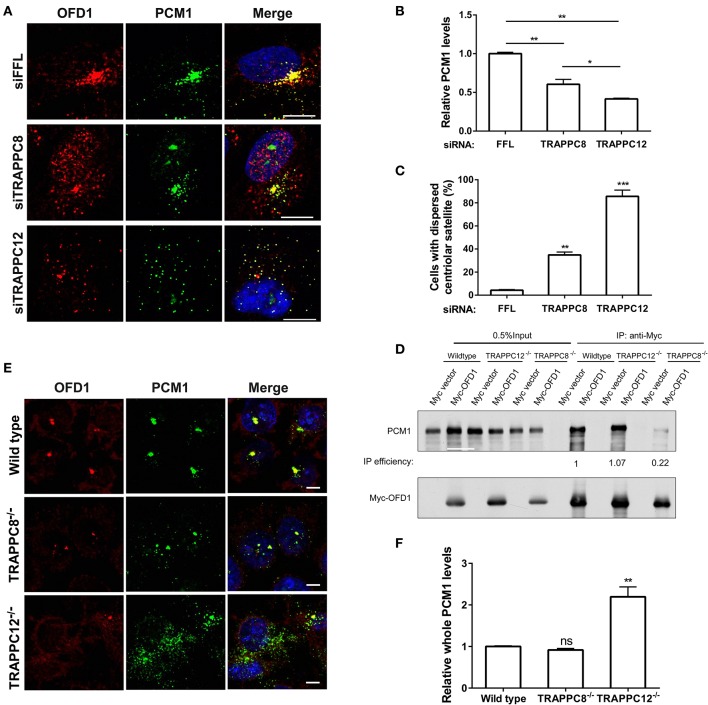
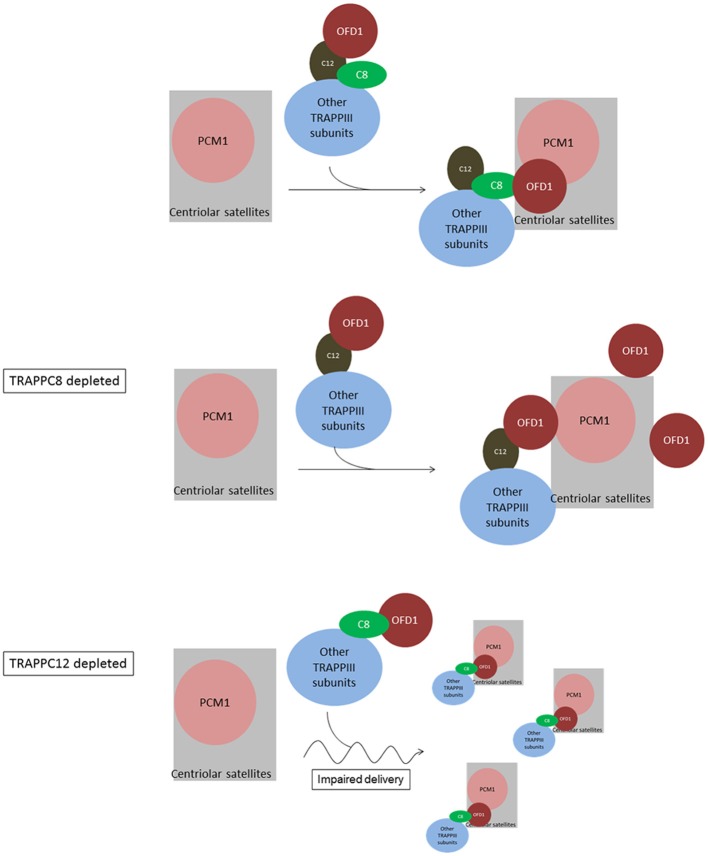
The transport protein particle (TRAPP) complex was initially identified as a tethering factor for COPII vesicle. Subsequently, three forms (TRAPPI, II, and III) have been found and TRAPPIII has been reported to serve as a regulator in autophagy. This study investigates a new role of mammalian TRAPPIII in ciliogenesis. We found a ciliopathy protein, oral-facial-digital syndrome 1 (OFD1), interacting with the TRAPPIII-specific subunits TRAPPC8 and TRAPPC12. TRAPPC8 is necessary for the association of OFD1 with pericentriolar material 1 (PCM1). Its depletion reduces the extent of colocalized signals between OFD1 and PCM1, but does not compromise the structural integrity of centriolar satellites. The interaction between TRAPPC8 and OFD1 inhibits that between OFD1 and TRAPPC12, suggesting different roles of TRAPPIII-specific subunits in ciliogenesis and explaining the differences in cilium lengths in TRAPPC8-depleted and TRAPPC12-depleted hTERT-RPE1 cells. On the other hand, TRAPPC12 depletion causes increased ciliary length because TRAPPC12 is required for the disassembly of primary cilia. Overall, this study has revealed different roles of TRAPPC8 and TRAPPC12 in the assembly of centriolar satellites and demonstrated a possible tethering role of TRAPPIII during ciliogenesis.

Keywords: OFD1; TRAPPC12; TRAPPC8; centriolar satellite; primary cilium.


Figures

Figure 1
Figure 1
TRAPPC8 and TRAPPC12 are localized to basal bodies and centrosomes. (A) TRAPPC8 was co-localized with centrosome marker γ-tubulin in Hela and hTERT-RPE1 cells. (B) TRAPPC12 was co-localized with γ-tubulin in hTERT-RPE1 cells that were prior treated with or without nocodazole for 1 h. (C) Quantifications of data shown in (A,B). Percentage of cells with TRAPPC8 or TRAPPC12 centrosomal signals were scored TRAPPC8, n = 82; TRAPPC12, n = 72. Mean ± SEM. (D) TRAPPC8 and TRAPPC12 were stained with axoneme marker acetylated α-Tubulin (AC-tubulin) in hTERT-RPE1 cells after the cells were induced to form cilia with serum starvation for 24 h. observe (E) Percentage of cells with TRAPPC8 or TRAPPC12 signals localized at the basal body. TRAPPC8, n = 108; TRAPPC12, n = 96. Mean ± SEM. Scale bar, 10 μm. Similar results were observed in three independent experiments.
Figure 2
Figure 2
TRAPPC8 and TRAPPC12 depletions change ciliary length. (A) hTERT-RPE1 cells were transfected with control (siFFL), TRAPPC8 siRNA (siTRAPPC8) or TRAPPC12 siRNA (siTRAPPC12) for 72 h. FFL siRNA targets the firefly luciferase gene sequence, which is not present in human genome, and therefore, serves as non-targeting siRNA control. The expression level of the indicated proteins was analyzed from whole cell lysates by immunoblotting using antibodies against TRAPPC8, and TRAPPC12. β-Actin served as a loading control. (B) hTERT-RPE1 cells depleted TRAPPC8 or TRAPPC12 were induced with primary cilum formation. The approximate positions of the centrosome were indicated by PCNT (pericentrin) staining and primary cilia were indicated by AC-tubulin. (C,D) Percentage of cells with primary cilia and quantification of ciliary length in ciliated cells. Cilium length was measure by imageJ software and based on the scale bar length at 10 μm to set measurement scale. siFFL, n = 105; siTRAPPC8, n = 121; siTRAPPC12, n = 105. Mean ± SEM, *p < 0.05;**p < 0.01; ***p < 0.001, no matching or pairing one-way ANOVA. (E) TRAPPC8 depletion caused short primary cilia, while TRAPPC12 depletion caused aberrantly long primary cilia. (F) Percentage of cells with short cilia (0–3 μm); with normal cilia (3–6 μm); with long cilia (6–8 μm); with extra long cilia (>8 μm). siFFL, n = 168; siTRAPPC8, n = 185; siTRAPPC12, n = 165. no matching or pairing one-way ANOVA. Similar results were observed in three independent experiments.
Figure 3
Figure 3
TRAPPC12 regulates cilia disassembly. (A) Time course of ciliogenesis induced by serum starvation. siFFL and siTRAPPC12 transfected hTERT-RPE1 cells were serum starved at the five indicated time points. (B,C) Statistical quantifcations of cilia length. Number of cilia measured at 0 h: siFFL, n = 13; siTRAPPC12, n = 27; 6 h: siFFL, n = 17; siTRAPPC12, n = 40; 12 h: siFFL, n = 46; siTRAPPC12, n = 58; 24 h: siFFL, n = 100; siTRAPPC12, n = 120; 48 h: siFFL, n = 100; siTRAPPC12, n = 100. Mean ± SEM for average ciliary length, ***p < 0.001; Mean ± SD for ciliated cells, *p < 0.05, two tailed unpaired T-test for two groups of each time point. (D) siFFL and siTRAPPC12 hTERT-RPE1 cells were serum starved for 48 h (0 h serum+) and re-simulated by serum (10%) for 24 h (24 h serum+). (E) Quantification of ciliated cells with mean ± SD, ***p < 0.001; two tailed unpaired T-test for two groups of each time point. Scale bar, 10 μm. Similar results were observed in three independent experiments.
Figure 4
Figure 4
TRAPPIII interacts with OFD1. (A) Myc-tagged OFD1 (Myc-OFD1) and NTAP-tagged TRAPPC8 (NTAP-TRAPPC8) or TRAPPC12 (NTAP-TRAPPC12) were co-transfected into the HEK293T cells, and then cell lysates were subjected to immunoprecipitation with an anti-Myc antibody. Approximately 30% of immunoprecipitants were loaded on SDS PAGE (B) hTERT-RPE1 cells were transfected with GFP-tagged OFD1 and stained for TRAPPC8 and TRAPPC12 with antibodies to determine the colocalization of TRAPPC8 or TRAPPC12 and OFD1. (C) Percentage of cells with TRAPPC8 or TRAPPC12 colocalized with GFP-OFD1. TRAPPC8, n = 34; TRAPPC12, n = 38. Mean ± SEM. Scale bar, 10 μm. Similar results were observed in three independent experiments.
Figure 5
Figure 5
TRAPPC8 binds OFD1 and inhibits TRAPPC12-OFD1 interactions. (A) Immunoblotting analysis of TRAPPC8, TRAPPC12, OFD1, PCM1, and BBS4 proteins in wildtype control, TRAPPC8- or TRAPPC12-deleted HEK293T cells. β-Actin served as a loading control. (B) The interaction between Myc-tagged OFD1 (Myc-OFD1) and NTAP-tagged TRAPPC8 (NTAP-TRAPPC8) were determined in the wild type or TRAPPC12−/− HEK293T cells by co-IP experiment. Approximately 30% of immunoprecipitants were loaded for analysis. (C) The interaction between Myc-tagged OFD1 (Myc-OFD1) and NTAP-tagged TRAPPC12 (NTAP-TRAPPC12) were determined in the wild type or TRAPPC8−/− HEK293T cells by co-IP experiment. Approximately 30% of immunoprecipitants were loaded for analysis. (D) NTAP-TRAPPC8 and NTAP-TRAPPC12 were co-expressed with Myc-OFD1 to allow competition of binding. Co-IP experiment was performed to pull down Myc-OFD1 and the extent of binding by TRAPPC8 or TRAPPC12 was investigated by immunoblotting. IP efficiency is calculated as the ratio of co-immunoprecipitated OFD1 proteins in TRAPPC8 and TRAPPC12 IP samples. Similar results were observed in three independent experiments.
Figure 6
Figure 6
TRAPPIII interacts with the LisH domain of OFD1. (A) Schematic diagram of the indicated full-length OFD1 (FL) and its truncation constructs. The LisH (black), Coiled-coil (grey) and the numbers of amino acid residues in each constructs are indicated. (B) Lysates from HEK293T cells co-transfected with various OFD1 deletion constructs and NTAP-TRAPPC8 or NTAP-TRAPPC12 were subjected to immunoprecipitation and immunoblotted for Myc and TRAPPC8 and TRAPPC12. (C) OFD1 mutant S75F reduces the interaction with TRAPPC8 and TRAPPC12. The indicated OFD1 mutants were co-expressed with TRAPPC8 or TRAPPC12 and the strength of their interactions were determined by co-IP experiment. IP efficiency is calculated as the ratio of immunoprecipitated TRAPPC8/OFD1 or TRAPPC12/OFD1. Similar results were observed in three independent experiments.
Figure 7
Figure 7
TRAPPIII depletion reduces the amount of OFD1 at centriolar satellites. (A) The efficiency of depletion for TRAPPC8 and TRAPPC12. The expression level of the indicated proteins was analyzed from whole cell lysates by immunoblotting using antibodies against TRAPPC8, TRAPPC12, OFD1, and PCM1. β-Actin served as a loading control. (B) Depletion of TRAPPC8 or TRAPPC12 reduced OFD1 puncta. Endogenous OFD1 and the centrosome were detected with OFD1 antibody and the centrosome marker γ-Tubulin in hTERT-RPE1 cells. (C) Quantitative analysis of γ-Tubulin puncta. (D) Quantitative analysis of OFD1 puncta was carried out by measuring the intensities of fluorescence in a 4 μm2 circular area around the centrosome by imageJ. siFFL, n = 100; siTRAPPC8, n = 100; siTRAPPC12, n = 80. Mean ± SEM, ***p < 0.001, no matching or pairing one-way ANOVA. Scale bar, 10 μm. Similar results were observed in three independent experiments.
Figure 8
Figure 8
TRAPPIII regulates the assembly of centriolar satellites. (A) Depletion of TRAPPC8 reduced the PCM1 signals and colocalization with OFD1 and depletion of TRAPPC12 dispersed PCM1 signals in hTERT-RPE1 cells. Enhanced the exposure for OFD1 and PCM1 signals in hTERT-RPE1 cells with the depletion of TRAPPC8 or TRAPPC12. (B,C) Quantitative analysis of PCM1 puncta and percentage of cells with dispersed centriolar satellites. The intensities of fluorescence were measured in the 8 μm2 circular area around the centrosome by image J. siFFL, n = 50; siTRAPPC8, n = 48; siTRAPPC12, n = 50. Mean ± SEM, *p < 0.05; **p < 0.01; ***p < 0.001, no matching or pairing one-way ANOVA. (D) Myc-OFD1 was transfected in HEK293T wild type, TRAPPC12−/−, and TRAPPC8−/− cells, and co-IP was performed with an anti-Myc antibody and the presence of endogenous PCM1 in the immunoprecipitants were detected by western blotting with anti-PCM1 antibody. IP efficiency is calculated as the ratio of immunoprecipitated PCM1/OFD1. (E) hTRAPPC12 knockout (TRAPPC12−/−) dispersed PCM1 signals in 293T cells. (F) Quantitative analysis of endogenous PCM1 puncta, the intensities of fluorescence were measured in whole cell by image J. Wild type, n = 40; TRAPPC8−/−, n = 48; TRAPPC12−/−, n = 50. Mean ± SEM, **p < 0.01, no matching or pairing one-way ANOVA. Scale bar, 10 μm. Similar results were observed in three independent experiments.
Figure 9
Figure 9
Summary and working model of how TRAPPIII functions in the assembly of centriolar satellites and ciliogenesis. We hypothesize sequential interactions between OFD1 and TRAPPC12 and TRAPPC8. TRAPPC12 serves a chaperonin-like function and binds to OFD1, but this interaction is out-competed by TRAPPC8 within the TRAPPIII complex. TRAPPC8 has the ability to properly position OFD1 to the centriolar satellites so that OFD1 can interact with PCM1. In TRAPPC8 depleted cells, the TRAPPIII complex without TRAPPC8 is able to bind to OFD1 via TRAPPC12, but positioning of OFD1 to the centriolar satellites, and hence the interaction with PCM1, is defective. On the other hand, OFD1 positioning to the centriolar satellites is intact in TRAPPC12 depletion. TRAPPC12 also has a function in help delivery of BBS4 or associated cargo proteins to the centriolar satellites. Without TRAPPC12, impaired BBS4/cargo delivery disperses the centriolar satellites.

Similar articles

Cited by

References

    1. Adams N. A., Awadein A., Toma H. S. (2007). The retinal ciliopathies. Ophthalmic Genet. 28, 113–125. 10.1080/13816810701537424 - DOI - PubMed
    1. Balczon R., Bao L., Zimmer W. E. (1994). PCM-1, A 228-kD centrosome autoantigen with a distinct cell cycle distribution. J. Cell Biol. 124, 783–793. 10.1083/jcb.124.5.783 - DOI - PMC - PubMed
    1. Barenz F., Mayilo D., Gruss O. J. (2011). Centriolar satellites: busy orbits around the centrosome. Eur. J. Cell Biol. 90, 983–989. 10.1016/j.ejcb.2011.07.007 - DOI - PubMed
    1. Bassik M. C., Kampmann M., Lebbink R. J., Wang S., Hein M. Y., Poser I., et al. . (2013). A systematic mammalian genetic interaction map reveals pathways underlying ricin susceptibility. Cell 152, 909–922. 10.1016/j.cell.2013.01.030 - DOI - PMC - PubMed
    1. Behrends C., Sowa M. E., Gygi S. P., Harper J. W. (2010). Network organization of the human autophagy system. Nature 466, 68–76. 10.1038/nature09204 - DOI - PMC - PubMed