

Metabolic correlates of prevalent mild cognitive impairment and Alzheimer's disease in adults with Down syndrome
- PMID: 32258359
- PMCID: PMC7131985
- DOI: 10.1002/dad2.12028
Metabolic correlates of prevalent mild cognitive impairment and Alzheimer's disease in adults with Down syndrome
Abstract
Introduction: Disruption of metabolic function is a recognized feature of late onset Alzheimer's disease (LOAD). We sought to determine whether similar metabolic pathways are implicated in adults with Down syndrome (DS) who have increased risk for Alzheimer's disease (AD).
Methods: We examined peripheral blood from 292 participants with DS who completed baseline assessments in the Alzheimer's Biomarkers Consortium-Down Syndrome (ABC-DS) using untargeted mass spectrometry (MS). Our sample included 38 individuals who met consensus criteria for AD (DS-AD), 43 who met criteria for mild cognitive impairment (DS-MCI), and 211 who were cognitively unaffected and stable (CS).
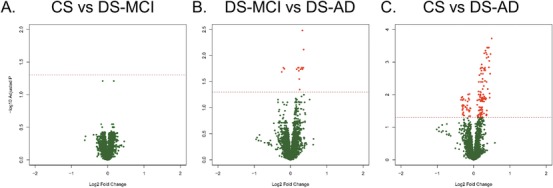
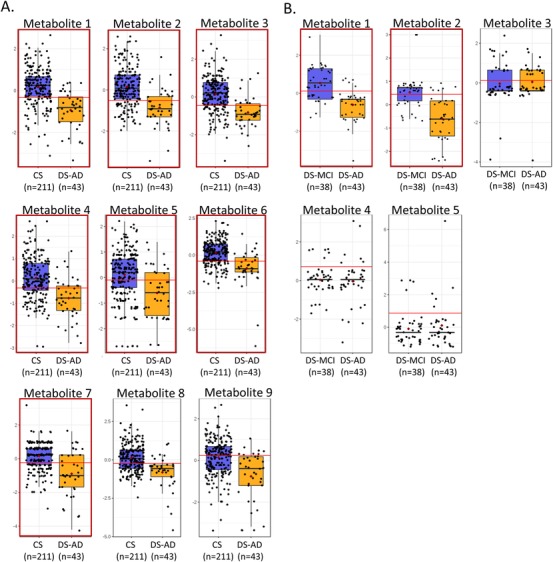
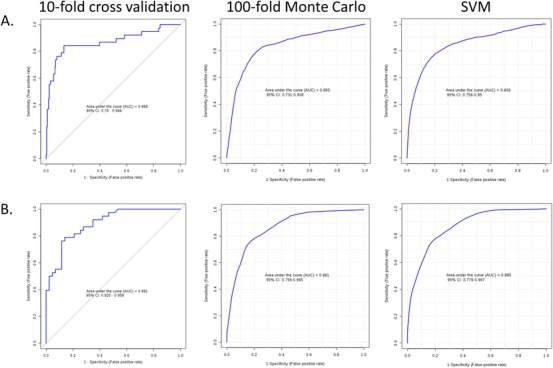
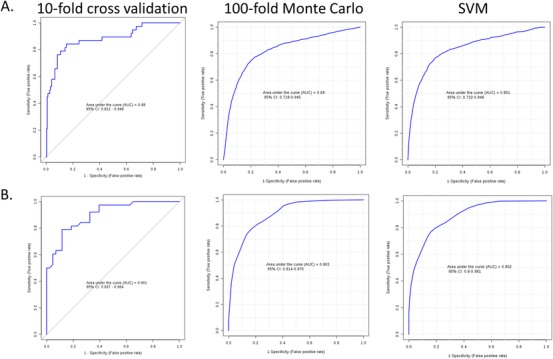
Results: We measured relative abundance of 8,805 features using MS and 180 putative metabolites were differentially expressed (DE) among the groups at false discovery rate-corrected q< 0.05. From the DE features, a nine-feature classifier model classified the CS and DS-AD groups with receiver operating characteristic area under the curve (ROC AUC) of 0.86 and a two-feature model classified the DS-MCI and DS-AD groups with ROC AUC of 0.88. Metabolite set enrichment analysis across the three groups suggested alterations in fatty acid and carbohydrate metabolism.
Discussion: Our results reveal metabolic alterations in DS-AD that are similar to those seen in LOAD. The pattern of results in this cross-sectional DS cohort suggests a dynamic time course of metabolic dysregulation which evolves with clinical progression from non-demented, to MCI, to AD. Metabolomic markers may be useful for staging progression of DS-AD.
Keywords: Alzheimer's disease; Down syndrome; carbohydrate metabolism; energy metabolism; fatty acid metabolism; lipid metabolism; metabolism; metabolomics; mild cognitive impairment.
© 2020 The Authors. Alzheimer's & Dementia: Diagnosis, Assessment & Disease Monitoring published by Wiley Periodicals, Inc. on behalf of the Alzheimer's Association.
Conflict of interest statement
MM and AKC are listed as inventors on issued and pending patents related to material in this manuscript and assigned to Georgetown University. The terms of this arrangement have been reviewed and approved by the University of California, Irvine in accordance with its conflict of interest policies. Remaining authors declare no competing financial interests.
Figures
References
-
- Rumble B, Retallack R, Hilbich C, et al. Amyloid A4 and its precursor in Down's syndrome and Alzheimer's disease. New Engl J Med. 1989;320:1446‐1462. - PubMed
-
- Mann DMA, Esiri MM. The pattern of acquisition of plaques and tangles in the brains of patients under 50 years of age with Down's syndrome. J Neurol Sci. 1989;89:169‐179. - PubMed
-
- Wisniewski K, Howe J, Williams G, Wisniewski HM. Precocious aging and dementia in patients with Down's syndrome. Biol Psychiatry. 1978;13(5):619‐627. - PubMed
-
- Wisniewski K, Wisniewski H, Wen G. Occurrence of neuropathological changes and dementia of Alzheimer's disease in Down's syndrome. Ann Neurol. 1985;17:278‐282. - PubMed
Grants and funding
- P50 AG005681/AG/NIA NIH HHS/United States
- U19 AG068054/AG/NIA NIH HHS/United States
- U54 HD087011/HD/NICHD NIH HHS/United States
- U01 AG051412/AG/NIA NIH HHS/United States
- P50 AG005133/AG/NIA NIH HHS/United States
- UL1 TR001414/TR/NCATS NIH HHS/United States
- UL1 TR002373/TR/NCATS NIH HHS/United States
- P30 AG062715/AG/NIA NIH HHS/United States
- U54 HD090256/HD/NICHD NIH HHS/United States
- UL1 TR002345/TR/NCATS NIH HHS/United States
- UL1 TR001857/TR/NCATS NIH HHS/United States
- U24 AG021886/AG/NIA NIH HHS/United States
- P30 AG062421/AG/NIA NIH HHS/United States
- P50 AG008702/AG/NIA NIH HHS/United States
- U01 AG051406/AG/NIA NIH HHS/United States
- UL1 TR001873/TR/NCATS NIH HHS/United States
LinkOut - more resources
Full Text Sources
Miscellaneous