. 2020 Mar 24:22:100753.
doi: 10.1016/j.bbrep.2020.100753. eCollection 2020 Jul.

Differentially expressed mRNAs and lncRNAs shared between activated human hepatic stellate cells and nash fibrosis

Affiliations

Differentially expressed mRNAs and lncRNAs shared between activated human hepatic stellate cells and nash fibrosis

Glenn S Gerhard et al. Biochem Biophys Rep. .

Abstract

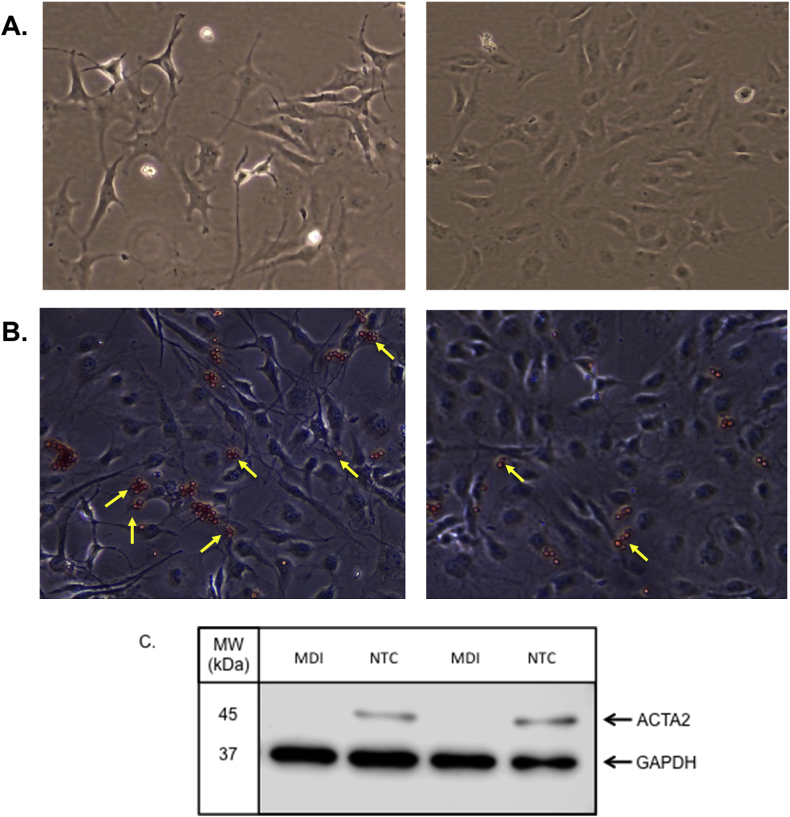
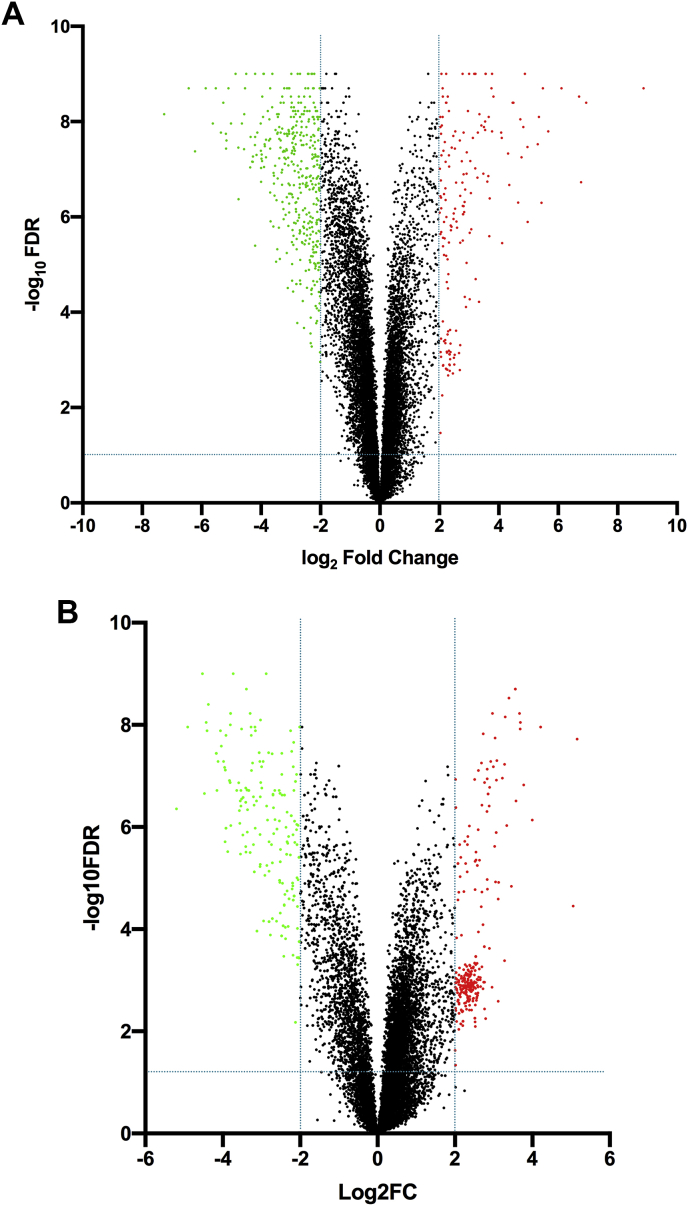
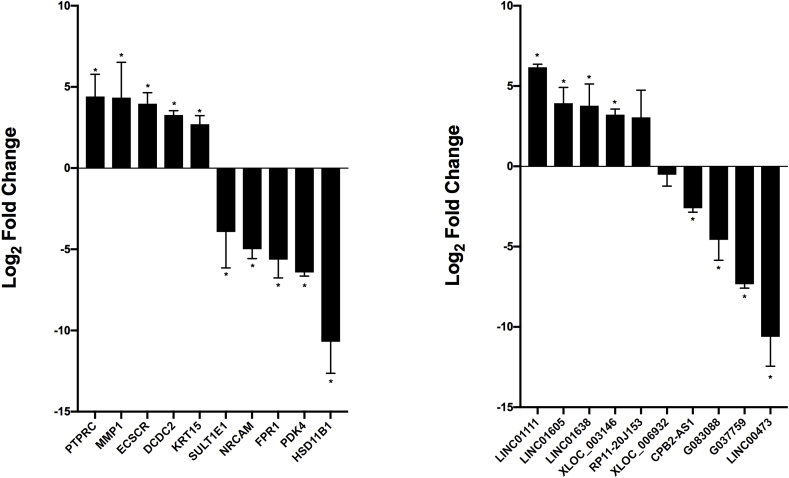
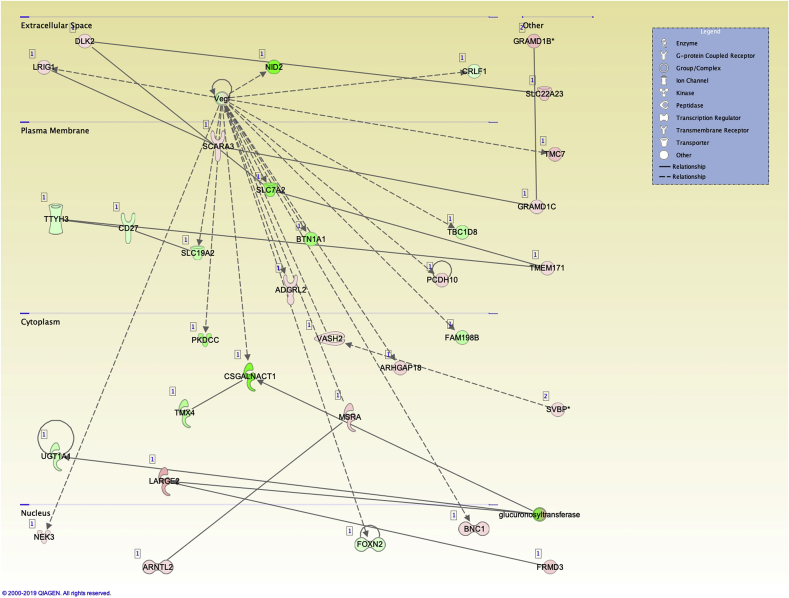
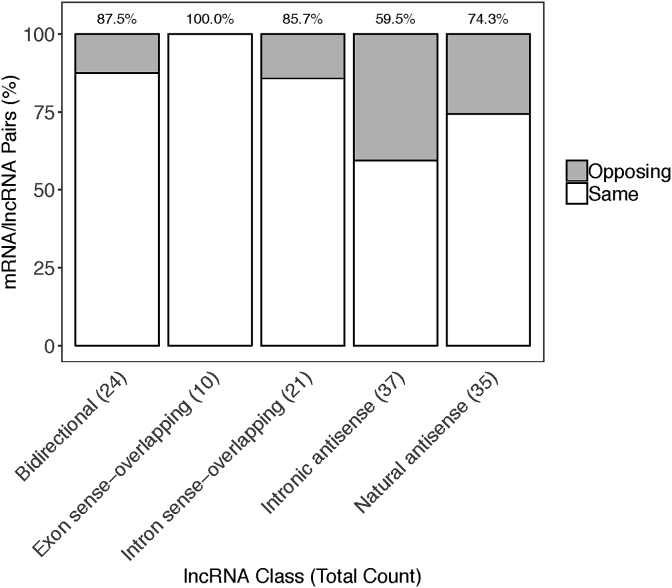
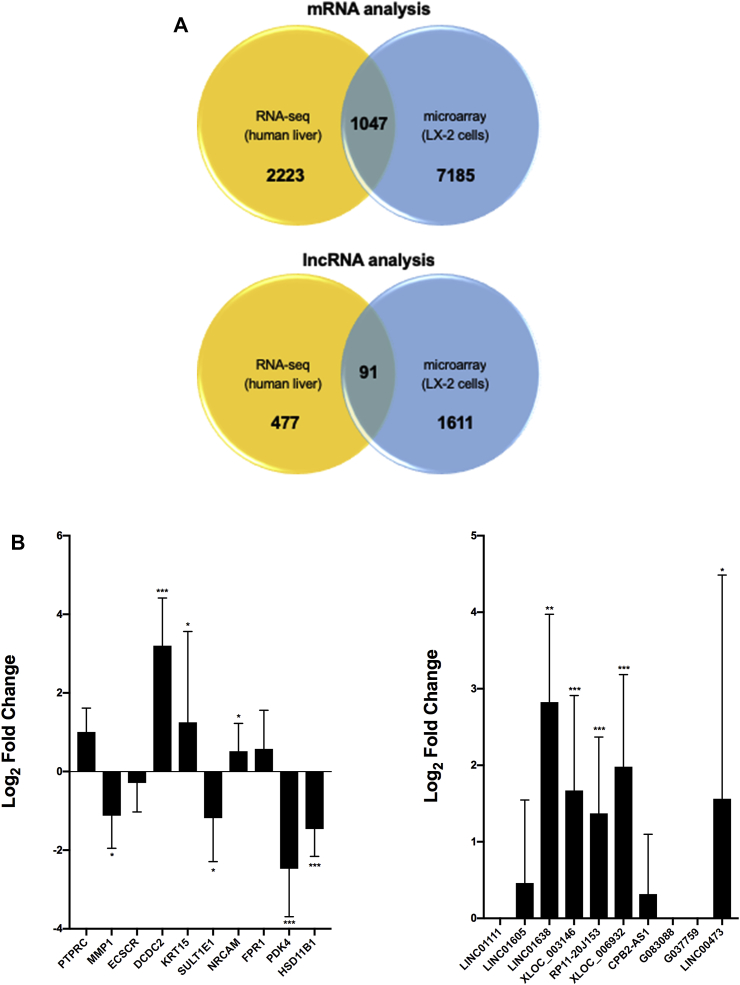
We previously reported dysregulated expression of liver-derived messenger RNA (mRNA) and long noncoding RNA (lncRNA) in patients with advanced fibrosis resulting from nonalcoholic fatty liver disease (NAFLD). Here we sought to identify changes in mRNA and lncRNA levels associated with activation of hepatic stellate cells (HSCs), the predominant source of extracellular matrix production in the liver and key to NAFLD-related fibrogenesis. We performed expression profiling of mRNA and lncRNA from LX-2 cells, an immortalized human HSC cell line, treated to induce phenotypes resembling quiescent and myofibroblastic states. We identified 1964 mRNAs (1377 upregulated and 587 downregulated) and 1460 lncRNAs (665 upregulated and 795 downregulated) showing statistically significant evidence (FDR ≤0.05) for differential expression (fold change ≥|2|) between quiescent and activated states. Pathway analysis of differentially expressed genes showed enrichment for hepatic fibrosis (FDR = 1.35E-16), osteoarthritis (FDR = 1.47E-14), and axonal guidance signaling (FDR = 1.09E-09). We observed 127 lncRNAs/nearby mRNA pairs showing differential expression, the majority of which were dysregulated in the same direction. A comparison of differentially expressed transcripts in LX-2 cells with RNA-sequencing results from NAFLD patients with or without liver fibrosis revealed 1047 mRNAs and 91 lncRNAs shared between the two datasets, suggesting that some of the expression changes occurring during HSC activation can be observed in biopsied human tissue. These results identify lncRNA and mRNA expression patterns associated with activated human HSCs that appear to recapitulate human NAFLD fibrosis.

Keywords: Cirrhosis; Hepatic fibrosis; Hepatic stellate cells; Long noncoding RNA; Nonalcoholic fatty liver disease.


Conflict of interest statement

CDS receives grant and consulting support from Ethicon Endo-Surgery. The remaining authors declare no competing financial and/or non-financial interests in relation to the work.

Figures

Fig. 1
Fig. 1
Differential characteristics of untreated LX-2 cells versus those treated with MDI. Light microscopy images from A) LX-2 cells treated with MDI for 72 h and LX-2 cells grown under normal culture conditions (NTC) for 72 h. All imaging was performed at 10X using a light microscope. B) Oil Red O staining of LX-2 cells treated with MDI and cells grown under normal conditions. Yellow arrows depict cells showing representative staining. C) protein levels of alpha smooth muscle actin (ACTA2) in MDI-treated cells and untreated cells (NTC) were detected using western blot analysis. Membranes were incubated with primary antibodies directed against ACTA2 (anti-mouse 1:500 dilution; Invitrogen) or GAPDH (anti-rabbit 1:1000; Cell Signaling Technology), washed in 1X TBS-Tween buffer and then incubated with secondary antibodies conjugated to horseradish peroxidase (1:3000; Cell Signaling Technology) for 1 h at room temperature. Membranes were incubated with Clarity Western ECL Blotting Substrate (Bio-Rad; Hercules, CA) according to the manufacturer's instructions. Protein bands were imaged using the Odyssey FC imaging system (LI-COR Biotechnology; Lincoln NE).
Fig. 2
Fig. 2
Differentially expressed transcripts in treated LX-2 cells. Volcano plot filtering between MDI-treated and untreated LX-2 cells was performed to identify differentially expressed A) mRNAs and B) lncRNAs between experimental groups. False discovery rates (FDR) were adjusted from all p-values for multiple testing corrections. The thresholds were fold-change ≥ |2.0| and FDR ≤0.05. Plots were constructed by plotting the FDR p-value (-log10) on the y-axis and the expression fold-change (log2) between the two groups on the x-axis. Data points in red represent upregulated transcripts, while those in green represent downregulated transcripts. Black-colored data points represent RNAs not showing statistically significant evidence for differential expression between the two treatment groups. (For interpretation of the references to color in this figure legend, the reader is referred to the Web version of this article.)
Fig. 3
Fig. 3
Validation of differentially expressed RNAs using an orthogonal platform. Results are shown for mRNAs and lncRNAs in untreated versus MDI-treated LX-2 cells. Expression levels were normalized against GAPDH. All experiments were performed in triplicate. Data are expressed as mean ± standard deviation. *P ≤ 0.05, **P ≤ 0.001, and ***P ≤ 0.0001.
Fig. 4
Fig. 4
Top network associated with carbohydrate metabolism, nucleic acid metabolism, and small molecule biochemistry in differentially expressed mRNAs. Pathway analysis was performed using the “core analysis” function in IPA. This plot depicts the top network identified.
Fig. 5
Fig. 5
mRNA/lncRNA interaction. Barplot representing the proportion of lncRNAs having same (white) or opposite (grey) log2 fold change direction with close mapping mRNAs. The total number of lncRNA/mRNA pairs for each lncRNA category is depicted on the x-axis, and the percentage of lncRNA/mRNA pairs with same fold change direction is shown at the top of the plot.
Fig. 6
Fig. 6
Identification of differentially expressed RNAs shared between LX-2 model and human liver samples from NAFLD patients with fibrosis. A) Intersection of filtered (FDR ≤0.05) and mapped datasets of differentially expressed mRNAs and lncRNAs obtained in LX-2 cells and biopsied liver tissue from NAFLD patients with normal (N = 24) or fibrotic (N = 53) histology [26,35]. B) Quantitative PCR analysis using hepatic RNA from NAFLD patients with normal liver histology (n = 10) and severe fibrosis (n = 10). Transcript levels were normalized to GAPDH, which showed invariant expression. Data are presented as relative log2 fold-change. A Mann-Whitney U test was used to assess statistical significance. *P ≤ 0.05, **P ≤ 0.001, and ***P ≤ 0.0001.

Similar articles

Cited by

References

    1. Younossi Z., Tacke F., Arrese M., Chander Sharma B., Mostafa I., Bugianesi E. Global perspectives on nonalcoholic fatty liver disease and nonalcoholic steatohepatitis. Hepatology. 2019;69(6):2672–2682. - PubMed
    1. Spengler E.K., Loomba R. Recommendations for diagnosis, referral for liver biopsy, and treatment of nonalcoholic fatty liver disease and nonalcoholic steatohepatitis. Mayo Clin. Proc. 2015;90(9):1233–1246. - PMC - PubMed
    1. Koek G.H., Liedorp P.R., Bast A. The role of oxidative stress in non-alcoholic steatohepatitis. Clin. Chim. Acta. 2011;412(15–16):1297–1305. - PubMed
    1. Jorge A.S., Andrade J.M., Paraiso A.F., Jorge G.C., Silveira C.M., de Souza L.R. Body mass index and the visceral adipose tissue expression of IL-6 and TNF-alpha are associated with the morphological severity of non-alcoholic fatty liver disease in individuals with class III obesity. Obes. Res. Clin. Pract. 2018;12(Suppl 2):1–8. - PubMed
    1. Liu W., Baker R.D., Bhatia T., Zhu L., Baker S.S. Pathogenesis of nonalcoholic steatohepatitis. Cell. Mol. Life Sci. 2016;73(10):1969–1987. - PMC - PubMed

LinkOut - more resources