

Inherent mitochondrial activity influences specification of the germ line in pluripotent stem cells
- PMID: 32258510
- PMCID: PMC7118317
- DOI: 10.1016/j.heliyon.2020.e03651
Inherent mitochondrial activity influences specification of the germ line in pluripotent stem cells
Abstract
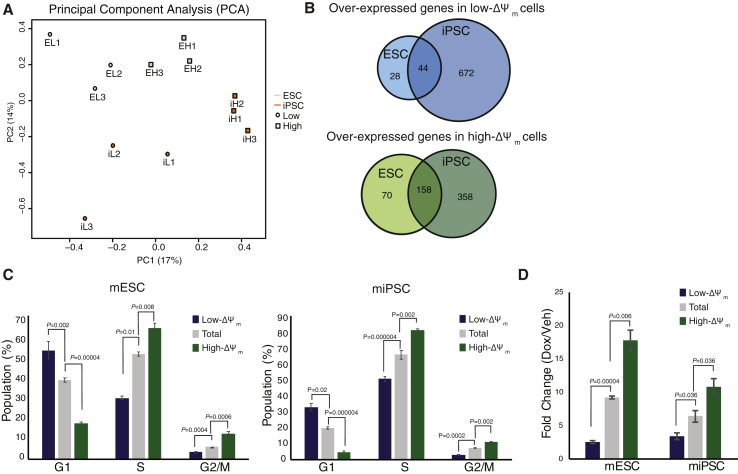
Herein we investigated whether inherent differences in mitochondrial activity in mouse pluripotent cells could be used to identify populations with an intrinsic ability to differentiate into primordial germ cells (PGCs). Notably, we determined that stem cells sorted based on differences in mitochondrial membrane activity exhibited altered germline differentiation capacity, with low-mitochondrial membrane potential associated with an increase in PGC-like cells. This specification was not further enhanced by hypoxia. We additionally noted differences between these populations in metabolism, transcriptome, and cell-cycle. These data contribute to a growing body of work demonstrating that pluripotent cells exhibit a large range of mitochondrial activity, which impacts cellular function and differentiation potential. Furthermore, pluripotent cells possess a subpopulation of cells with an improved ability to differentiate into the germ lineage that can be identified based on differences in mitochondrial membrane potential.
Keywords: Biological sciences; Cell biology; Mitochondria; PGC; Primordial germ cell; Stem cell; Stem cell research.
© 2020 The Authors.
Figures


Similar articles
-
Human primordial germ cell commitment in vitro associates with a unique PRDM14 expression profile.EMBO J. 2015 Apr 15;34(8):1009-24. doi: 10.15252/embj.201488049. Epub 2015 Mar 6. EMBO J. 2015. PMID: 25750208 Free PMC article.
-
Induction of primordial germ cell-like cells from mouse embryonic stem cells by ERK signal inhibition.Stem Cells. 2014 Oct;32(10):2668-78. doi: 10.1002/stem.1781. Stem Cells. 2014. PMID: 24989326
-
Human blastocyst outgrowths recapitulate primordial germ cell specification events.Mol Hum Reprod. 2019 Sep 1;25(9):519-526. doi: 10.1093/molehr/gaz035. Mol Hum Reprod. 2019. PMID: 31211841 Free PMC article.
-
Generation of germ cells from pluripotent stem cells in mammals.Reprod Med Biol. 2017 Dec 10;17(2):107-114. doi: 10.1002/rmb2.12077. eCollection 2018 Apr. Reprod Med Biol. 2017. PMID: 29692667 Free PMC article. Review.
-
Endogenous, very small embryonic-like stem cells: critical review, therapeutic potential and a look ahead.Hum Reprod Update. 2016 Dec;23(1):41-76. doi: 10.1093/humupd/dmw030. Epub 2016 Sep 10. Hum Reprod Update. 2016. PMID: 27614362 Review.
Cited by
-
Mitochondrial Dynamics in the Drosophila Ovary Regulates Germ Stem Cell Number, Cell Fate, and Female Fertility.Front Cell Dev Biol. 2021 Jan 28;8:596819. doi: 10.3389/fcell.2020.596819. eCollection 2020. Front Cell Dev Biol. 2021. PMID: 33585443 Free PMC article.
-
Mitochondrial regulation in human pluripotent stem cells during reprogramming and β cell differentiation.Front Endocrinol (Lausanne). 2023 Oct 20;14:1236472. doi: 10.3389/fendo.2023.1236472. eCollection 2023. Front Endocrinol (Lausanne). 2023. PMID: 37929027 Free PMC article. Review.
-
The Beginning of Meiosis in Mammalian Female Germ Cells: A Never-Ending Story of Intrinsic and Extrinsic Factors.Int J Mol Sci. 2022 Oct 20;23(20):12571. doi: 10.3390/ijms232012571. Int J Mol Sci. 2022. PMID: 36293427 Free PMC article. Review.
References
-
- Bothun A.M., Woods D.C. Dynamics of WNT signaling components in the human ovary from development to adulthood. Histochem. Cell Biol. 2019;151:115–123. - PubMed
-
- Chambers I., Silva J., Colby D., Nichols J., Nijmeijer B., Robertson M., Vrana J., Jones K., Grotewold L., Smith A. Nanog safeguards pluripotency and mediates germline development. Nature. 2007;450:1230–1234. - PubMed
LinkOut - more resources
Full Text Sources
Molecular Biology Databases
