

Simple Peptide Quantification Approach for MS-Based Proteomics Quality Control
- PMID: 32258910
- PMCID: PMC7114614
- DOI: 10.1021/acsomega.0c00080
Simple Peptide Quantification Approach for MS-Based Proteomics Quality Control
Abstract
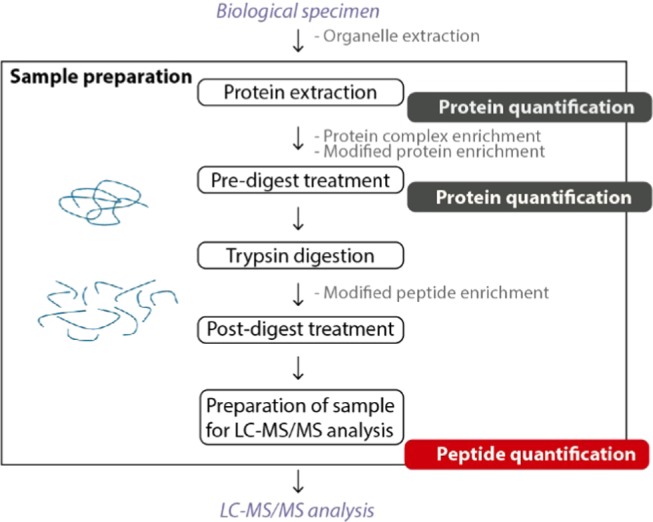
Despite its growing popularity and use, bottom-up proteomics remains a complex analytical methodology. Its general workflow consists of three main steps: sample preparation, liquid chromatography coupled to tandem mass spectrometry (LC-MS/MS), and computational data analysis. Quality assessment of the different steps and components of this workflow is instrumental to identify technical flaws and avoid loss of precious measurement time and sample material. However, assessment of the extent of sample losses along with the sample preparation protocol, in particular, after proteolytic digestion, is not yet routinely implemented because of the lack of an accurate and straightforward method to quantify peptides. Here, we report on the use of a microfluidic UV/visible spectrophotometer to quantify MS-ready peptides directly in the MS-loading solvent, consuming only 2 μL of sample. We compared the performance of the microfluidic spectrophotometer with a standard device and determined the optimal sample amount for LC-MS/MS analysis on a Q Exactive HF mass spectrometer using a dilution series of a commercial K562 cell digest. A careful evaluation of selected LC and MS parameters allowed us to define 3 μg as an optimal peptide amount to be injected into this particular LC-MS/MS system. Finally, using tryptic digests from human HEK293T cells and showing that injecting equal peptide amounts, rather than approximate ones, result in less variable LC-MS/MS and protein quantification data. The obtained quality improvement together with easy implementation of the approach makes it possible to routinely quantify MS-ready peptides as a next step in daily proteomics quality control.
Copyright © 2020 American Chemical Society.
Conflict of interest statement
The authors declare no competing financial interest.
Figures


Similar articles
-
Automation of peptide desalting for proteomic liquid chromatography - tandem mass spectrometry by centrifugal microfluidics.Lab Chip. 2021 Jun 1;21(11):2255-2264. doi: 10.1039/d1lc00137j. Lab Chip. 2021. PMID: 33908535
-
Optimization of mass spectrometric parameters improve the identification performance of capillary zone electrophoresis for single-shot bottom-up proteomics analysis.Anal Chim Acta. 2018 Feb 25;1001:93-99. doi: 10.1016/j.aca.2017.11.023. Epub 2017 Nov 14. Anal Chim Acta. 2018. PMID: 29291811 Free PMC article.
-
Off-line two-dimensional liquid chromatography with maximized sample loading to reversed-phase liquid chromatography-electrospray ionization tandem mass spectrometry for shotgun proteome analysis.Anal Chem. 2009 Feb 1;81(3):1049-60. doi: 10.1021/ac802106z. Anal Chem. 2009. PMID: 19178338
-
Signature peptide selection workflow for biomarker quantification using LC-MS-based targeted proteomics.Bioanalysis. 2023 Mar;15(5):295-300. doi: 10.4155/bio-2022-0241. Epub 2023 Apr 11. Bioanalysis. 2023. PMID: 37040396 Review.
-
Sample preparation strategies for targeted proteomics via proteotypic peptides in human blood using liquid chromatography tandem mass spectrometry.Proteomics Clin Appl. 2015 Feb;9(1-2):5-16. doi: 10.1002/prca.201400121. Epub 2014 Dec 28. Proteomics Clin Appl. 2015. PMID: 25418444 Review.
Cited by
-
A 96-Well Ultrafiltration Approach for the High-Throughput Proteome Analysis of Extracellular Vesicles Isolated From Conditioned Medium.J Extracell Vesicles. 2025 Jul;14(7):e70103. doi: 10.1002/jev2.70103. J Extracell Vesicles. 2025. PMID: 40619995 Free PMC article.
-
Proteomics: A Tool to Study Platelet Function.Int J Mol Sci. 2021 Apr 30;22(9):4776. doi: 10.3390/ijms22094776. Int J Mol Sci. 2021. PMID: 33946341 Free PMC article. Review.
-
Loss of phospholipase PLAAT3 causes a mixed lipodystrophic and neurological syndrome due to impaired PPARγ signaling.Nat Genet. 2023 Nov;55(11):1929-1940. doi: 10.1038/s41588-023-01535-3. Epub 2023 Nov 2. Nat Genet. 2023. PMID: 37919452
-
Raman active diyne-girder conformationally constrained p53 stapled peptides bind to MDM2 for visualisation without fluorophores.RSC Chem Biol. 2025 Jan 15;6(3):394-403. doi: 10.1039/d4cb00288a. eCollection 2025 Mar 5. RSC Chem Biol. 2025. PMID: 39830683 Free PMC article.
-
The Final Maturation State of β-actin Involves N-terminal Acetylation by NAA80, not N-terminal Arginylation by ATE1.J Mol Biol. 2022 Jan 30;434(2):167397. doi: 10.1016/j.jmb.2021.167397. Epub 2021 Dec 9. J Mol Biol. 2022. PMID: 34896361 Free PMC article.
References
-
- Meier F.; Brunner A.-D.; Koch S.; Koch H.; Lubeck M.; Krause M.; Goedecke N.; Decker J.; Kosinski T.; Park M. A.; et al. Online Parallel Accumulation-Serial Fragmentation (PASEF) with a Novel Trapped Ion Mobility Mass Spectrometer. Mol. Cell. Proteomics 2018, 17, 2534–2545. 10.1074/mcp.TIR118.000900. - DOI - PMC - PubMed
-
- Bache N.; Geyer P. E.; Bekker-Jensen D. B.; Hoerning O.; Falkenby L.; Treit P. V.; Doll S.; Paron I.; Muller J. B.; Meier F.; et al. A Novel LC System Embeds Analytes in Pre-Formed Gradients for Rapid, Ultra-Robust Proteomics. Mol. Cell. Proteomics 2018, 17, 2284–2296. 10.1074/mcp.TIR118.000853. - DOI - PMC - PubMed
LinkOut - more resources
Full Text Sources
Molecular Biology Databases
Research Materials
Miscellaneous
