. 2020 Mar 17;5(12):6983-7001.
doi: 10.1021/acsomega.0c00337. eCollection 2020 Mar 31.

Amphiphilic Cationic Triscyclometalated Iridium(III) Complex-Peptide Hybrids Induce Paraptosis-like Cell Death of Cancer Cells via an Intracellular Ca2+-Dependent Pathway

Affiliations

Amphiphilic Cationic Triscyclometalated Iridium(III) Complex-Peptide Hybrids Induce Paraptosis-like Cell Death of Cancer Cells via an Intracellular Ca2+-Dependent Pathway

Kenta Yokoi et al. ACS Omega. .

Abstract

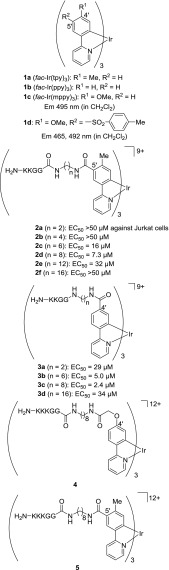
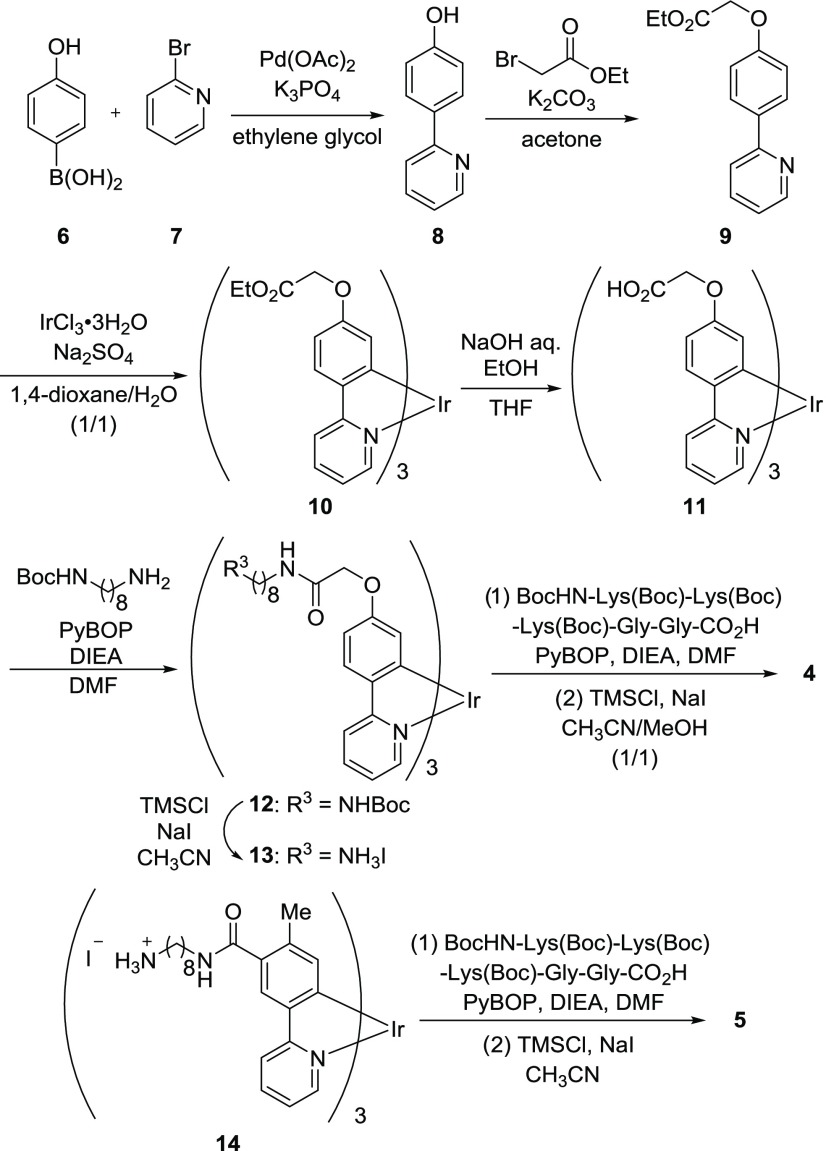
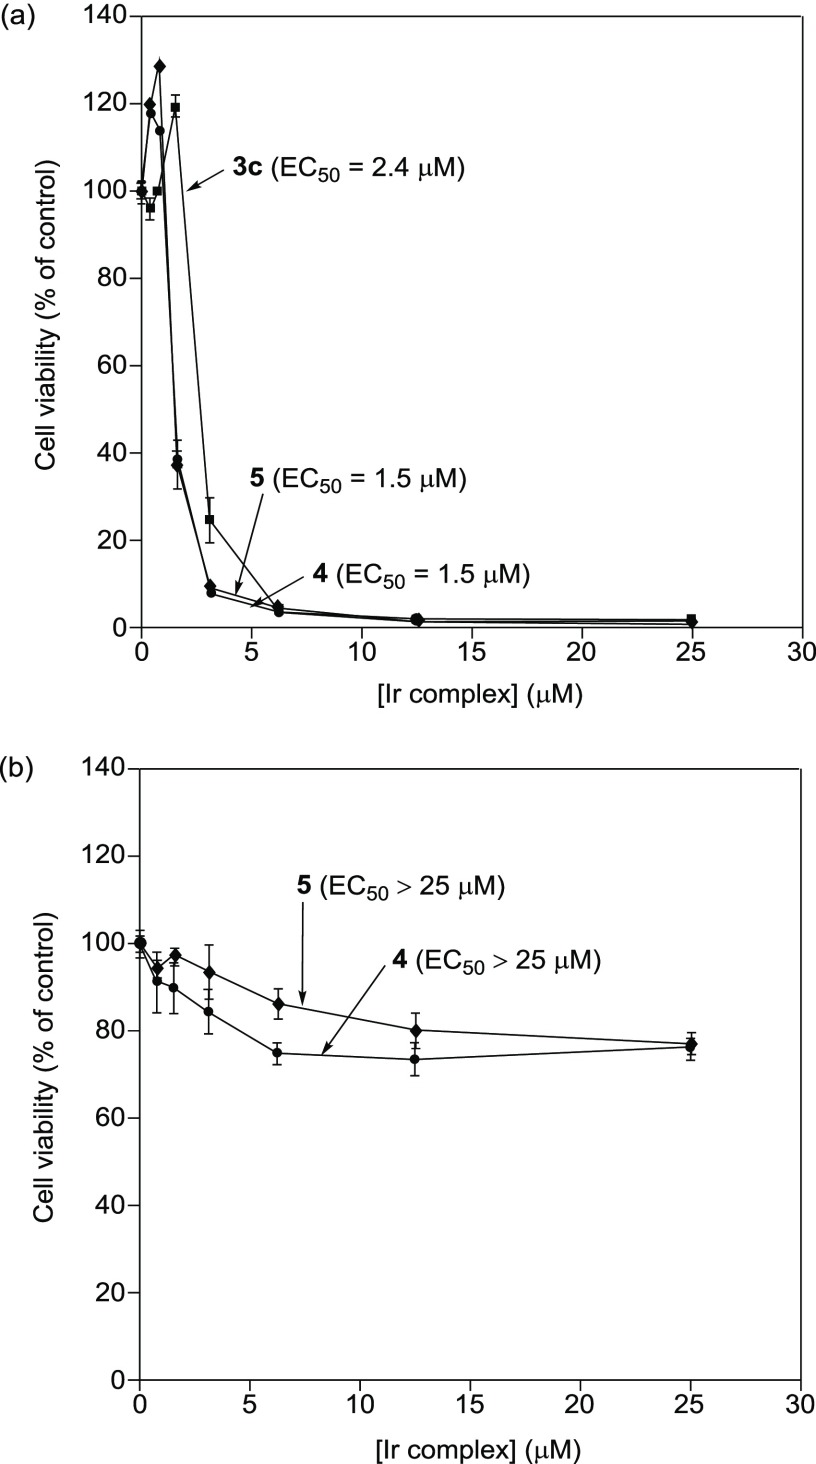
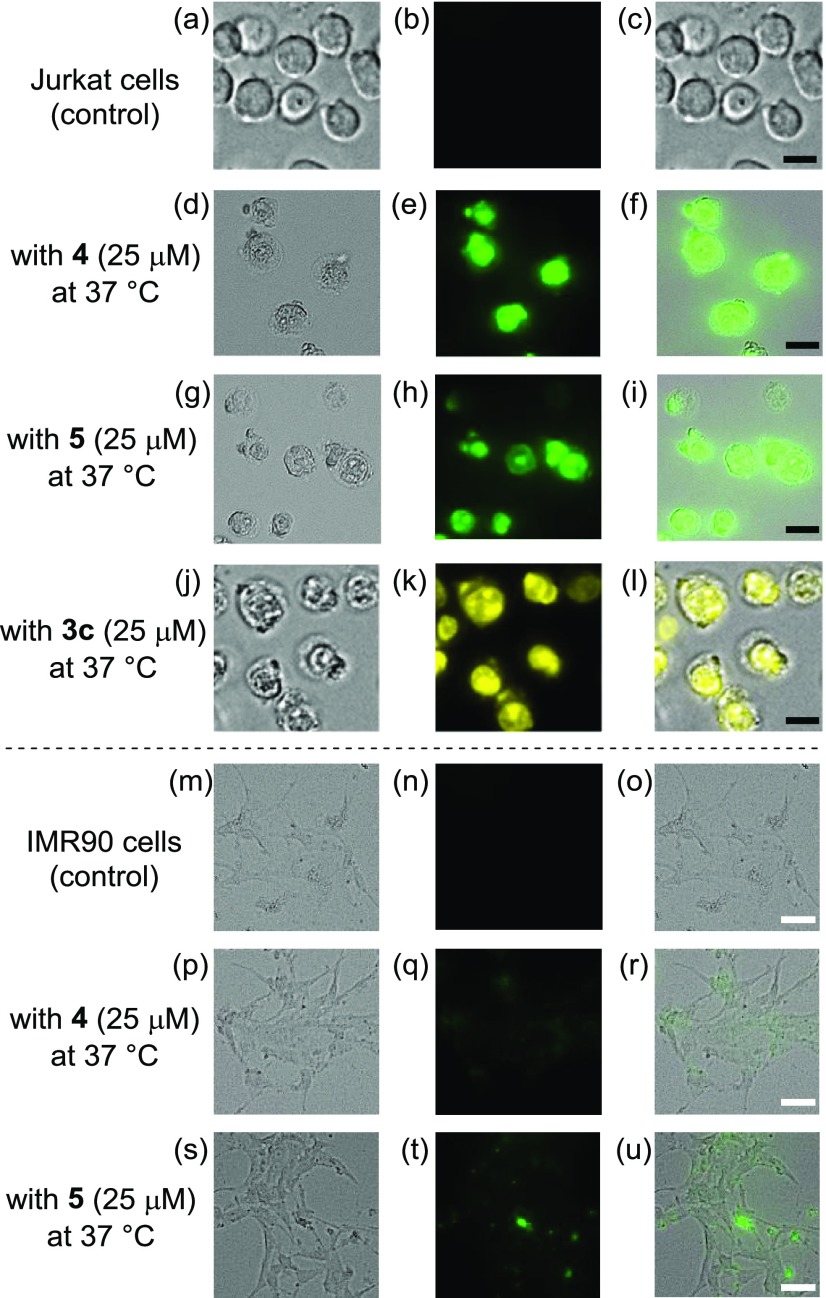
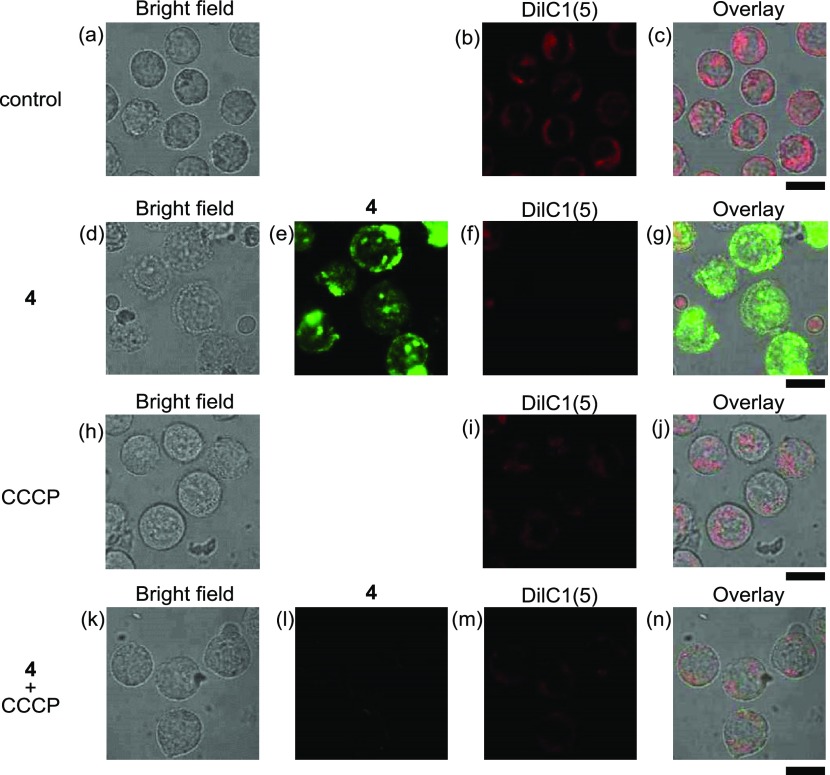
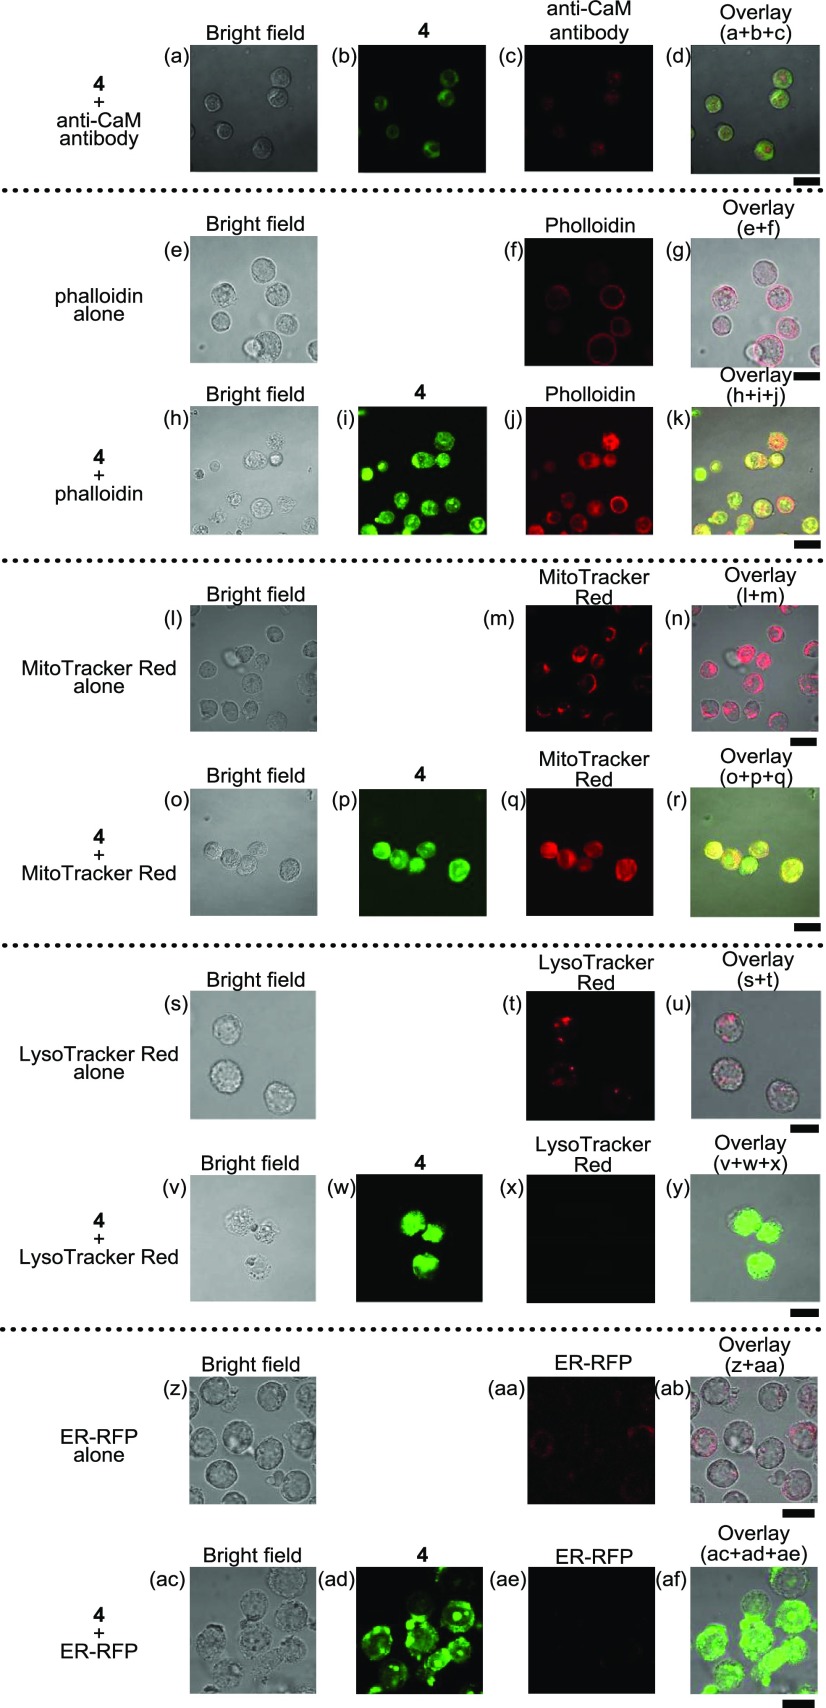
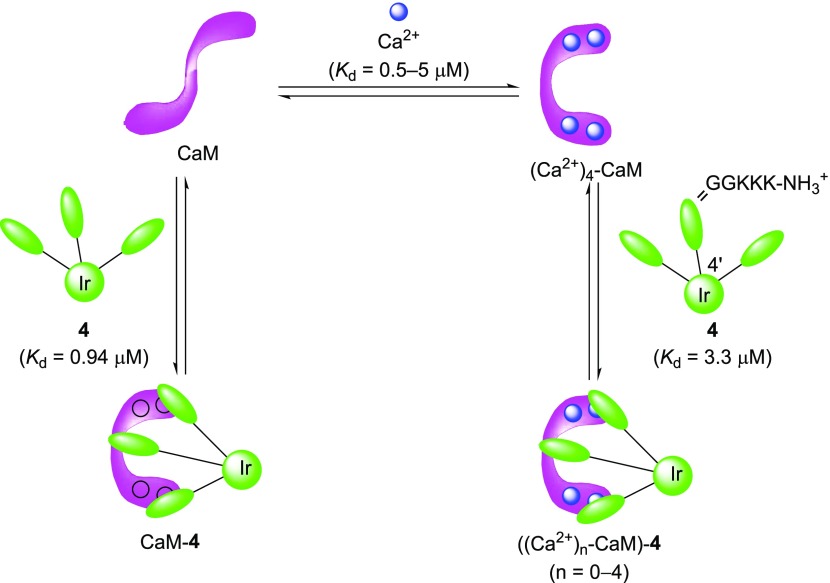
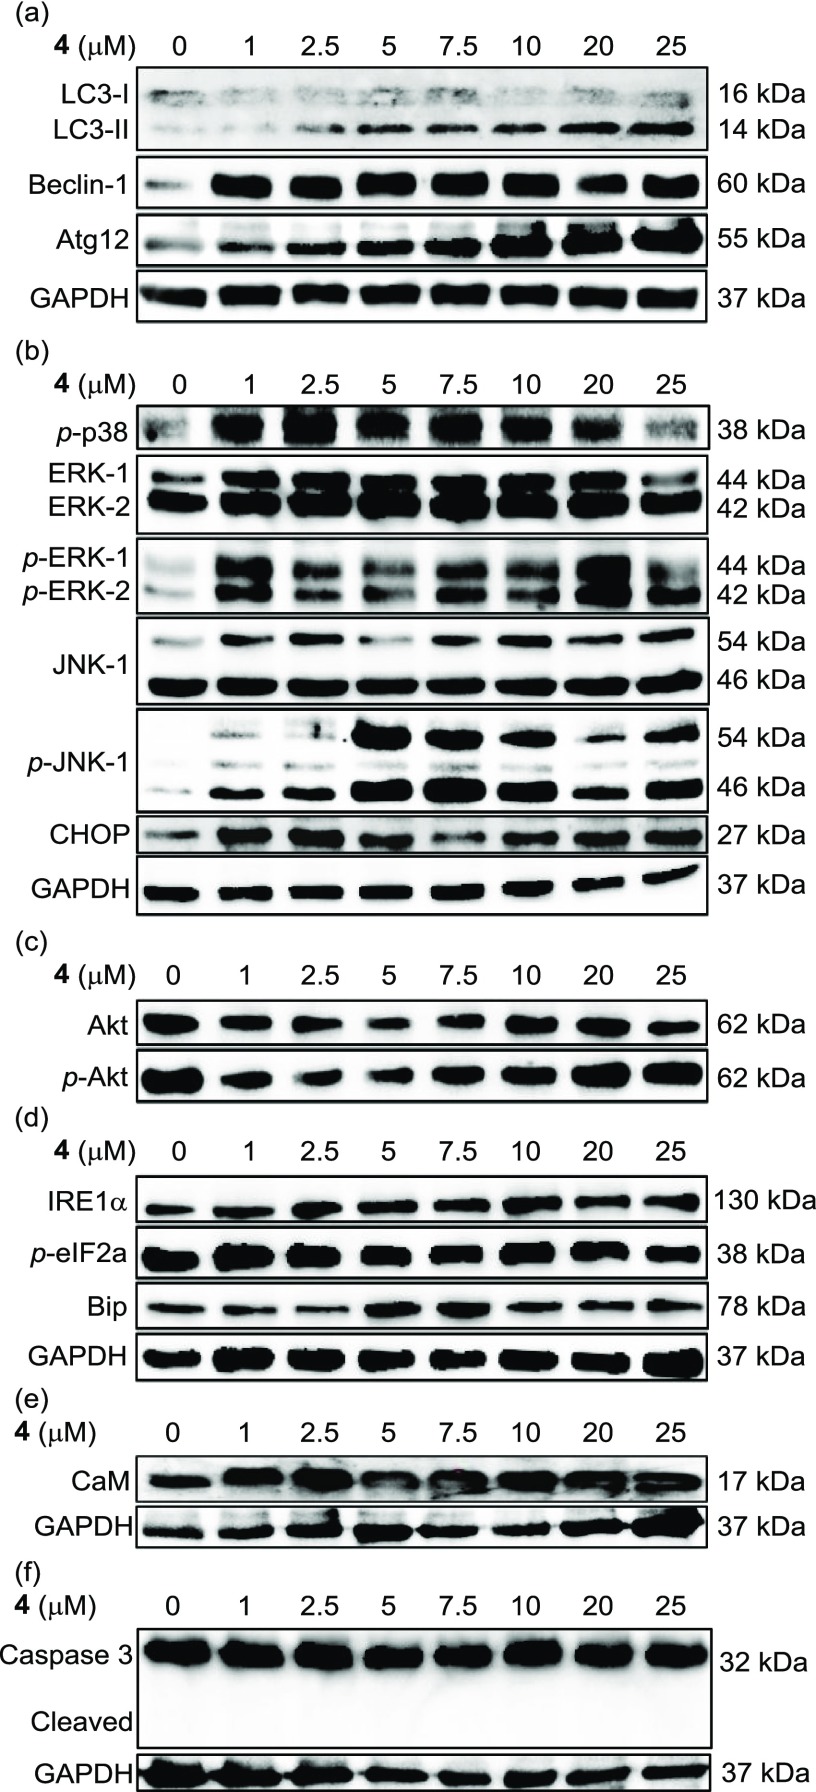
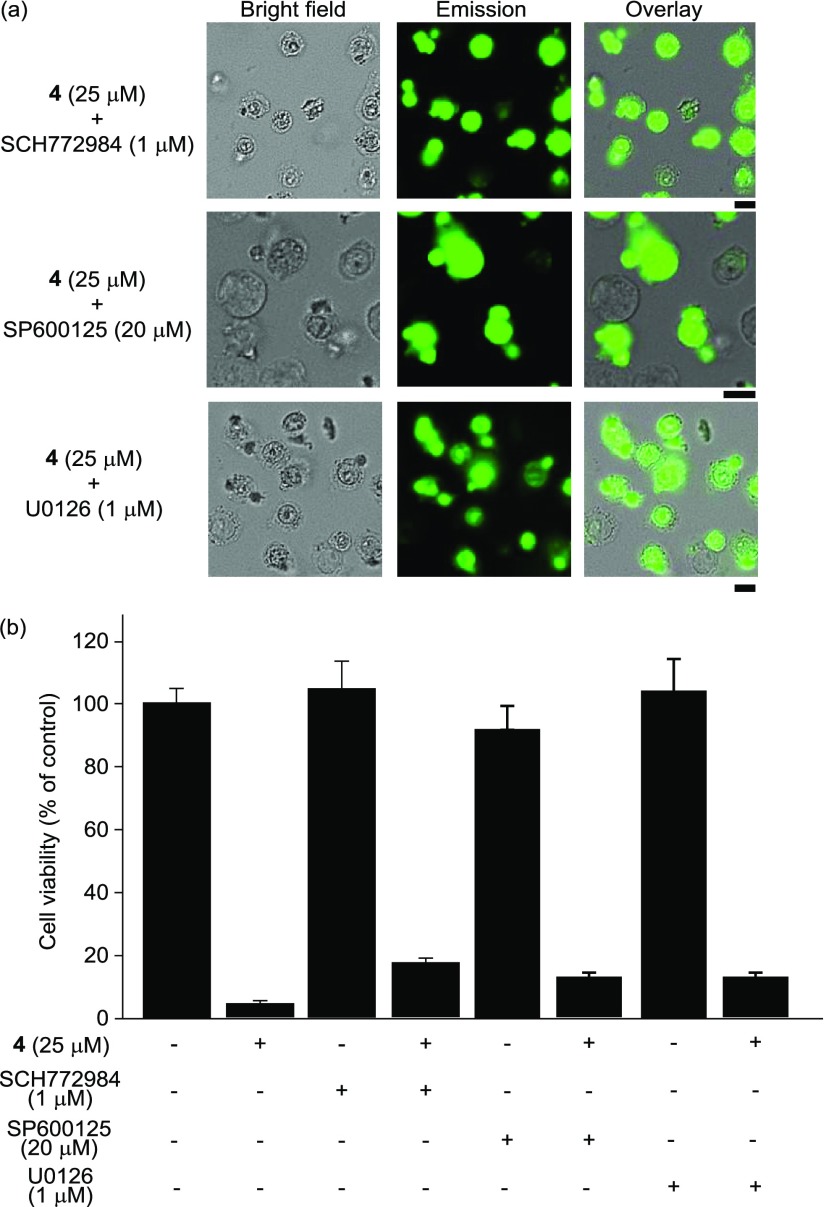
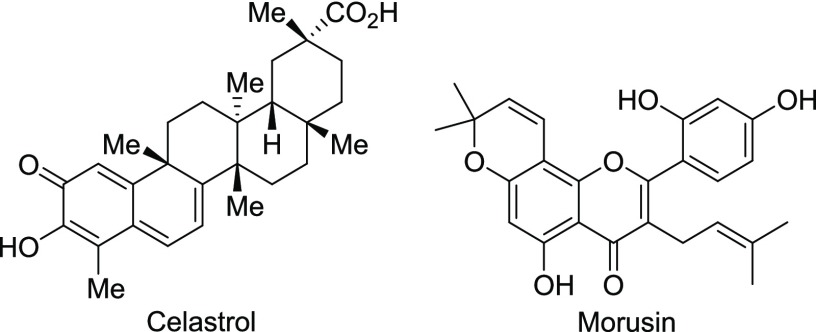
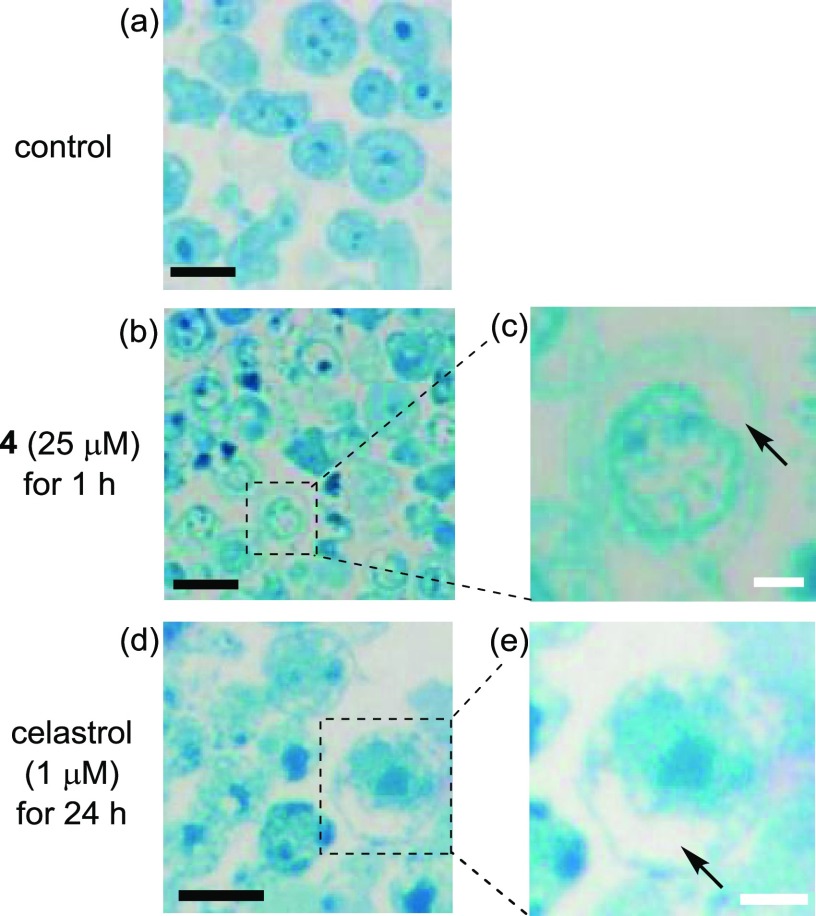
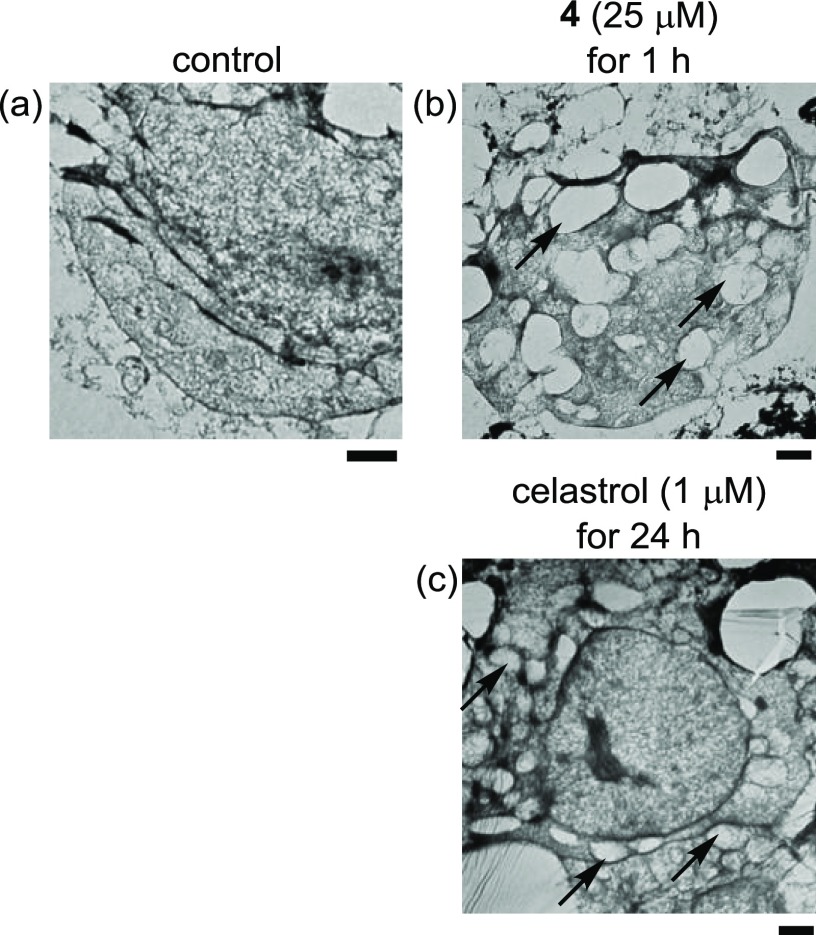
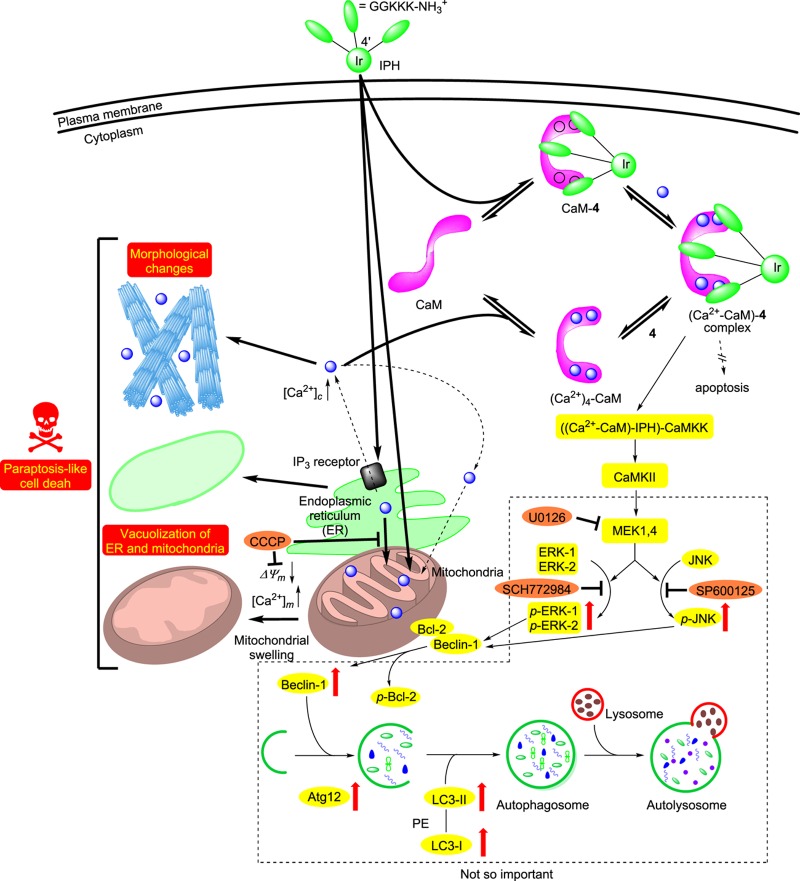
We report on the design and synthesis of a green-emitting iridium complex-peptide hybrid (IPH) 4, which has an electron-donating hydroxyacetic acid (glycolic acid) moiety between the Ir core and the peptide part. It was found that 4 is selectively cytotoxic against cancer cells, and the dead cells showed a green emission. Mechanistic studies of cell death indicate that 4 induces a paraptosis-like cell death through the increase in mitochondrial Ca2+ concentrations via direct Ca2+ transfer from ER to mitochondria, the loss of mitochondrial membrane potential (ΔΨm), and the vacuolization of cytoplasm and intracellular organelle. Although typical paraptosis and/or autophagy markers were upregulated by 4 through the mitogen-activated protein kinase (MAPK) signaling pathway, as confirmed by Western blot analysis, autophagy is not the main pathway in 4-induced cell death. The degradation of actin, which consists of a cytoskeleton, is also induced by high concentrations of Ca2+, as evidenced by costaining experiments using a specific probe. These results will be presented and discussed.


Conflict of interest statement

The authors declare no competing financial interest.

Figures

Chart 1
Chart 1
Chart 2
Chart 2
Chart 3
Chart 3
Figure 1
Figure 1
(a) MTT assay of Jurkat cells with 4 (closed circles), 5 (closed diamonds), and 3c (closed squares) in 10% FBS/RPMI medium (incubation at 37 °C for 24 h). (b) MTT assay of IMR90 cells with 4 (closed circles) and 5 (closed diamonds) in 10% FBS/RPMI medium (incubation at 37 °C for 24 h). The net charge of each complex is assumed to be +12 (4 and 5) and +9 (3c).
Figure 2
Figure 2
Typical luminescence microscopy images of (a–l) Jurkat cells and (m–u) IMR90 cells treated with 4 (25 μM), 5 (25 μM), and 3c (25 μM) at 37 °C for 1 h. (a) Bright field, (b) emission, and (c) overlay images of the control; (d) bright field, (e) emission, and (f) overlay images with 4; (g) bright field, (h) emission, and (i) overlay images with 5; (j) bright field, (k) emission, and (l) overlay images with 3c of Jurkat cells; (m) bright field, (n) emission, and (o) overlay images of the control; (p) bright field, (q) emission, and (r) overlay images with 4; (s) bright field, (t) emission, and (u) overlay images with 5 of IMR90 cells. Scale bar (black) is 10 μm, and scale bar (white) is 50 μm.
Figure 3
Figure 3
Intracellular uptake of IPHs 3c, 4, 5, and 2c (25 μM) into Jurkat cells at 37 °C for 1 h measured by ICP-MS.
Figure 4
Figure 4
Effect of Z-VAD-fmk (15 μM, an apoptosis inhibitor), necrostatin-1 (30 μM, a necroptosis inhibitor), 3-MA (5 mM, an autophagy inhibitor), TFP (10 μM, a CaM-binding molecule), and CCCP (40 μM, an uncoupling reagent and an inhibitor of Ca2+ influx into mitochondria) on the cell death of Jurkat cells induced by 4. (a, d, g, j, m, p, s, v, y) Bright field images of Jurkat cells; (b, e, h, k, n, q, t) emission images of 4; (w, z) emission images of 5; (c) overlay image of (a) and (b); (f) overlay image of (d) and (e); (i) overlay image of (g) and (h); (l) overlay image of (j) and (k); (o) overlay image of (m) and (n); (r) overlay image of (p) and (q); (u) overlay image of (s) and (t); (x) overlay image of (v) and (w); (aa) overlay image of (y) and (z). Excitation at 377 nm. Scale bar (black) is 10 μm.
Figure 5
Figure 5
(a) Typical luminescence images (Biorevo, BZ-9000, Keyence) of Jurkat cells treated with Rhod-4 (red emission), followed by 4 (50 μM). Excitation at 540 nm for Rhod-4. (b, c) Time-dependent changes in the fluorescent intensity of Rhod-4 (F/F0) after the treatment with 4 (b) and 13 (c) (cell 1 (light green), 2 (orange), 3 (red), 4 (yellow), 5 (blue), 6 (green), and 7 (black)). (d) Typical luminescence images (Biorevo, BZ-9000, Keyence) of Jurkat cells treated with Rhod-2 (red emission), followed by 4 (50 μM). Excitation at 540 nm for Rhod-2. (e, f) Time-dependent fluorescent changes of Rhod-2 (F/F0) after the treatment with 4 (e) and 13 (f) (cell 1 (light green), 2 (orange), 3 (red), 4 (yellow), 5 (blue), 6 (green), and 7 (black)).
Figure 6
Figure 6
Flow cytometry analysis of Jurkat cells after the treatment with (a, b) Rhod-4 (5 μM) or (c, d) Rhod-2 (5 μM) and then with 4 (50 μM). Different colors indicate the incubation times of 4: control (black), 2 min (blue), 4 min (light green), 6 min (red), 8 min (sky blue), 10 min (violet), and 15 min (green) in (a) and (c), and control (black), 20 min (blue), 40 min (light green), and 60 min (red) in (b) and (d).
Figure 7
Figure 7
Typical luminescent confocal microscopy images of Jurkat cells treated with DilC1(5) (500 nM) in the presence of 4 (25 μM) and/or CCCP (40 μM): (a, d, h, k) bright field images of Jurkat cells; (b, f, i, m) emission images of DilC1(5); (e, l) emission images of 4; (c) overlay image of (a) and (b); (g) overlay image of (d)–(f); (j) overlay image of (h) and (i); (n) overlay image of (k)–(m). Excitation at 405 nm for (e) and (l); 635 nm for (b), (f), (i), and (m). Exposure time is 20 μs/pixel. Scale bar (black) is 10 μm.
Figure 8
Figure 8
Typical luminescence confocal microscopy images of Jurkat cells that had been treated with anti-CaM antibody–Alexa Fluor 594 conjugate, phalloidin–CruzFluor 555 conjugate, MitoTracker Red, LysoTracker Red, and ER-RFP in the presence (10 μM) or absence of 4: (a, e, h, l, o, s, v, z, ac) bright field of Jurkat cells; (b, i, p, w, ad) emission images of 4; (c) emission images of the anti-CaM antibody; (d) overlay image of (a)–(c); (f, j) emission images of phalloidin; (g) overlay image of (e) and (f); (k) overlay images of (h)–(j); (m, q) emission images of MitoTracker Red; (n) overlay images of (l)–(m); (r) overlay images of (o)–(q); (t, x) emission images of LysoTracker Red; (u) overlay images of (s)–(t); (y) overlay images of (v)–(x); (aa, ae) emission images of ER-RFP; (ab) overlay images of (z)–(aa); (af) overlay images of (ac)–(ae). Excitation at 405 nm for (b), (i), (p), and (w) and at 559 nm for (c), (f), (j), (m), (q), (t), and (x). Exposure time was 20 μs/pixel. Scale bar (black) is 10 μm.
Chart 4
Chart 4. Our Assumption on the Complexation of 4 with Ca2+-CaM
Figure 9
Figure 9
Western blot analysis of Jurkat cells treated with 4 (0–25 μM). Proteins related to (a) autophagy, (b) MAPK signaling pathway, and (c) PI3K/Akt signaling pathway, (d) ER stress, (e) CaM, and (f) apoptosis were investigated in a dose-dependent manner.
Figure 10
Figure 10
Effect of SCH772984 (ERK inhibitor), SP600125 (JNK inhibitor), and U0126 (MEK inhibitor). (a) Typical luminescence microscopy images of Jurkat cells treated with SCH772984, SP600125, and U0126. (b) MTT assays of Jurkat cells in the presence and/or absence of 4 and SCH772984, SP600125, or U0126. Scale bar (black) is 10 μm.
Chart 5
Chart 5
Figure 11
Figure 11
Typical microscopy images of Jurkat cells stained with methylene blue after the treatment with 4 (25 μM) at 37 °C for 1 h. (a) Control; (b, c) Jurkat cells treated with 4 (25 μM, for 1 h); and (d, e) Jurkat cells treated with celastrol (1 μM, for 24 h). Arrows in (c) and (e) indicate cytoplasmic vacuolization induced by 4 and celastrol, respectively. Scale bar (black) is 10 μm, and scale bar (white) is 5 μm.
Figure 12
Figure 12
Transmission electron microscopy (TEM) images of Jurkat cells treated with 4 (25 μM, 1 h) and celastrol (1 μM, 24 h). (a) Control, (b) Jurkat cells treated with 4 (25 μM, for 1 h), and (c) Jurkat cells treated with celastrol (1 μM, for 24 h). Arrows in (b) and (c) indicate cytoplasmic vacuolization induced by 4 and celastrol, respectively. Scale bar (black) is 1 μm.
Chart 6
Chart 6

Similar articles

Cited by

References

    1. Dedeian K.; Djurovich P. I.; Garces F. O.; Carlson G.; Watts R. J. A new synthetic route to the preparation of a series of strong photoreducing agents: fac-tris-ortho-metalated complexes of iridium(III) with substituted 2-phenylpyridines. Inorg. Chem. 1991, 30, 1685–1687. 10.1021/ic00008a003. - DOI
    1. Tamayo A. B.; Alleyne B. D.; Djurovich P. I.; Lamansky S.; Tsyba I.; Ho N. N.; Bau R.; Thompson M. E. Synthesis and characterization of facial and meridional tris-cyclometalated iridium(III) complexes. J. Am. Chem. Soc. 2003, 125, 7377–7387. 10.1021/ja034537z. - DOI - PubMed
    1. Flamigni L.; Barbieri A.; Sabatini C.; Ventura B.; Barigelletti F. Photochemistry and photophysics of coordination compounds: iridium. Top. Curr. Chem. 2007, 281, 143–203. 10.1007/128_2007_131. - DOI
    1. Omae I. Application of five-membered ring products of cyclometalation reactions as sensing materials in sensing devices. J. Organomet. Chem. 2016, 823, 50–75. 10.1016/j.jorganchem.2016.09.008. - DOI
    1. Lightfoot A.; Schnider P.; Pfaltz A. Enantioselective hydrogenation of olefins with iridium-phosphonodihydrooxazole catalysts. Angew. Chem., Int. Ed. 1998, 37, 2897.10.1002/(SICI)1521-3773(19981102)37:20<2897::AID-ANIE2897>3.0.CO;2-8. - DOI - PubMed