

Both Dietary Ratio of n-6 to n-3 Fatty Acids and Total Dietary Lipid Are Positively Associated with Adiposity and Reproductive Health in Zebrafish
- PMID: 32258992
- PMCID: PMC7108797
- DOI: 10.1093/cdn/nzaa034
Both Dietary Ratio of n-6 to n-3 Fatty Acids and Total Dietary Lipid Are Positively Associated with Adiposity and Reproductive Health in Zebrafish
Abstract
Background: Controversial findings have been reported in human and animal studies regarding the influence of n-6 (ω-6) to n-3 (ω-3) fatty acid ratios on obesity and health. Two confounding factors may be related to interactions with other dietary lipid components or sex-specific differences in fatty acid metabolism.
Objective: This study investigated main and interactive effects of total dietary lipid, ratio of n-6 to n-3 fatty acids, and sex on growth, adiposity, and reproductive health in wild-type zebrafish.
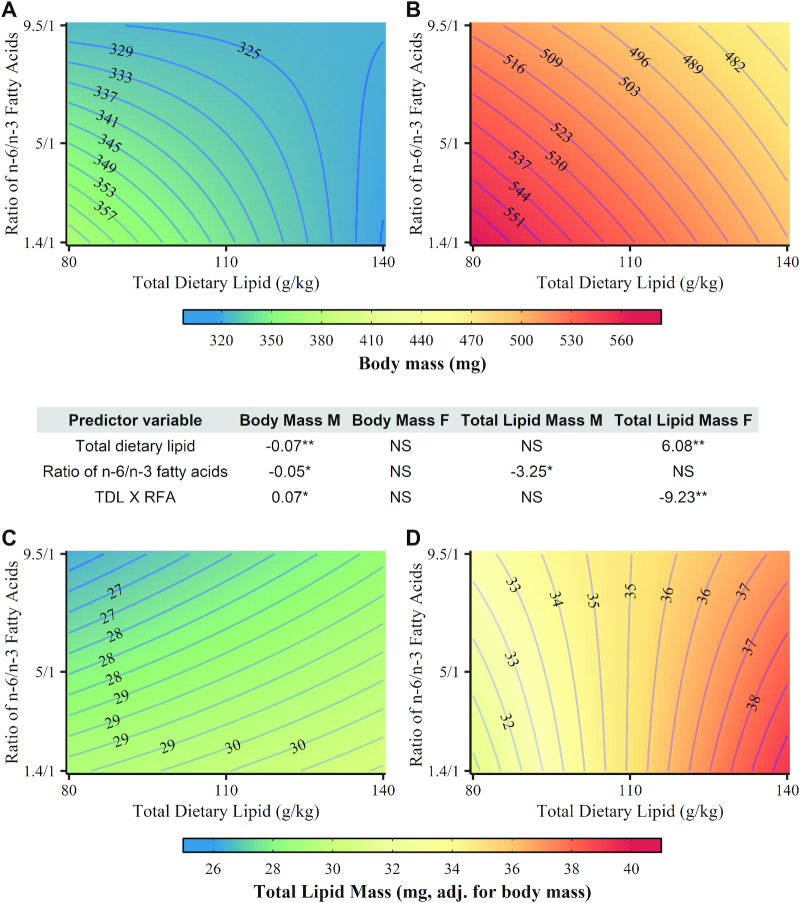
Methods: Male and female zebrafish (3 wk old) were fed 9 diets consisting of 3 ratios of n-6 to n-3 fatty acids (1.4:1, 5:1, and 9.5:1) varied within 3 total lipid amounts (80, 110, and 140 g/kg) for 16 wk. Data were then collected on growth, body composition (determined by chemical carcass analysis), and female reproductive success (n = 32 breeding events/diet over 4 wk). Main and interactive effects of dietary lipid and sex were evaluated with regression methods. Significant differences within each dietary lipid component were relative to the intercept/reference group (80 g/kg and 1.4:1 ratio).
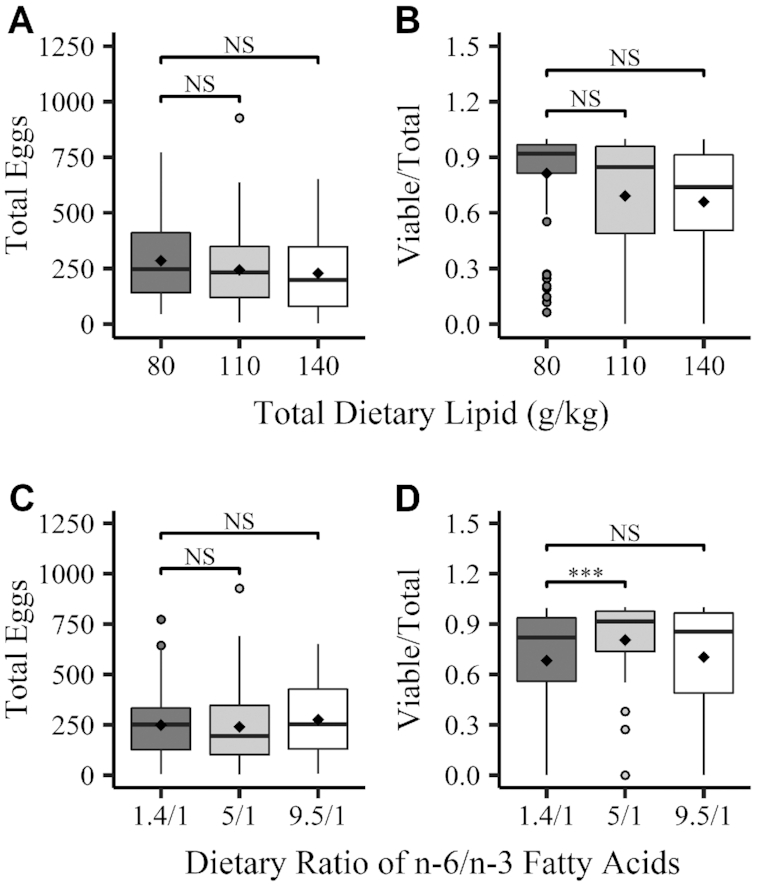
Results: Dietary lipid and sex interacted in their effects on body weight (P = 0.015), total body length (P = 0.003), and total lipid mass (P = 0.029); thus, these analyses were stratified by sex. Female spawning success decreased as dietary total lipid and fatty acid ratio increased (P = 0.030 and P = 0.026, respectively). While total egg production was not associated with either dietary lipid component, females fed the 5:1 ratio produced higher proportions of viable embryos compared with the 1.4:1 ratio [median (95% CI): 0.915 (0.863, 0.956) vs 0.819 (0.716, 0.876); P < 0.001].
Conclusions: Further characterization of dietary lipid requirements will help define healthy balances of dietary lipid, while the sex-specific responses to dietary lipid identified in this study may partially explain sex disparities in the development of obesity and its comorbidities.
Keywords: body composition; diet-induced obesity; dietary lipid composition; reproductive health; zebrafish.
Copyright © The Author(s) 2020.
Figures
References
-
- Krishnan S, Cooper JA.. Effect of dietary fatty acid composition on substrate utilization and body weight maintenance in humans. Eur J Nutr. 2014;53(3):691–710. - PubMed
-
- Yang JH, Chang JS, Chen CL, Yeh CL, Chien YW. Effects of different amounts and types of dietary fatty acids on the body weight, fat accumulation, and lipid metabolism in hamsters. Nutrition. 2016;32(5):601–8. - PubMed
-
- Deckelbaum RJ. n-6 and n-3 Fatty acids and atherosclerosis: ratios or amounts?. Arterioscler Thromb Vasc Biol. 2010;30(12):2325–6. - PubMed
-
- Clevenger HC, Kozimor AL, Paton CM, Cooper JA. Acute effect of dietary fatty acid composition on postprandial metabolism in women. Exp Physiol. 2014;99(9):1182–90. - PubMed
Grants and funding
LinkOut - more resources
Full Text Sources
