. 2019 Jul;1(7):731-742.
doi: 10.1038/s42255-019-0083-2. Epub 2019 Jul 12.

Two-stage metabolic remodelling in macrophages in response to lipopolysaccharide and interferon-γ stimulation

Affiliations

Two-stage metabolic remodelling in macrophages in response to lipopolysaccharide and interferon-γ stimulation

Gretchen L Seim et al. Nat Metab. 2019 Jul.

Abstract

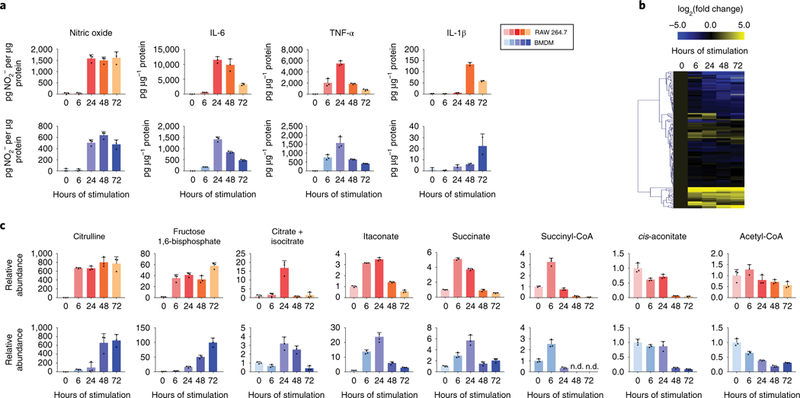
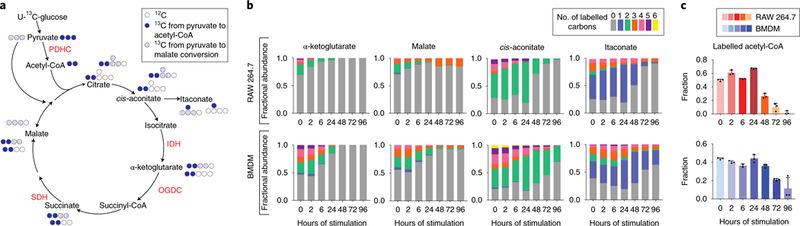
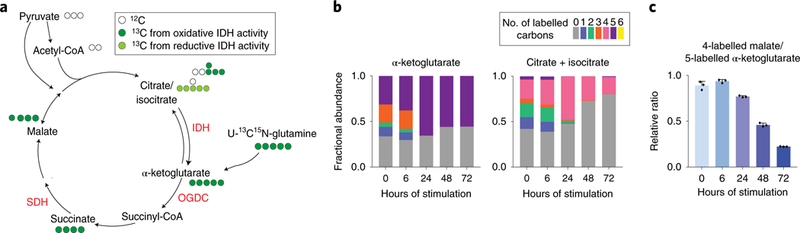
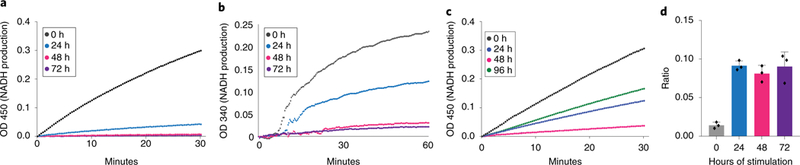
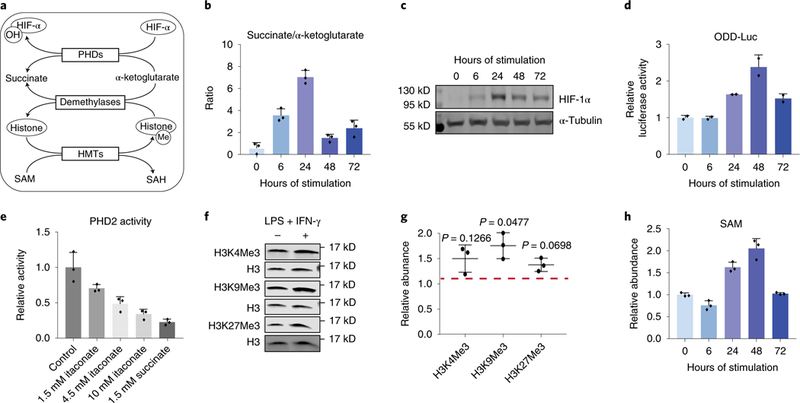
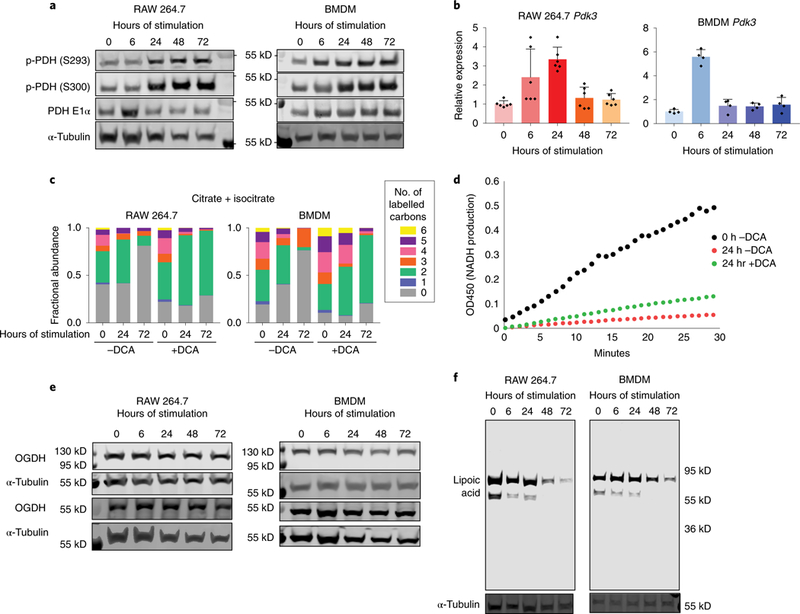
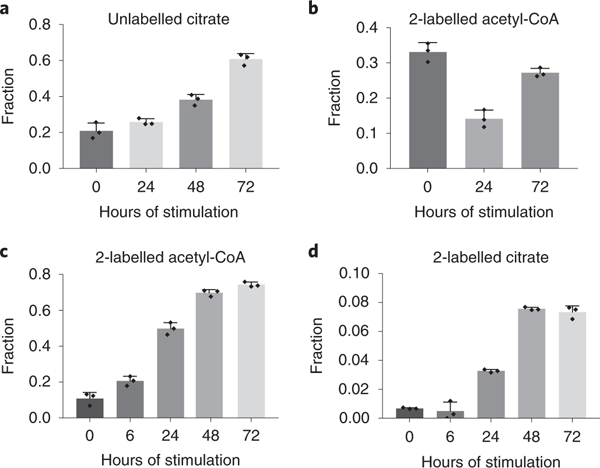
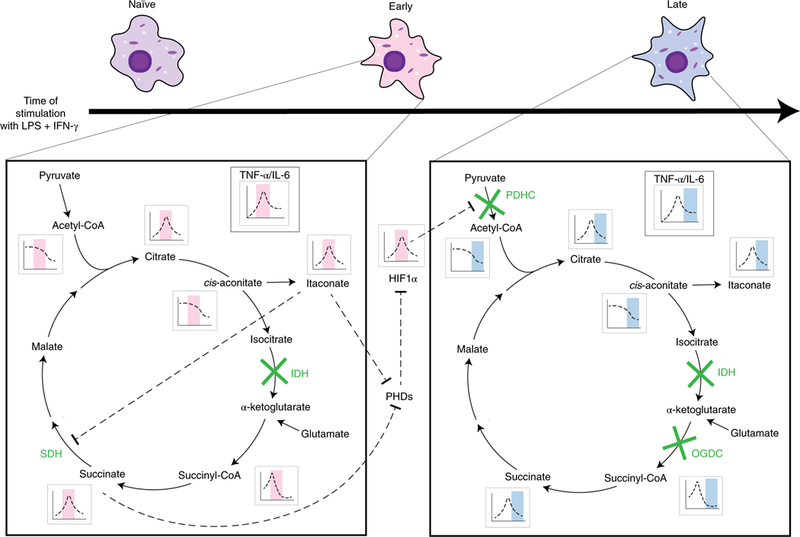
In response to signals associated with infection or tissue damage, macrophages undergo a series of dynamic phenotypic changes. Here we show that during the response to LPS and interferon-γ stimulation, metabolic reprogramming in macrophages is also highly dynamic. Specifically, the TCA cycle undergoes a two-stage remodeling: the early stage is characterized by a transient accumulation of intermediates including succinate and itaconate, while the late stage is marked by the subsidence of these metabolites. The metabolic transition into the late stage is largely driven by the inhibition of pyruvate dehydrogenase complex (PDHC) and oxoglutarate dehydrogenase complex (OGDC), which is controlled by the dynamic changes in lipoylation state of both PDHC and OGDC E2 subunits and phosphorylation of PDHC E1 subunit. This dynamic metabolic reprogramming results in a transient metabolic state that strongly favors HIF-1α stabilization during the early stage, which subsides by the late stage; consistently, HIF-1α levels follow this trend. This study elucidates a dynamic and mechanistic picture of metabolic reprogramming in LPS and interferon-γ stimulated macrophages, and provides insights into how changing metabolism can regulate the functional transitions in macrophages over a course of immune response.


Figures

Figure 1.
Figure 1.. Macrophages undergo dynamic metabolomic and functional changes in response to LPS and IFN-γ stimulation.
a. Release of cytokines and nitric oxide by RAW 264.7 cells or BMDMs stimulated with LPS and IFN-γ for indicated time. Bar graph with error bar represents mean + SD, dots represent individual values (n=3 independent samples for nitric oxide, IL-6 and TNFα; n=2 for IL-1α). b. Metabolomic changes in RAW 264.7 cells after exposed to LPS and IFN-γ for 0–72 hours, as indicated. Relative abundance of metabolite is compared to unstimulated cells and displayed on a log2 scale as a heatmap. Each box represents the mean (n=3 independent samples). c. Relative intracellular abundance of metabolites in RAW 264.7 cells and BMDMs after stimulation with LPS and IFN-γ.Data are normalized to protein content and expressed relative to abundance in unstimulated cells (0h). Bar graph with error bar represents mean + SD (n=3 independent samples), dots represent individual values. (nd indicates non-detectable)
Figure 2.
Figure 2.. Glucose labeling reveals dynamic reprogramming of TCA cycle flux in LPS and IFN-γ stimulated macrophages.
a. Schematic showing the labeling incorporation from U-13C-glucose into the TCA cycle. Possible isotopomers labeled within one TCA cycle turn are shown next to the metabolite. PDHC (pyruvate dehydrogenase complex), IDH (isocitrate dehydrogenase), OGDC (oxoglutarate dehydrogenase complex), SDH (succinate dehydrogenase). b. Labeling pattern of intracellular metabolites in RAW 264.7 cells and BMDMs after stimulation with LPS and IFN-γ. Bar graph represents the mean (n=3 independent samples). c. The fraction of acetyl-CoA containing 2-labeled acetyl moiety. The labeled fraction was determined based on measured labeling pattern of acetyl-CoA and coenzyme A, as specified in Methods. Bar graph with error bar represents mean + SD (n=3 independent samples), dots represent individual values.
Figure 3.
Figure 3.. Glutamine labeling reveals remodeling of TCA cycle flux at the late stage.
a. Schematic showing the labeling incorporation from U-13C15N-glutamine into TCA cycle. Possible isotopomers labeled within one TCA cycle turn are shown next to the metabolite. IDH (isocitrate dehydrogenase), OGDC (oxoglutarate dehydrogenase complex), SDH (succinate dehydrogenase). b. Labeling pattern of metabolites in BMDMs after stimulation with LPS and IFN-γ for indicated time. Bar graph represents the mean (n=3 independent samples). c. Ratio between the fractions of fully labeled malate to fully labeled α-ketoglutarate in BMDMs labeled with U-13C15N-glutamine, after stimulation with LPS and IFN-γ for indicated time. Bar graph with error bar represents mean + SD (n=3 independent samples), dots represent individual values.
Figure 4.
Figure 4.. Activities of PDHC and OGDC decrease in response to LPS and IFN-γ exposure.
a, b. Activity of PDHC (a) and OGDC (b) in RAW 264.7 cells cultured in presence of LPS and IFN-γ for indicated time. Activity is measured by the rate of pyruvate- or α-ketoglutarate-dependent NADH production, as specified in Methods. Unstimulated cells (0h) were cultured, without stimulation, for the same length of time as cells stimulated for 24h. Experiments were repeated twice independently with similar results. c. Activity of PDHC in RAW 264.7 cells after acute stimulation. Cells were incubated with LPS and IFN-γ for 2 hours, after which cells were washed and culture media were replaced with fresh media without stimuli. Cells were lysed for activity assay at indicated time after initial stimulation. Experiment was performed once. d. Ratio of intracellular NADH to NAD+ in RAW 264.7 cells. Bar graph with error bar represents mean + SD (n=3 independent samples), dots represent individual values.
Figure 5.
Figure 5.. Changes in key metabolite levels correlate with changes in HIF-lα protein and histone methylation.
a. The role of key metabolites in regulating HIF-1α and histone methylation. HIF-lα can be hydroxylated by PHDs, using α-ketoglutarate as the substrate and producing succinate. Hydroxylated HIF-lα is then targeted for degradation. The level of histone methylation is controlled by the competing actions of histone methyltransferases (HMTs) and demethylases. HMTs require S-adenosyl-L-methionine (SAM) as the methyl donor. Demethylation by the JmjC family of demethylases uses α-ketoglutarate as the substrate and produces succinate. b. Ratio of intracellular succinate to α-ketoglutarate in BMDM stimulated with LPS and IFN-γ for indicated time. Bar graph with error bar represents mean + SD (n=3 independent samples), dots represent individual values. c. HIF-la protein levels in BMDMs stimulated with LPS and IFN-γ for time indicated. Similar results were observed in at least 6 independent experiments. d. Luciferase activity measured in BMDMs derived from ODD-luc mice after stimulation with LPS and IFN-γ for indicated time. Data were normalized to protein content and expressed relative to the activity in unstimulated (0h) BMDMs. Bar graph with error bar represents mean + SD (n=2 independent samples), dots represent individual values. e. Activity of recombinant human PHD2 in the presence of itaconate or succinate of indicated concentration. Bar graph with error bar represents mean + SD (n=3 independent samples), dots represent individual values. f. Representative western blot of histone trimethylation marks in BMDMs stimulated with LPS and IFN-γ for 24h. Experiments were performed independently three times, and quantitation of all these blots is represented in g. Relative abundance of indicated histone trimethylation was first normalized to total H3 level, then expressed as relative change compared to unstimulated BMDMs. Center value with error bar represents mean ± standard deviation (n=3 independent samples), dots represent individual values. p-value was determined via one-sample t-test (H0: μ=1; two tailed). h. Relative abundance of intracellular SAM in BMDMs after stimulated with LPS and IFN-γ for indicated time. Bar graph with error bar represents mean + SD (n=3 independent samples), dots represent individual values.
Figure 6.
Figure 6.. Dynamic regulation of PDHC and OGDC in LPS and IFN-γ stimulated macrophages
a. PDH phosphorylation levels in RAW 264.7 cells and BMDMs stimulated with LPS and IFN-γ for indicated time. Each experiment was performed independently twice with similar results. b. Relative mRNA level of Pdk3 in RAW 264.7 cells and BMDMs stimulated with LPS and IFN-γ for indicated time. Data are normalized to expression in unstimulated macrophages (0h). Bar graph with error bar represents mean + SD, dots represent individual values. (n=6 independent samples for RAW 264.7 cells, n=3 independent samples for BMDM). c. Labeling patterns of intracellular citrate+isocitrate in RAW 264.7 cells and BMDMs incubated with U-13C glucose and stimulated with LPS and IFN-γ, with or without treatment of dichloroacetate (DCA). Data represents the mean (n=3 independent samples). d. Activity of PDHC in RAW 264.7 cells stimulated with LPS and IFN-γ for 24h or cultured for 24h without stimulation (0h). Stimulated cells were either treated with 10mM DCA from 24h prior to stimulation until the time of collection (+DCA), or treated with vehicle control (-DCA). Experiments were performed twice independently with similar results. e. Protein levels of the two splice variants of the E1 subunit of OGDC (OGDH) in RAW 264.7 cells and BMDMs stimulated with LPS and IFN-γ for indicated time. Experiment was performed once. f. Protein lipoylation state in RAW 264.7 cells and BMDMs stimulated with LPS and IFN-γ for indicated time. E2 subunit of PDHC is ~69 kD and E2 subunit of OGDC is ~55 kD. Experiments were performed independently three times in RAW 264.7 cells and twice in BMDMs with similar results.
Figure 7.
Figure 7.. Alternative substrate utilization in LPS and IFN-γ stimulated macrophages.
a. Fraction of citrate that remains unlabeled in RAW 264.7 cells stimulated with LPS and IFN-γ for indicated time, after 24h incubation with both U-13C-glucose and U-13C15N-glutamine. Bar graph with error bar represents mean + SD (n=3 independent samples), dots represent individual values. b. Fraction of 2-labeled acetyl-CoA in RAW 264.7 cells stimulated with LPS and IFN-γ for indicated time, after 24h incubation with 40μM BSA-conjugated U-13C-palmitic acid. Bar graph with error bar represents mean + SD (n=3 independent samples), dots represent individual values. c,d. Fraction of 2-labeled acetyl-CoA (c) and citrate (d) in RAW 264.7 cells stimulated with LPS and IFN-γ for indicated time, after 24h incubation with 500μM U-13C-acetate. Bar graph with error bar represents mean + SD (n=3 independent samples), dots represent individual values.
Figure 8.
Figure 8.. Two-stage remodeling of TCA cycle in LPS and IFN-γ stimulated macrophages.
During the early stage of the response to LPS and IFN-γ stimulation, isocitrate dehydrogenase (IDH) is blocked, upstream metabolite citrate/isocitrate accumulates, and TCA flux is diverted to the production of itaconate, which competitively inhibits succinate dehydrogenase (SDH), leading to the buildup of succinate and succinyl-CoA. The changes in metabolite levels, especially succinate and itaconate accumulation, leads to increased level of HIF-1α via the inhibition of prolyl hydroxylases (PHDs). HIF-1α stabilization results in increased Pdk3 transcription, which partially mediates reduced flux through pyruvate dehydrogenase complex (PDHC). In the late stage, substantial inhibition of PDHC contributes to the reduction in glucose- driven acetyl-CoA, citrate, cis-aconitate and itaconate production, and inhibition of OGDC contributes to the reduction in succinyl-CoA and succinate production. The levels of these metabolites reduce drastically, and HIF-1α level normalizes.

References

    1. Janeway CA & Medzhitov R Innate immune recognition. Annu. Rev. Immunol. 20, 197–216 (2002). - PubMed
    1. Mosser DM & Edwards JP Exploring the full spectrum of macrophage activation. Nat. Rev. Immunol. 8, 958–969 (2008). - PMC - PubMed
    1. Liew FY, Xu D, Brint EK & O’Neill LAJ Negative regulation of toll-like receptor-mediated immune responses. Nat. Rev. Immunol. 5, 446–458 (2005). - PubMed
    1. Ivashkiv LB Inflammatory signaling in macrophages: Transitions from acute to tolerant and alternative activation states. Eur. J. Immunol. 41, 2477–2481 (2011). - PMC - PubMed
    1. Foster SL, Hargreaves DC & Medzhitov R Gene-specific control of inflammation by TLR-induced chromatin modifications. Nature 447, 972–978 (2007). - PubMed

Publication types