. 2019 Aug 1;2(5):342-352.
doi: 10.1021/acsptsci.9b00037. eCollection 2019 Oct 11.

Antibody-Mediated Delivery of VEGFC Ameliorates Experimental Chronic Colitis

Affiliations

Antibody-Mediated Delivery of VEGFC Ameliorates Experimental Chronic Colitis

Carlotta Tacconi et al. ACS Pharmacol Transl Sci. .

Abstract

Crohn's disease (CD) and ulcerative colitis (UC) are two distinct forms of inflammatory bowel disease (IBD) characterized by an expanded lymphatic network with impaired functionality both in mouse models and in human patients. In this study, we investigated whether targeted delivery of the pro-lymphangiogenic vascular endothelial growth factor C (VEGFC) to the site of inflammation may represent a new, clinically feasible strategy for treating IBD. To achieve targeting of inflamed tissue, we developed a fusion protein consisting of human VEGFC fused to the F8 antibody (F8-VEGFC), which specifically binds to the extradomain A (EDA) of fibronectin, a spliced isoform almost exclusively expressed in inflamed tissues. The therapeutic activity of intravenously administered F8-VEGFC, compared to a targeted construct lacking VEGFC (F8-SIP), was investigated in a mouse model of dextran sodium sulfate (DSS)-induced colitis. The presence of EDA fibronectin was detected in both human and mouse inflamed colon tissue. Biodistribution studies of radiolabeled F8-VEGFC revealed a specific accumulation of the antibody in the colon of DSS-administered mice, as compared to an untargeted VEGFC fusion protein (KSF-VEGFC) (binding the irrelevant hen egg lysozyme antigen). Systemic treatment with F8-VEGFC significantly reduced the clinical and histological signs of inflammation, expanded the lymphatic vascular network, reduced the density of immune cells, and also decreased the expression of inflammatory cytokines in the inflamed colon. Overall, these results reveal that administration of F8-VEGFC represents a novel and promising approach for the treatment of IBD.


Conflict of interest statement

The authors declare the following competing financial interest(s): D.N. is a shareholder and board member of Philogen, a biotech company which shares with ETH Zurich commercialization rights for F8-VEGFC. M.D., D.N., and S.S. are inventors on a pending patent for F8-VEGF-C. The other authors declare no competing financial interest.

Figures

Figure 1
Figure 1
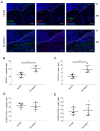
EDA-FN is increased in inflamed colon tissue. (A) EDA-FN expression levels were assessed in healthy (n = 6), ulcerative colitis (UC, n = 24), and Crohn’s disease (CD, n = 19) endoscopic colonic biopsies, and absolute values for the probe 212464_s_at, recognizing EDA-FN, are shown. (B) Representative immunofluorescence pictures of naïve (CTRL, n = 3) and inflamed colons at day 24 post DSS administration (DSS, n = 3) stained for CD31 (red), EDA-FN (green), and Hoechst (blue). Scale bar: 100 μm. All data are presented as mean ± SD. Adjusted p value *p < 0.05, **p < 0.01.
Figure 2
Figure 2
F8-VEGFC preferentially localizes to the inflamed colon tissue. (A) Autoradiography of radioiodinated KSF-VEGFC and F8-VEGFC in inflamed (right, DSS) compared to uninflamed (left, CTRL) colon. (B) Quantification of hot-averaged values in C expressed as a fold change (FC) relative to control KSF-VEGFC treated mice (n = 5 mice per group). (C) Quantitative biodistribution analysis of radioiodinated F8-VEGFC and KSF-VEGFC of colon, liver, lung, lung, spleen, heart, kidney, and small intestine in mice with uninflamed or inflamed colons, expressed as percent of injected dose per gram of tissue normalized over control KSF-VEGFC-injected mice (n = 5 mice per group). All data are presented as mean ± SD. Statistical significance was determined by two-way ANOVA with Sidak’s correction for multiple comparisons. Asterisks indicate statistical significance with p < 0.05 (*), p < 0.01 (**), and p < 0.001 (***).
Figure 3
Figure 3
F8-VEGFC ameliorates chronic DSS-induced colitis in mice. (A) Disease activity index (DAI) score of mice treated at day 24 from the beginning of the study by intravenous injections (i.v.) with F8-SIP or F8-VEGFC every other day (n = 8 per group), as indicated by the black arrows. (B) Total colon length was measured with a ruler at the end point on day 32 (n ≥ 8 per group). (C) Representative H&E stained sections of F8-SIP- (left) and F8-VEGFC- (right) treated mice. Scale bars: 100 μm. (D) Histopathological colitis scoring system: evaluation of inflammation severity, epithelial hyperplasia, mucosal ulceration, and extent of area involved along the distal and rectal part of the colon (n = 8 per group). All data are presented as mean ± SD. Statistical significance was determined by two-way ANOVA with Sidak’s correction for multiple comparisons or by two-tailed Student’s t test. Asterisks indicate statistical significance with p < 0.05 (*) and p < 0.01 (**).
Figure 4
Figure 4
F8-VEGFC induces expansion of the lymphatic vasculature in chronic colitis. (A) Representative pictures of immunofluorescence labeling of the inflamed colon after F8-SIP (upper panels) or F8-VEGFC (lower panels) treatment for LYVE-1 (green), CD31 (red), and Hoechst (blue). Dotted white lines mark the separation between the mucosa (M) and the submucosa (SM). Scale bars: 100 μm. LYVE-1 + LVs were quantified in terms of number (B) and percentage of stained area (C) in 5–8 fields per colon per mouse (n = 5 per group). CD31+LYVE-1- blood vessels were quantified in terms of number (D) and percentage of stained area (E) in 5–8 fields per colon per mouse (n = 5 per group). All data are presented as mean ± SD. Statistical significance was determined by two-tailed Student’s t test. Asterisks indicate statistical significance with p < 0.01 (**).
Figure 5
Figure 5
F8-VEGFC reduces macrophage infiltration in chronically inflamed colons. Flow cytometry quantification of total leukocytes pregated on single living cells. (A) Percentage of total CD45+ cells. (B) Representative flow cytometry plots of live cells pregated for CD45 positivity of dendritic cells (DC) and macrophages in inflamed colons of F8-SIP (left panel) and F8-VEGFC (right panel) treated mice. (C) Percentage of F4/80+ macrophages of total CD45+ cells (n = 8 per group). (D) Percentage of CD11c+F4/80- dendritic cells of total CD45+ (n = 8 per group). (E) Percentage of CD11c-F480-CD11b+ myeloid cells of total CD45+ cells (n = 8 per group). (F) Representative pictures of immunofluorescence staining of the inflamed colon after F8-SIP (left panel) or F8-VEGFC (right panel) treatment for F4/80 (green) and Hoechst (blue). Scale bars: 100 μm. (G) Percentage of F4/80-positive staining area in 5–8 fields per colon per mouse (n = 5 per group).
Figure 6
Figure 6
F8-VEGFC reduces lymphocyte infiltration in chronically inflamed colons. FACS quantification of respective cells pregated on single living CD45 positive cells. (A) Percentage of γδ T cells of total CD45+ cells (n = 8 per group). (B) Percentage of CD8 T cells of total CD45+ cells (n = 8 per group). (C) Percentage of CD4 T cells of total CD45+ cells (n = 8 per group). (D) Representative flow cytometry plots of live cells pregated for CD45 positivity of T regulatory cells (Treg) in inflamed colons of F8-SIP- (left panel) or F8-VEGFC- (right panel) treated mice. (E) Percentage of T regulatory cells of total CD4 T cells (n = 8 per group). All data are presented as mean ± SD. Statistical significance was determined by two-tailed Student’s t test. Asterisks indicate statistical significance with p < 0.05 (*) and p < 0.01 (**).
Figure 7
Figure 7
Targeted delivery of VEGFC reduces inflammatory cytokine expression. Colonic expression of Tnfa (A), Ifng (B), Cxcl10 (C), Il1b (D), Nos2 (E), and Il10 (F) mRNA as examined by qRT-PCR in F8-SIP- and F8-VEGFC-injected mice (n ≥ 8 per group). Rplp0 was used as an endogenous reference gene. Comparison between experimental groups was done by the 2–ΔCT method. All data are presented as mean ± SEM. Statistical significance was determined by two-tailed Student’s t test. Asterisks indicate statistical significance with p < 0.05 (*).

References

    1. Cueni L. N.; Detmar M. (2008) The lymphatic system in health and disease. Lymphatic Res. Biol. 6, 109–122. 10.1089/lrb.2008.1008. - DOI - PMC - PubMed
    1. Geleff S.; Schoppmann S. F.; Oberhuber G. (2003) Increase in podoplanin-expressing intestinal lymphatic vessels in inflammatory bowel disease. Virchows Arch 442, 231–237. - PubMed
    1. Pedica F.; Ligorio C.; Tonelli P.; Bartolini S.; Baccarini P. (2008) Lymphangiogenesis in Crohn’s disease: an immunohistochemical study using monoclonal antibody D2–40. Virchows Arch. 452, 57–63. 10.1007/s00428-007-0540-2. - DOI - PubMed
    1. Van Kruiningen H. J.; Hayes A. W.; Colombel J. F. (2014) Granulomas obstruct lymphatics in all layers of the intestine in Crohn’s disease. Apmis 122, 1125–1129. 10.1111/apm.12268. - DOI - PubMed
    1. Tonelli F.; Giudici F.; Liscia G. (2012) Is lymphatic status related to regression of inflammation in Crohn’s disease?. World J. Gastrointest Surg 4, 228–233. 10.4240/wjgs.v4.i10.228. - DOI - PMC - PubMed

LinkOut - more resources