. 2019 Nov 15;2(6):442-452.
doi: 10.1021/acsptsci.9b00062. eCollection 2019 Dec 13.

In Vitro to in Vivo Translation of Allosteric Modulator Concentration-Effect Relationships: Implications for Drug Discovery

Affiliations

In Vitro to in Vivo Translation of Allosteric Modulator Concentration-Effect Relationships: Implications for Drug Discovery

Karen J Gregory et al. ACS Pharmacol Transl Sci. .

Abstract

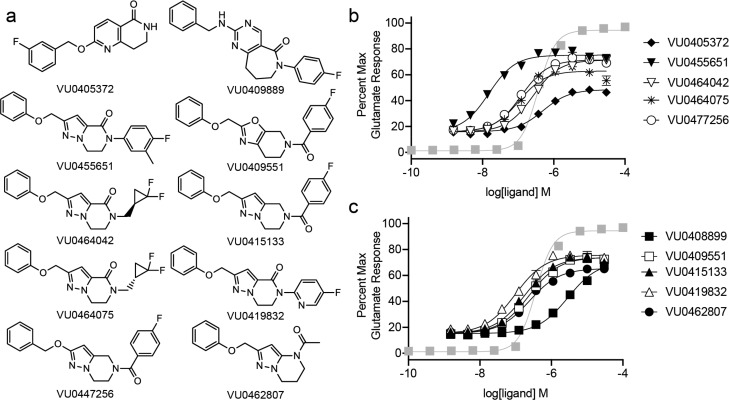
Allosteric modulation of GPCRs represents an increasingly explored approach in drug development. Due to complex pharmacology, however, the relationship(s) between modulator properties determined in vitro with in vivo concentration-effect phenomena is frequently unclear. We investigated key pharmacological properties of a set of metabotropic glutamate receptor 5 (mGlu5) positive allosteric modulators (PAMs) and their relevance to in vivo concentration-response relationships. These studies identified a significant relationship between in vitro PAM cooperativity (αβ), as well as the maximal response obtained from a simple in vitro PAM concentration-response experiment, with in vivo efficacy for reversal of amphetamine-induced hyperlocomotion. This correlation did not exist with PAM potency or affinity. Data across PAMs were then converged to calculate an in vivo concentration of glutamate putatively relevant to the mGlu5 PAM mechanism of action. This work demonstrates the ability to merge in vitro pharmacology profiles with relevant behavioral outcomes and also provides a novel method to estimate neurotransmitter concentrations in vivo.


Conflict of interest statement

The authors declare no competing financial interest.

Figures

Figure 1
Figure 1
Modulator potency curves for enhancement of glutamate stimulation of mGlu5 iCa2+mobilization. (a) Structures of a validation set of 10 mGlu5 PAMs. (b, c) Modulation of glutamate stimulation of iCa2+ mobilization in HEK cells expressing the rat mGlu5a. Increasing concentrations of indicated modulator were added prior to a concentration of glutamate that elicits a 20% maximal response (b, c). The glutamate control curve is shown in gray squares. Data were normalized to the maximal glutamate (1 mM) response and fit with a 4-parameter logistic equation. Data are mean ± s.e.m. of three independent determinations performed in triplicate.
Figure 2
Figure 2
Simulating allosteric modulation of functional responses and the impact of different operational parameters on modulator potency curves. For all simulations, the orthosteric agonist was defined by pKA = 6, log τA = 1, where basal = 0, Em = 100, and n = 1. In these simulations, the maximum response to orthosteric agonist approaches the system Em. The parameters governing the allosteric modulator are noted in the figure for each simulation; in all instances, affinity modulation was neutral (log α = 0) and allosteric agonism was negligible (log τB = −100). (a) Simulating the effect of a pure PAM with different degrees of efficacy cooperativity on the concentration–response curve to an orthosteric agonist. (b) From the simulations in panel a, we plotted the PAM potency at the EC20 orthosteric agonist response. (c) We performed similar simulations where log β values were held constant (equal to 1), but the modulator affinity (pKB) was changed to show the impact on PAM potency.
Figure 3
Figure 3
mGlu5 PAMs exhibit dose-dependent reversal of AHL that correlates with increasing total and unbound exposure in brain and plasma. (a) % AHL reversal was calculated based on the total number of beam breaks (Supplemental Figures 2 and 3) from n = 5–13. Brain and plasma concentrations were determined at the conclusion of each experiment via LC–MS/MS (Supplemental Figure 4). Log [compound] was plotted versus the % AHL reversal, and data (all are mean ± s.e.m.) were fitted using a three-parameter logistical equation. EC50 values (horizontal black dotted line) in each of the four matrices (total brain, black vertical dashed line; unbound brain, blue vertical dashed line; total plasma, green vertical dashed line; and unbound plasma, red vertical dashed line) were calculated (Table 2 and Supplemental Tables 1–3). (b–d) Correlations are shown for the calculated EC50 value versus the in vitro potency (pEC50, b), the unliganded affinity (log KB, c), and cooperativity (log αβ, d). R2 and p values for each regression line are listed in Supplemental Table 4.
Figure 4
Figure 4
The concentration needed to reverse AHL by 35% [AHL35] is significantly correlated with the in vitro determined cooperativity (a–d) and% maximal glutamate response (e–h) across all matrices. Values are listed in Table 2 and Supplemental Tables 1–3. In each panel the red data point corresponds to VU0360172. The reported R2 and p values on these graphs exclude VU0360172. When VU0360172 is included in the regression analyses of log αβ, for total brain R2 = 0.447 and p = 0.0244; for unbound brain R2 = 0.360 and p = 0.051; for total plasma R2 = 0.502 and p = 0.0146; for unbound plasma R2 = 0.373 and p = 0.0459. Including VU0360172 for analyses of PAM EMAX values, for total brain R2 = 0.580 and p = 0.0065; for unbound brain R2 = 0.405 and p = 0.035; for total plasma R2 = 0.619 and p = 0.0041; for unbound plasma R2 = 0.372 and p = 0.047.
Figure 5
Figure 5
Extrapolation of glutamate concentrations from combined in vitro and in vivo data. (a) From progressive fold shift interactions with glutamate (Supplemental Figure 1), the data were transformed to plot the concentration of glutamate versus the PAM concentration. The PAM concentration required to reverse AHL by 35% is indicated by the vertical lines for each of the four matrices (solid black, total brain; dotted black, total plasma; blue, unbound brain; red, unbound plasma). (b) For each matrix, a glutamate concentration–response curve was generated for the 35% reversal concentration (as shown for VU0419832); the EC50 of these curves for each PAM were then averaged for the four matrices and are plotted in panel c. One way ANOVA with a Tukey’s post hoc test on averaged pEC50 values showed VU0408899 was significantly different (p < 0.05) from VU0455651, VU0447256, VU0464042, whereas VU0409551 was significantly different from VU0447256 and VU0464042.

Similar articles

Cited by

References

    1. Lindsley C. W.; Emmitte K. A.; Hopkins C. R.; Bridges T. M.; Gregory K. J.; Niswender C. M.; Conn P. J. (2016) Practical Strategies and Concepts in GPCR Allosteric Modulator Discovery: Recent Advances with Metabotropic Glutamate Receptors. Chem. Rev. 116, 6707–6741. 10.1021/acs.chemrev.5b00656. - DOI - PMC - PubMed
    1. Leach K.; Sexton P. M.; Christopoulos A. (2007) Allosteric GPCR modulators: taking advantage of permissive receptor pharmacology. Trends Pharmacol. Sci. 28, 382–389. 10.1016/j.tips.2007.06.004. - DOI - PubMed
    1. Christopoulos A. (2014) Advances in G protein-coupled receptor allostery: from function to structure. Mol. Pharmacol. 86, 463–478. 10.1124/mol.114.094342. - DOI - PubMed
    1. Hall D. A. (2013) Application of receptor theory to allosteric modulation of receptors. Prog. Mol. Biol. Transl Sci. 115, 217–290. 10.1016/B978-0-12-394587-7.00006-3. - DOI - PubMed
    1. Gregory K. J.; Sexton P. M.; Christopoulos A. (2010) Overview of receptor allosterism. Curr. Protoc Pharmacol Chapter 1, Unit 1.2110.1002/0471141755.ph0121s51. - DOI - PubMed