. 2018 Jan-Mar;1(1):104.
doi: 10.31531/2581-4745.1000104. Epub 2018 Mar 30.

Thyroid Hormone Enhances Neurite Outgrowth in Neuroscreen 1 Cells

Affiliations

Thyroid Hormone Enhances Neurite Outgrowth in Neuroscreen 1 Cells

Oldham Ce et al. Int J Biomed Investig. 2018 Jan-Mar.

Abstract

Objectives: Alzheimer's disease (AD) is a neurodegenerative disorder that affects millions of individuals. Moreover, hypothyroidism has been identified as one of the risk factors that may contribute to the development of AD. Here, we investigated whether there was a correlation among expression levels of proteins involved in the formation of AD lesions, neurite outgrowth, and thyroid hormone levels.

Methods: Cells were grown in media supplemented with different levels of 3,5,3'-triiodothyronine (T3) and then processed for neurite outgrowth and to prepare RNA samples. RNA samples were analysed using quantitative real-time PCR. Protein levels were measured using in cell-Western blotting analysis.

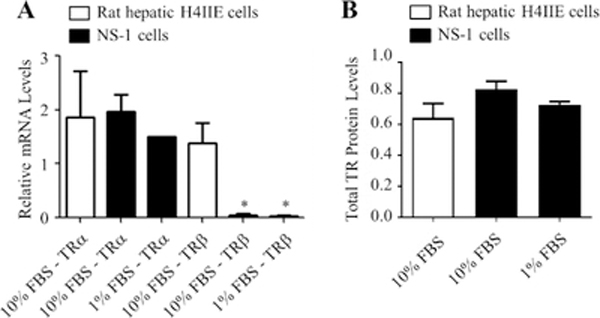
Results: By using neurite outgrowth studies, it was demonstrated that T3 treatment enhanced neurite outgrowth in NS-1 cells in a time- and dose-dependent manner. Quantitative real-time PCR studies further confirmed that NS-1 cells expressed substantial levels of TRα and significantly less TRβ, either of which could be responsible for the T3-dependent effects on neurite outgrowth. Although the overall tau protein expression was not affected in response to T3 treatment, the splicing of tau exon 10 was impacted in the direction of producing more tau molecules that excluded the exon (tau 3R).

Conclusion: The results of this study are critical not only to understand the probable link between hypothyroidism and AD but also in providing the basis for future prevention and treatment of AD in hypothyroid patients.

Keywords: Alzheimer’s disease; Amyloid precursor protein; Exon 10 splicing; NS-1 cell; Tau; Thyroid hormones.


Conflict of interest statement

Conflict of Interest None declared.

Figures

Figure 1:
Figure 1:
Effects of different media on neurite outgrowth. NS-1 cells were incubated in the indicated media for 24 and 48 h before microscope images were taken for neurite outgrowth evaluation. (A) Data are presented as a percentage mean of cells with neurites ± standard error of the mean (SEM) for n=15 for all the conditions. “*” (p<0.05) and “**” (p<0.01) were obtained by comparing to the 1% FBS 24 hrs group using ANOVA followed by Student–Newman–Keuls multiple comparison tests. (B) Morphology of the NS-1 cells after 48 h in 10% FBS medium. This experiment has been repeated for at least 5 times.
Figure 2:
Figure 2:
Effects of hypothyroidism on neurite outgrowth in NS-1 cells. Cells were incubated in the indicated media for 72 h before evaluation of neurite outgrowth. (A) Typical microscope images of cells exposed to the two media. These experiments were repeated at least 4 times. (B) Quantitated results from cell viability studies using nuclei green stain as described under Materials and Methods. The data are presented as a percentage mean of viable cells ± SEM (n=8 for 1% FBS; n=16 for 1% THD). (C) Data are presented as a percentage mean of cells with neurites ± SEM for n=15 for all the conditions. “*” (p<0.05) and “**” (p<0.01) were obtained by comparing the two groups using the Student’s t-test.
Figure 3:
Figure 3:
Effects of 3,5,3’-triiodothyronine (T3) on neurite outgrowth in NS-1 cells. (A) Dose-response studies. Cells were incubated in 1% THD media with increasing amounts (nM) of T3 for 72 h before evaluation of neurite outgrowth. The data are presented as a percentage mean of cells with neurites ± SEM. “*” (p<0.05), “***” (p<0.001) and “****” (p<0.0001) were obtained by comparing to the group without T3 using ANOVA followed by Student–Newman–Keuls multiple comparison tests. (B) Time course studies. Cells were incubated in 1% THD media ± 3 nM T3 for 24, 48, and 72 h before evaluation of neurite outgrowth. The data are presented as a percentage mean of cells with neurites ± SEM. “*” (p<0.05) was obtained by comparing to the 72 h group without T3 using the Student’s t-test. Numbers within parenthesis inside each bar correspond to the replicates (“n”) for each group.
Figure 4:
Figure 4:
Effects of T3 and NGF on neurite outgrowth in NS-1 cells. Cells were incubated in 1% THD medium in the presence of 3 nM of T3, and 50 ng/mL NGF for 72 h and assayed for neurite outgrowth. (A) Typical images of cells exposed to the different treatments. These experiments were repeated at least three times. (B) Data are presented as a percentage mean of cells with neurites ± SEM. “*” (p<0.05) and “**” (p<0.01) were obtained by comparing to the 1% THD (control) group using ANOVA followed by Student–Newman–Keuls multiple comparison tests. Numbers within parenthesis inside each bar correspond to the replicates (“n”) for each group.
Figure 5:
Figure 5:
Expression of thyroid hormone receptors (TRs) in NS-1 and hepatic H4IIE cells. Cells were incubated in 10% or 1% FBS medium for 72 h. (A) RNA was isolated, reverse-transcribed and analyzed using quantitative real-time polymerase chain reaction (qRT-PCR). Data are presented as relative mRNA mean level ± SEM for n=3 for all the conditions. “*” (p<0.05) was obtained by comparing to the H4IIE-10% FBS-TRβ using ANOVA followed by Student–Newman–Keuls multiple comparison tests. (B) Protein levels were quantitated using in-cell Western assays. Data are presented as relative protein mean levels ± SEM. This experiment was performed in sextuplicate and repeated 3 times.
Figure 6:
Figure 6:
Effects of T3 on the expression of AA4 and Aβ in 1% FBS. Cells were incubated in the indicated medium in the presence of 10 nM of T3 for 72 h. (A) Total RNA was isolated, reverse transcribed and subjected to qRT-PCR. Data are presented as relative mRNA mean levels ± SEM for n=13. The p-value was obtained using the Student’s t-test. (B) Protein levels were quantitated using in-cell Western analysis. Data are presented as relative protein mean levels ± SEM for n=4. The p-values were achieved by comparing to 1% FBS using ANOVA followed by Student–Newman–Keuls multiple comparison tests.
Figure 7:
Figure 7:
Effects of T3 on the expression of tau. (A) H4IIE and NS-1 cells were incubated in 10% FBS medium for 72 h. Total RNA was isolated, reverse transcribed, and subjected to qRT-PCR. “*” (p<0.05) was obtained by comparing to H4IIE using the Student’s t-test. This experiment was performed in triplicate and repeated three times. (B) NS-1 cells were incubated in 1% FBS medium alone or the presence of 10 nM of T3 for 72 h. The analysis of the RNA samples was done as described in (A). The data are presented as relative mRNA mean levels ± SEM for n=8. (C) NS-1 cells were incubated in 1% FBS medium alone or the presence of 10 nM T3 for 72 h. Protein levels were quantitated using in-cell Western analysis. The data are presented as relative protein mean levels ± SEM for n=4.
Figure 8:
Figure 8:
Effects of T3 on the splicing of tau exon 10. (A) Total RNA was prepared from cells treated with 1% THD ± 3 nM T3 and analyzed as described above. The data are presented as relative mRNA mean levels ± SEM for n=8. “*” (p<0.05) was obtained using ANOVA followed by Student–Newman–Keuls multiple comparison tests. (B) In-cell Western analysis of tau protein in cells treated with increasing amounts of T3 and 1% THD. The data are presented as relative protein mean levels ± SEM for n=21.
Figure 9:
Figure 9:
The hypothetical link between hypothyroidism, NGF maturation and function, APP synthesis and processing, and tau protein expression. (A) In the presence of T3, proNGF gets converted to its active form, NGF, which mainly activates the TrkA receptor. Activation of the TrkA receptor by NGF leads to neurite outgrowth and survival as well as inhibition of β-secretase resulting in lower Aβ levels. Also, T3 leads to activation of the TRα receptor which in turns reduces APP transcription and alters the splicing of tau exon 10. It is possible that changes in the ratio of tau 4R/3R contribute to neurite outgrowth and survival promoted by activation of the TrkA receptor by NGF. (B) In the hypothyroid condition, NGF synthesis is impaired preventing the positive effects of activating the TrkA receptor. Instead, the high levels of proNGF enhance signalling via the p75NTR receptor which leads to apoptosis and neural degeneration. The lack of T3 also leads to an increase in transcription of APP and changes in tau exon 10 splicing. Furthermore, the activity of β-secretase is no longer inhibited. Consequently, the Aβ levels increase resulting in the formation of Aβ plaques.

Similar articles

Cited by

References

    1. Mayeux R, Stern Y. Epidemiology of Alzheimer Disease. Cold Spring Harb perspect Med 2012; 2: a006239. - PMC - PubMed
    1. Alzheimer’s Association. 2016 Alzheimer’s disease facts and figures. Alzheimer’s Dement 2016; 12: 459–509. - PubMed
    1. Tozlu M, Cankurtaran M, Yavuz BB, et al. Functional Disability in Alzheimer Disease: A Validation Study of the Turkish Version of the Disability Assessment for Dementia Scale. J Geriat Psych Neurol 2014; 27: 237–246. - PubMed
    1. Takizawa C, Thompson PL, van Walsem A, et al. Epidemiological and economic burden of Alzheimer’s disease: a systematic literature review of data across Europe and the United States of America. J Alzheimers Dis 2015; 43: 1271–1284. - PubMed
    1. Hardy J, Selkoe DJ. The Amyloid Hypothesis of Alzheimer’s Disease: Progress and Problems on the Road to Therapeutics. Science 2002; 297: 353–356. - PubMed

LinkOut - more resources