. 2020 Apr 14;4(7):1325-1339.
doi: 10.1182/bloodadvances.2019000965.

Coexpression of FOXP3 and a Helios isoform enhances the effectiveness of human engineered regulatory T cells

Affiliations

Coexpression of FOXP3 and a Helios isoform enhances the effectiveness of human engineered regulatory T cells

Amara Seng et al. Blood Adv. .

Abstract

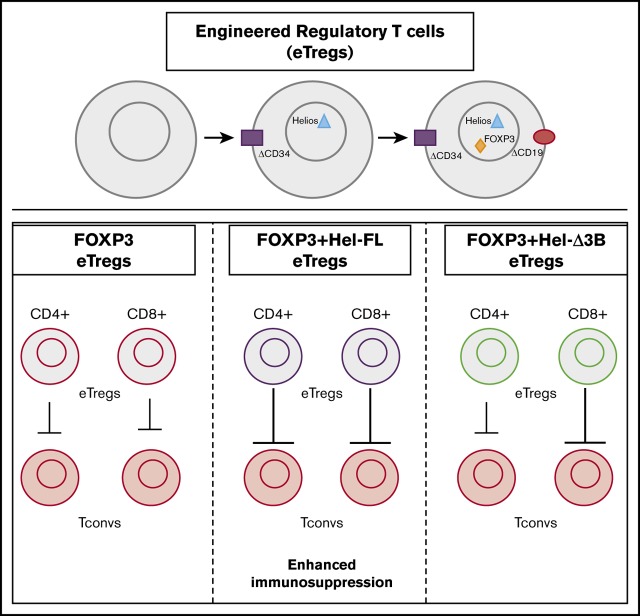
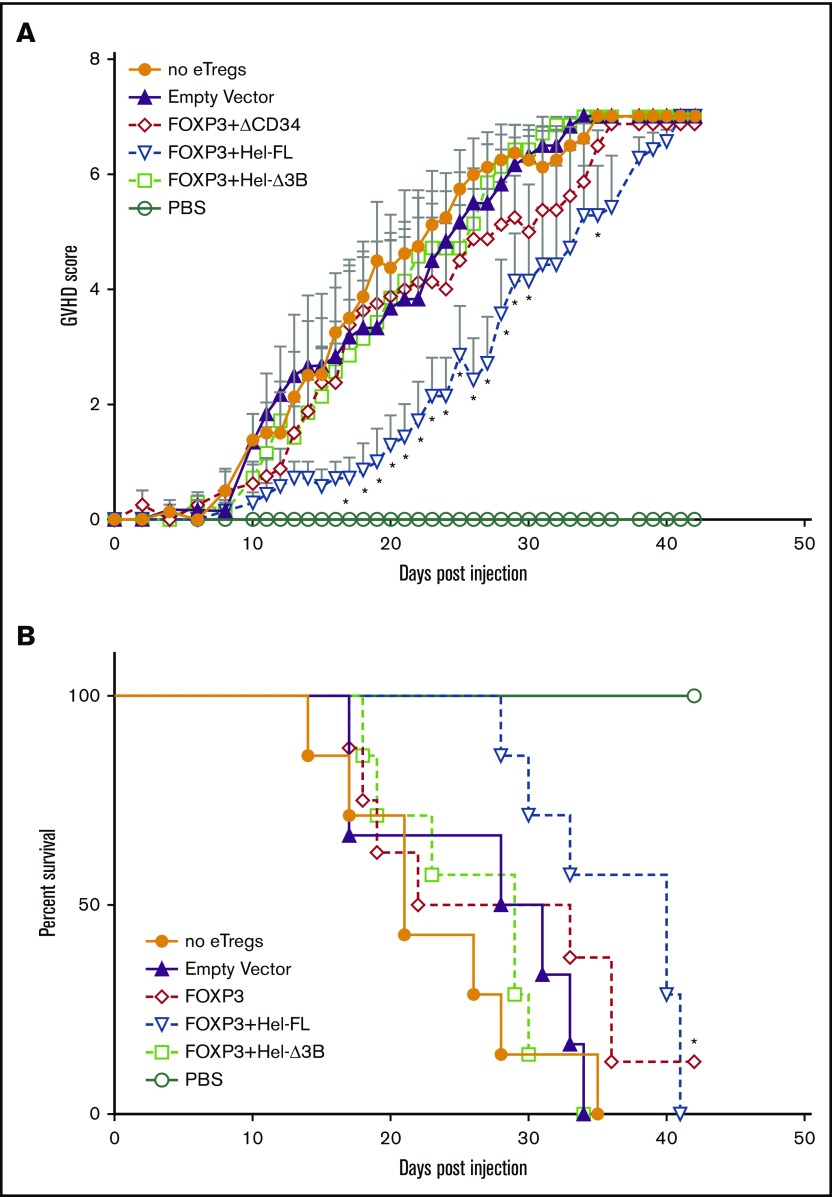
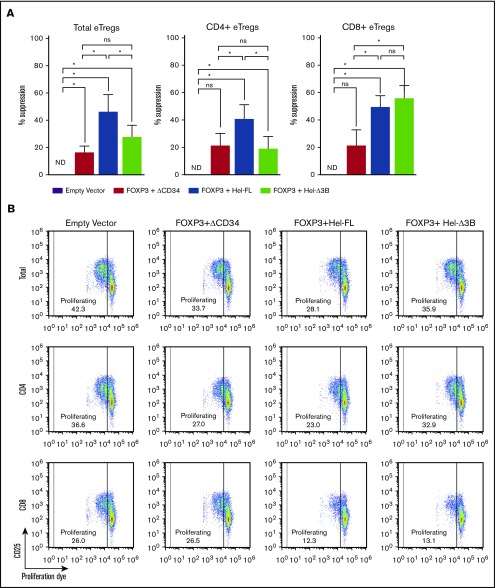
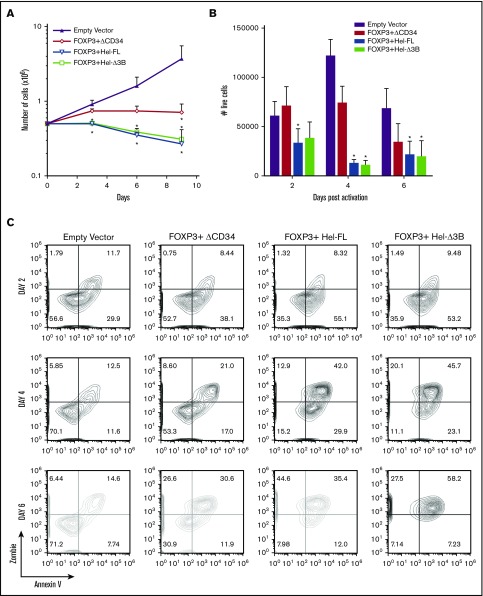
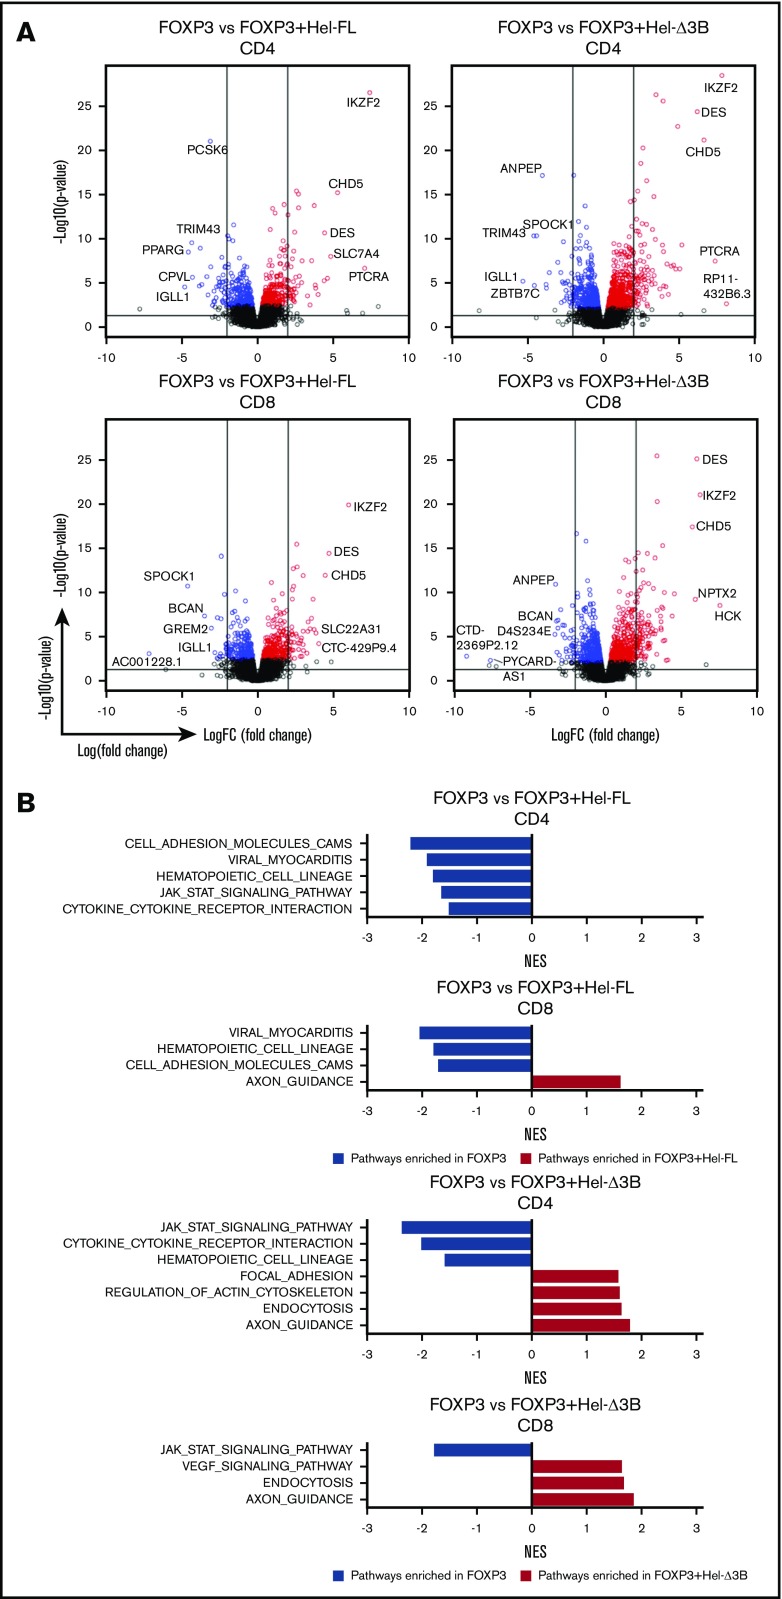
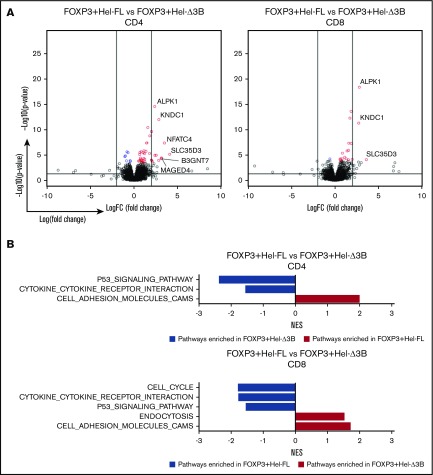
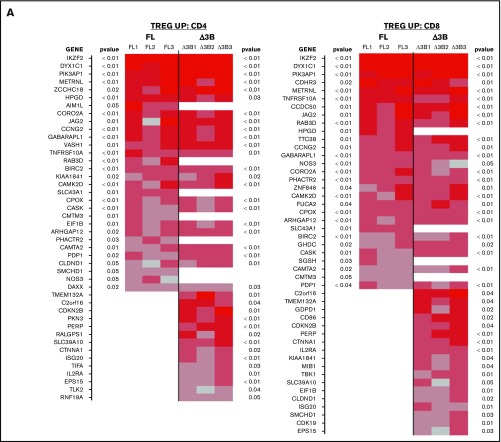
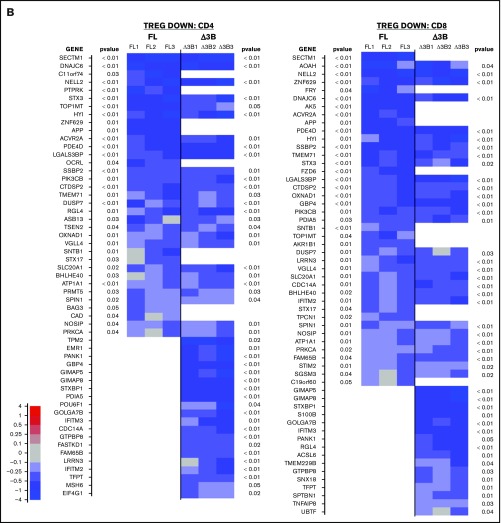
Regulatory T cells (Tregs) are a subset of immune cells that suppress the immune response. Treg therapy for inflammatory diseases is being tested in the clinic, with moderate success. However, it is difficult to isolate and expand Tregs to sufficient numbers. Engineered Tregs (eTregs) can be generated in larger quantities by genetically manipulating conventional T cells to express FOXP3. These eTregs can suppress in vitro and in vivo but not as effectively as endogenous Tregs. We hypothesized that ectopic expression of the transcription factor Helios along with FOXP3 is required for optimal eTreg immunosuppression. To test this theory, we generated eTregs by retrovirally transducing total human T cells (CD4+ and CD8+) with FOXP3 alone or with each of the 2 predominant isoforms of Helios. Expression of both FOXP3 and the full-length isoform of Helios was required for eTreg-mediated disease delay in a xenogeneic graft-versus-host disease model. In vitro, this corresponded with superior suppressive function of FOXP3 and full-length Helios-expressing CD4+ and CD8+ eTregs. RNA sequencing showed that the addition of full-length Helios changed gene expression in cellular pathways and the Treg signature compared with FOXP3 alone or the other major Helios isoform. Together, these results show that functional human CD4+ and CD8+ eTregs can be generated from total human T cells by coexpressing FOXP3 and full-length Helios.


Conflict of interest statement

Conflict-of-interest disclosure: M.A.M. is a consultant for Johnson & Johnson Global Services for topics unrelated to this work. M.A.M., A.S., R.T.F., and T.M.Y. have filed a patent provisional based on the work in this publication. The remaining authors declare no competing financial interests.

Figures

None
Graphical abstract
Figure 1.
Figure 1.
Generation of human eTregs by transduction with FOXP3 and/or Helios. (A) Illustration of SFG retroviral vector containing genes of interest and transduction surface markers. (B-E) Transduction marker (ΔCD34 and ΔCD19), Helios, and FOXP3 protein expression in eTregs was assessed via surface and intracellular transcription factor staining and flow cytometry. Cells were assessed after the second transduction and magnetic bead purification for CD19. Graphs represent a summary of the percentage of eTregs positive for ΔCD34, ΔCD19, FOXP3, and Helios of total live cells (B) and geometric mean fluorescent intensity (GMFI) of FOXP3 and Helios of transduced cells gated on ΔCD19 expression (C); n = 3 to 9, and 6 different donors. Histograms and dot plots are representative figures of ΔCD34 and ΔCD19 expression following the second transduction and CD19 bead purification (D) and FOXP3 and Helios expression in ΔCD19+ transduced cells (E). (F) Representative figure of Helios messenger RNA expression assessed via real-time polymerase chain reaction and visualized via gel electrophoresis.*P ≤ .05 compared with no eTregs based on a 1-tailed Mann-Whitney U test.
Figure 2.
Figure 2.
FOXP3+Hel-FL eTregs delay disease progression in a xenogeneic GVHD murine model. NSG mice aged 8 to 12 weeks were sublethally irradiated. The next day, the mice were injected retro-orbitally with 107 human PBMCs alone (n = 8), with 107 human PBMCs + 5 × 10⁶ empty vector control cells (n = 6), 107 human PBMCs + 5 × 10⁶ FOXP3 eTregs (n = 8), 107 human PBMCs + 5 × 10⁶ FOXP3+HEL-FL eTregs (n = 7), or 107 human PBMC + 5 × 10⁶ FOXP3+Hel-Δ3B eTregs (n = 7). (A) GVHD score. *P ≤ .05 compared with no eTregs based on a 1-tailed Mann-Whitney U test for each time point. (B) Kaplan-Meier curve of survival. Death was marked when the GVHD score was ≥7. The data shown are the aggregated data from 5 separate experiments that used T cells from 4 different donors. *P ≤ .05 compared with no eTregs as determined by using the log-rank test. PBS, phosphate-buffered saline.
Figure 3.
Figure 3.
FOXP3+Hel-FL and FOXP3+Hel-Δ3B differentially mediate CD4+and CD8+eTreg suppression of T-cell proliferation. Labeled autologous target Tconv cells were cocultured at a 1:1 ratio with each eTreg cell strain or empty vector control cells with no stimulation or stimulation with anti-CD3 and anti-CD28 coated beads. After 96 hours, proliferation of target cells (CD19 eFluor670+) was assayed via flow cytometry. (A) Percent suppression for each eTreg cell strain. Cells were plated as follows: 5 × 10⁴ target Tconvs alone, 5 × 10⁴ target Tconvs + 5 × 10⁴ empty vector control cells, 5 × 10⁴ target Tconvs + 5 × 10⁴ FOXP3 eTregs, 5 × 10⁴ target Tconvs + 5 × 10⁴ FOXP3+Hel-FL eTregs, or 5 × 10⁴ target Tconvs + 5 × 10⁴ FOXP3+ Hel-Δ3B eTregs. Tregs were either both CD4+ and CD8+ (n = 5 for each condition), CD4+ only (n = 7), or CD8+ only (n = 6). T cells from 4 different donors were used. Negative percent suppression was plotted as 0% suppression. (B) Representative dot plots of responder cell proliferation 96 hours after coculture with eTregs or empty vector control. *P ≤ .05 in each comparison based on a 1-tailed Wilcoxon test. ND, not detectable; ns, not statistically significant.
Figure 4.
Figure 4.
Expression of FOXP3, FOXP3+Hel-FL, and FOXP3+Hel-Δ3B reduces cell expansion and survival. (A) Cell counts of eTregs growing in IL-2–supplemented media over 9 days. n = 4 for each group from 4 different donors. *P ≤ .05 compared with empty vector control based on a 1-tailed Mann-Whitney U test for each time point. (B) Numbers of live (Zombie Green and Annexin V negative) eTregs after stimulation for 2, 4, and 6 days with anti-CD3 and anti-CD28 plate-bound antibody. Cells were plated as follows: 2 × 10⁵ empty vector control cells (n = 5), 2 × 10⁵ FOXP3 eTregs (n = 5), 2 × 10⁵ FOXP3+HEL-FL eTregs (n = 6), or 2 × 10⁵ FOXP3+Hel-Δ3B eTregs (n = 6). T cells from 4 to 6 different donors were used. *P ≤ .05 compared with empty vector control based on a 1-tailed Mann-Whitney U test. (C) Representative contour plots of activation-induced cell death in eTregs or empty vector control cells after stimulation for 2, 4, and 6 days.
Figure 5.
Figure 5.
Hel-FL or Hel-Δ3B coexpression with FOXP3 alters gene expression and pathway enrichment in CD4+or CD8+eTregs compared with FOXP3 alone. All comparisons in this figure use FOXP3 eTregs as the baseline for comparison of CD4+ or CD8+ eTregs as indicated. (A) Volcano plots depicting gene expression differences between the cell strains. Within the volcano plots, genes were colored if they had a false discovery rate (FDR) ≤0.1. Blue denotes downregulation, and red represents upregulation. The 2 vertical lines represent logFC= −2 and logFC= 2. The horizontal line presents –log10(0.05). (B) Summary of normalized enrichment scores (NES) of KEGG pathways with P ≤ .05 that were enriched in the comparison of two eTreg cell strains indicated after GSEA. Blue bars are pathways enriched in the baseline eTregs, and red bars are pathways enriched in eTregs being compared.
Figure 6.
Figure 6.
FOXP3+Hel-Δ3B mediates different gene transcription and pathway enrichment in CD4+and CD8+eTregs compared with FOXP3+Hel-FL. All comparisons in this figure use FOXP3+Hel-FL eTregs as the baseline for comparison, either CD4+ or CD8+ as indicated. (A) Volcano plots depicting gene changes. Within the volcano plots, genes were colored if they had an FDR ≤0.1. Blue denotes downregulation, and red represents upregulation in the indicated comparison. The 2 vertical lines represent logFC= −2 and logFC = 2. The horizontal line presents –log10(0.05). (B) Summary of normalized enrichment scores (NES) of KEGG pathways with P ≤ .05 that were enriched compared with two eTreg cell strains after GSEA. Blue bars are pathways that are more downregulated in the Hel-Δ3B–expressing cell line, and red bars are pathways that are more upregulated in the Hel-Δ3B cell line, compared with the HEL-FL–expressing cell line.
Figure 7.
Figure 7.
Hel-FL or Hel-Δ3B coexpression with FOXP3 mediates different gene transcription of Treg signature genes in CD4+and CD8+eTregs. Heat maps comparing expression of Treg signature genes that are upregulated in Tregs (TREG UP) (A) or downregulated in Tregs (TREG DOWN) (B) compared with Tconv. Each heat map shows differential expression of genes in each of the 3 donors for FOXP3 vs FOXP3+Hel-FL (FL, donors FL1-FL3) and FOXP3 vs FOXP3+Hel-Δ3B (Δ3B, donors Δ3B1-Δ3B1) in both CD4+ and CD8+ eTregs as indicated. We first identified the subset of genes that had a nominal, uncorrected P < .05 in each indicated eTreg comparison based on change in expression of the TREG UP and TREG DOWN genes. Indicated P values are based on average change in gene expression for each eTreg comparison. For each cell in the heat map, the difference of cpm values between 2 strains of cell for 1 subject was calculated and divided by the average cpm value of that gene in all 3 subjects.
Figure 7.
Figure 7.
Hel-FL or Hel-Δ3B coexpression with FOXP3 mediates different gene transcription of Treg signature genes in CD4+and CD8+eTregs. Heat maps comparing expression of Treg signature genes that are upregulated in Tregs (TREG UP) (A) or downregulated in Tregs (TREG DOWN) (B) compared with Tconv. Each heat map shows differential expression of genes in each of the 3 donors for FOXP3 vs FOXP3+Hel-FL (FL, donors FL1-FL3) and FOXP3 vs FOXP3+Hel-Δ3B (Δ3B, donors Δ3B1-Δ3B1) in both CD4+ and CD8+ eTregs as indicated. We first identified the subset of genes that had a nominal, uncorrected P < .05 in each indicated eTreg comparison based on change in expression of the TREG UP and TREG DOWN genes. Indicated P values are based on average change in gene expression for each eTreg comparison. For each cell in the heat map, the difference of cpm values between 2 strains of cell for 1 subject was calculated and divided by the average cpm value of that gene in all 3 subjects.

References

    1. Sakaguchi S, Sakaguchi N, Asano M, Itoh M, Toda M. Immunologic self-tolerance maintained by activated T cells expressing IL-2 receptor alpha-chains (CD25). Breakdown of a single mechanism of self-tolerance causes various autoimmune diseases. J Immunol. 1995;155(3):1151-1164. - PubMed
    1. Bacchetta R, Passerini L, Gambineri E, et al. . Defective regulatory and effector T cell functions in patients with FOXP3 mutations. J Clin Invest. 2006;116(6):1713-1722. - PMC - PubMed
    1. Brunkow ME, Jeffery EW, Hjerrild KA, et al. . Disruption of a new forkhead/winged-helix protein, scurfin, results in the fatal lymphoproliferative disorder of the scurfy mouse. Nat Genet. 2001;27(1):68-73. - PubMed
    1. Bennett CL, Christie J, Ramsdell F, et al. . The immune dysregulation, polyendocrinopathy, enteropathy, X-linked syndrome (IPEX) is caused by mutations of FOXP3. Nat Genet. 2001;27(1):20-21. - PubMed
    1. Holderried TA, Lang PA, Kim HJ, Cantor H. Genetic disruption of CD8+ Treg activity enhances the immune response to viral infection. Proc Natl Acad Sci U S A. 2013;110(52):21089-21094. - PMC - PubMed

Publication types

MeSH terms