. 2020 Apr 8;287(1924):20200372.
doi: 10.1098/rspb.2020.0372. Epub 2020 Apr 8.

The apparent exponential radiation of Phanerozoic land vertebrates is an artefact of spatial sampling biases

Affiliations

The apparent exponential radiation of Phanerozoic land vertebrates is an artefact of spatial sampling biases

Roger A Close et al. Proc Biol Sci. .

Abstract

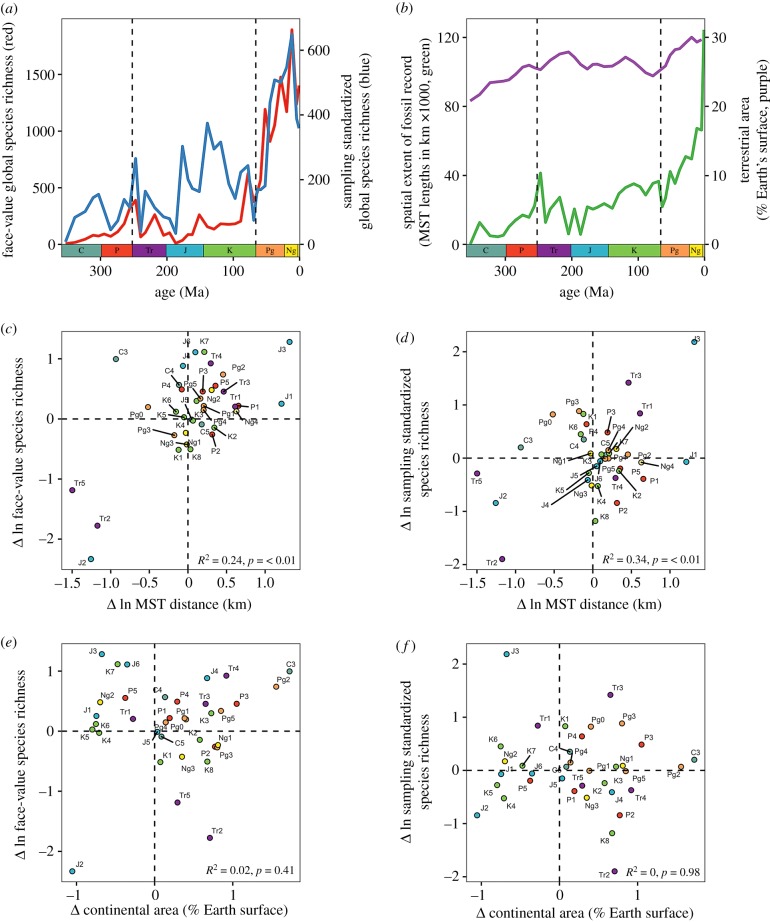
There is no consensus about how terrestrial biodiversity was assembled through deep time, and in particular whether it has risen exponentially over the Phanerozoic. Using a database of 60 859 fossil occurrences, we show that the spatial extent of the worldwide terrestrial tetrapod fossil record itself expands exponentially through the Phanerozoic. Changes in spatial sampling explain up to 67% of the change in known fossil species counts, and these changes are decoupled from variation in habitable land area that existed through time. Spatial sampling therefore represents a real and profound sampling bias that cannot be explained as redundancy. To address this bias, we estimate terrestrial tetrapod diversity for palaeogeographical regions of approximately equal size. We find that regional-scale diversity was constrained over timespans of tens to hundreds of millions of years, and similar patterns are recovered for major subgroups, such as dinosaurs, mammals and squamates. Although the Cretaceous/Palaeogene mass extinction catalysed an abrupt two- to three-fold increase in regional diversity 66 million years ago, no further increases occurred, and recent levels of regional diversity do not exceed those of the Palaeogene. These results parallel those recovered in analyses of local community-level richness. Taken together, our findings strongly contradict past studies that suggested unbounded diversity increases at local and regional scales over the last 100 million years.

Keywords: Phanerozoic; Tetrapoda; biodiversity; diversification; palaeontology; terrestrial.


Conflict of interest statement

We declare we have no competing interests.

Figures

Figure 1.
Figure 1.
Spatial bias and the global fossil record of Phanerozoic terrestrial tetrapods. (a) Face-value (red) and sampling-standardized (shareholder quorum subsampling (SQS) [17,18] using quorum=0.6; blue) ‘global’ species richness of Phanerozoic terrestrial tetrapods. (b) Spatial sampling (occupied equal-area grid cells with 500 km spacings, green) and habitable area (terrestrial area as a percentage of Earth's surface [19], purple). Counts of occupied grid cells increase steeply through the Cenozoic and accelerate towards the present. (c,d) Relationships between changes in (c) face-value and (d) sampling-standardized species richness (using SQS, quorum = 0.6) and changes in counts of occupied grid cells per equal-length bin (all variables log-transformed). (e,f) Relationships between (e) changes in face-value and (f) sampling-standardized species richness (using SQS, quorum = 0.6) and changes in continental area through time. Datapoints for C1 and C2 removed as outliers.
Figure 2.
Figure 2.
Spatial sampling in the Phanerozoic record of terrestrial tetrapods. Per-bin counts of equal-area grid cells with 1000 km spacings, broken down by (a) hemisphere, (b) absolute palaeolatitude zone (low = 0–30°, mid = 30–60°, high = 60–90°), and (c) continental region. Spatial sampling rises steeply through the Phanerozoic and is especially limited outside of North America, Europe and Asia, in the southern hemisphere, and at low and high palaeolatitudes. NAm, North America; EU, Europe; SA, South Africa; AF, Africa; AS, Asia; AUS, Australasia.
Figure 3.
Figure 3.
Key steps in the spatial standardization procedure used in this study, showing samples for the Early–Middle Triassic (Tr1 time bin). (a) Palaeocoordinates of fossil localities. (b) Fossil localities binned within 100 km equal-size hexagonal/pentagonal grid cells (using dggridR). (c) Palaeogeographic regions delineated using convex hulls, with samples meeting spatial standardization criteria for 2000 km MST distance highlighted in red. (d) Clusters of highly similar palaeogeographical regions.
Figure 4.
Figure 4.
Patterns of spatially standardized regional-scale species richness of non-flying terrestrial tetrapods through the Phanerozoic, for regions 2000 km in size (minimum-spanning tree (MST) distance). Patterns depicted using face-value (but spatially standardized) species counts, squares [34] and Chao 2 extrapolated richness [35], and SQS [17,18] (using quorum = 0.6). Grid cell rarefaction algorithm not used (GCR = off). Colours correspond to dominant continental regions of palaeogeographical regions. Data points represent median richness estimates for clustered palaeogeographical regions. NAm, North America; EU, Europe; SA, South America, AF, Africa; AS, Asia, AUS, Australasia; CAm, Central America.
Figure 5.
Figure 5.
Patterns of spatially standardized regional-scale species richness for major subclades of non-flying terrestrial tetrapods (non-avian dinosaurs, non-flying mammals, squamates, pseudosuchians, turtles and lissamphibians), for regions 2000 km in size (minimum-spanning tree (MST) distance). Species richness estimates extrapolated using SQS (quorum = 0.6, GCR = off). Colours represent dominant continental regions of palaeogeographical regions. Silhouettes courtesy of Phylopic (http://www.phylopic.org). Image credits for Phylopic silhouettes: non-avian dinosaur by Ian Reid, CC BY-NC-SA 3.0; non-flying mammal by FunkMonk/Michael B. H. (CC BY-NC-SA 3.0); squamate by Ghedo and T. Michael Keesey (CC BY-SA 3.0); pseudosuchian by Phylopic (Public Domain Mark 1.0); turtle by Phylopic (Public Domain Dedication 1.0); lissamphibian by Nobu Tamura (CC BY 3.0).

References

    1. May RM. 1994. Biological diversity: differences between land and sea. Phil. Trans. R. Soc. B 343, 105–111. (10.1098/rstb.1994.0014) - DOI
    1. Mora C, Tittensor DP, Adl S, Simpson AGB, Worm B. 2011. How many species are there on Earth and in the ocean? PLoS Biol. 9, e1001127 (10.1371/journal.pbio.1001127) - DOI - PMC - PubMed
    1. Harmon LJ, Harrison S. 2015. Species diversity is dynamic and unbounded at local and continental scales. Am. Nat. 185, 584–593. (10.1086/680859) - DOI - PubMed
    1. Rabosky DL, Hurlbert AH. 2015. Species richness at continental scales is dominated by ecological limits. Am. Nat. 185, 572–583. (10.1086/680850) - DOI - PubMed
    1. Benton MJ. 1996. Testing the roles of competition and expansion in tetrapod evolution. Proc. R. Soc. B 263, 641–646. (10.1098/rspb.1996.0096) - DOI

Publication types

LinkOut - more resources