. 2020 Jun 3;106(5):778-788.e6.
doi: 10.1016/j.neuron.2020.03.009. Epub 2020 Apr 6.

Postingestive Modulation of Food Seeking Depends on Vagus-Mediated Dopamine Neuron Activity

Affiliations

Postingestive Modulation of Food Seeking Depends on Vagus-Mediated Dopamine Neuron Activity

Ana B Fernandes et al. Neuron. .

Erratum in

Abstract

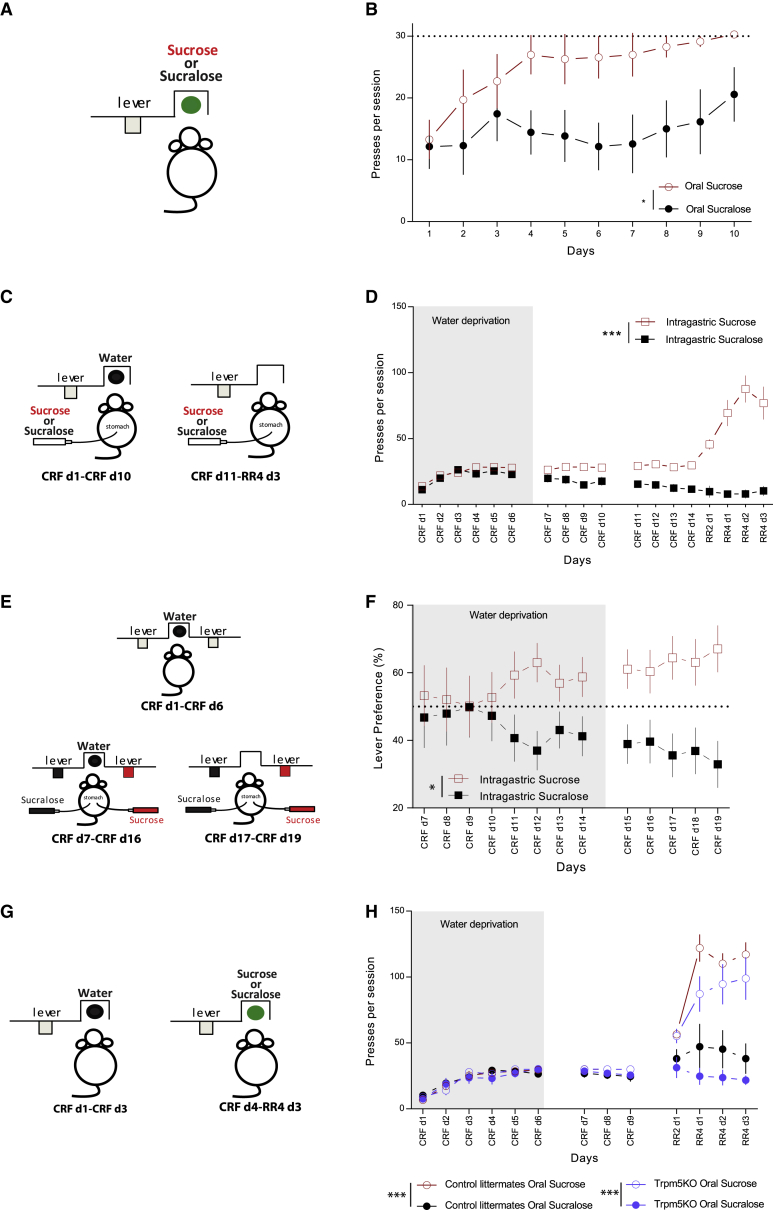
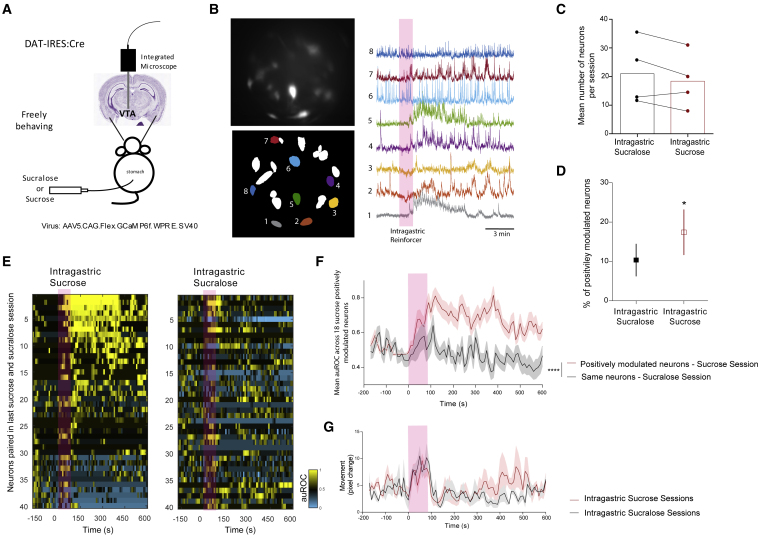
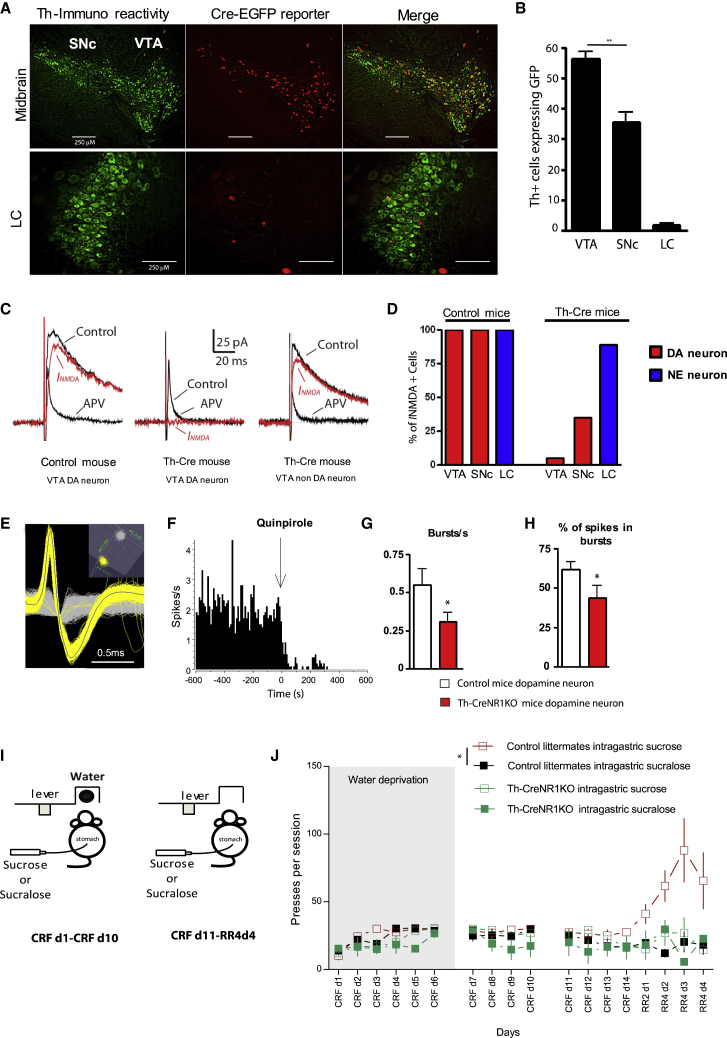
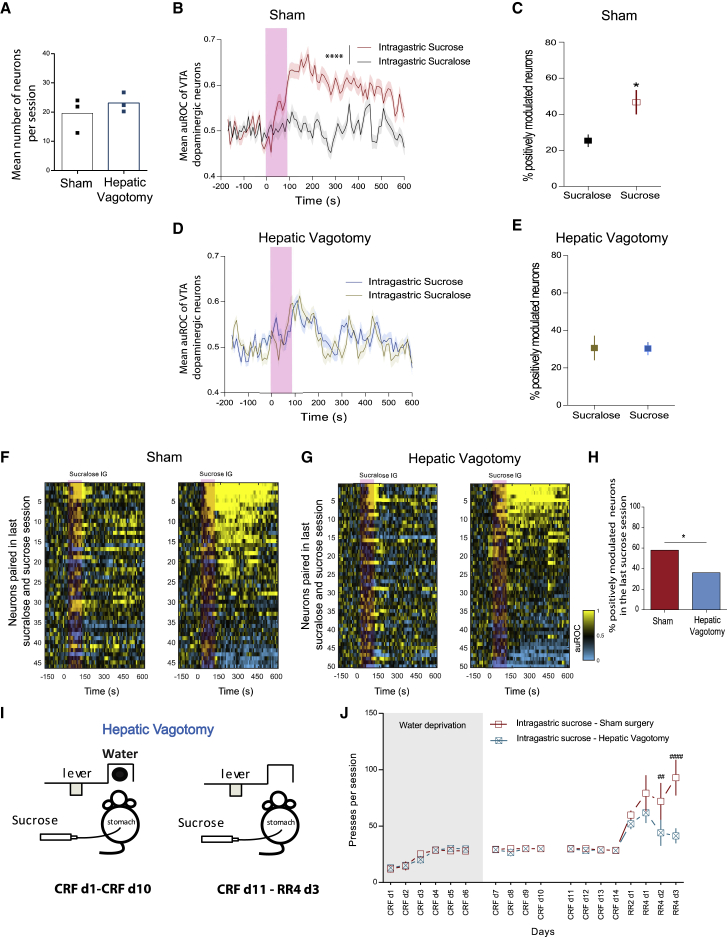
Postingestive nutrient sensing can induce food preferences. However, much less is known about the ability of postingestive signals to modulate food-seeking behaviors. Here we report a causal connection between postingestive sucrose sensing and vagus-mediated dopamine neuron activity in the ventral tegmental area (VTA), supporting food seeking. The activity of VTA dopamine neurons increases significantly after administration of intragastric sucrose, and deletion of the NMDA receptor in these neurons, which affects bursting and plasticity, abolishes lever pressing for postingestive sucrose delivery. Furthermore, lesions of the hepatic branch of the vagus nerve significantly impair postingestive-dependent VTA dopamine neuron activity and food seeking, whereas optogenetic stimulation of left vagus nerve neurons significantly increases VTA dopamine neuron activity. These data establish a necessary role of vagus-mediated dopamine neuron activity in postingestive-dependent food seeking, which is independent of taste signaling.

Keywords: Postingestive; Ventral Tegmental Area; dopamine; feeding behavior; food seeking; nutrient sensing; vagus nerve.


Conflict of interest statement

Declaration of Interests A.J.O.-M. is the recipient of a grant from Schuhfried GmBH for norming and validation of cognitive tests and the national coordinator for Portugal of a non-interventional Study (EDMS-ERI-143085581, 4.0) sponsored by Janssen-Cilag Ltd., both outside of this work.

Figures

Figure 1
Figure 1
Postingestive Modulation of Food Seeking (A) Food-deprived mice were trained to press a lever to obtain sucrose or sucralose for oral consumption. (B) Number of lever presses per session for 7 mice reinforced with sucrose and 7 others reinforced with sucralose (main effect for reinforcer: F1,12 = 5.99, p = 0.04; two-way ANOVA). (C) Water- and food-deprived mice lever-pressed to obtain water for oral consumption concomitantly with infusion of a reinforcer through an intragastric catheter. After several days of continuous reinforcement (CRF) sessions, delivery of water during the task and water deprivation in the home cage were discontinued, with lever pressing resulting solely in administration of intragastric solutions. During the last days (right panel), mice started a random ratio schedule (RR2 or RR4, i.e., reinforcer delivery, on average, every 2 or 4 lever presses, respectively). (D) Number of lever presses per session for mice receiving intragastric sucrose (n = 12) or intragastric sucralose (n = 10; main effect for reinforcer: F1,20 = 87.1, ∗∗∗p < 0.0001; two-way ANOVA). (E) Water- and food-deprived mice with 2 intragastric catheters were trained to press either of two levers to obtain oral water (top panel). After 6 days, in addition to oral water, intragastric sucrose was assigned to one lever and intragastric sucralose to the other lever (bottom left panel). During the last days of training, lever pressing resulted solely in intragastric infusion (bottom right panel). (F) Lever preference associated with intragastric sucrose or sucralose administration (n = 13; main effect for reinforcer: F1,12 = 6.68, p = 0.02; two-way repeated-measures ANOVA). (G) Food- and water-deprived Trpm5 KO mice trained in CRF sessions to lever-press initially for oral water (left panel) and later for sucrose or sucralose for oral consumption (right panel), with transition to RR and discontinuation of water deprivation as described in (C). (H) Number of lever presses per session for sucrose (n = 7) or sucralose (n = 8) in Trpm5 KO mice (main effect for reinforcer: F1,12 = 18.2, ∗∗∗p = 0.001; two-way ANOVA) and control littermate mice (sucrose, n = 9; sucralose, n = 8; main effect for reinforcer: F1,15 = 15.4, ∗∗∗p = 0.001; two-way ANOVA). Data are presented as mean ± SEM. Grey bars indicates the period of water deprivation. For detailed statistical analysis, see Table S1.
Figure 2
Figure 2
VTA Dopaminergic Neuron Activity in Freely Behaving Mice during Intragastric Delivery of Reinforcers (A) In 4 DAT-IRES:Cre mice, a miniature microscope was used for deep-brain calcium imaging from VTA dopaminergic neurons during intragastric sucrose or sucralose administration. (B) Examples of VTA dopaminergic neurons during a sucrose session (top left panel) and the respective regions of interest (bottom left panel), with a time course of the fluorescence traces for some of these neurons, coded according to numbers and colors, are shown in the right panel. In this and other panels, a pink bar represents reinforcer delivery. (C) Average number of neurons recorded in intragastric sucralose and sucrose sessions per mouse (p = 0.2, paired t test). (D) Percentage of positively modulated neurons per mouse, comparing intragastric sucrose and sucralose delivery (p = 0.03, paired t test). Data are presented as mean ± SEM. (E) Activity of 40 neurons recorded in the last sucrose (left panel) and the following sucralose session (right panel). Each line in represents a single neuron, with a color code for change in neuronal activity relative to baseline, defined according to the auROC (STAR Methods) in consecutive 10-s bins. (F) Mean activity of 18 neurons represented in (E) that were positively modulated by intragastric sucrose, comparing responses in the last sucrose and following sucralose sessions (F1,17 = 34.3, ∗∗∗∗p < 0.0001; two-way repeated-measures ANOVA; shading indicates SEM). (G) Mean animal movement during sucrose and sucralose sessions (F1,2 = 0.3, p = 0.6; two-way repeated-measures ANOVA; shading indicates SEM). For detailed statistical analysis, see Table S1.
Figure 3
Figure 3
NMDA-Dependent Bursting in Dopaminergic Neurons Is Necessary for Postingestive-Dependent Food-Seeking Behavior (A) Example midbrain (ventral tegmental area [VTA] and substantia nigra pars compacta [SNc]) and locus coereleus (LC) coronal sections of double immunofluorescence staining for tyrosine hydroxylase (TH) and green fluorescent protein (GFP) in double-transgenic Cre reporter mice. (B) Percentage of TH+ neurons expressing GFP in 6 midbrain sections and 4 LC sections from 2 mice (∗∗p < 0.01, paired t test comparing the VTA and SNc). (C) Representative traces (average of 10 sweeps, with voltage held at +40 mV) of electrically evoked NMDA currents (INMDAs) in VTA dopamine neurons of control mice as well as dopamine and non-dopamine neurons of Th-CreNR1KO mice. INMDAs were isolated by subtracting the excitatory postsynaptic current (EPSC) in the presence of APV (2-amino-5-phosphonovaleric acid, an NMDAR antagonist) from the pre-APV EPSC. (D) Percentage of recorded cells in which INMDAs were detected among 3 control and 14 Th-CreNR1KO mice. (E) Example action potential waveforms (yellow traces) of a putative dopamine neuron recorded in a freely moving mouse using microwire metal electrodes. The inset depicts the separation of the recorded single unit (yellow) from noise (gray) in a 3-dimentional principal-component analysis. (F) Firing rate of the neuron shown in (E) and its response to quinpirole (200 μg/kg intraperitoneally [i.p.]). (G and H) Bursts per second (G) and percentage of spikes fired in bursts (H) in 26 and 14 dopamine neurons from control mice and Th-CreNR1KO mice, respectively (* p<0.05, unpaired t tests). (I) Th-CreNR1KO mice and control littermates performed a behavioral task as described in Figure 1C. (J) Number of lever presses per session in Th-CreNR1KO mice pressing for either intragastric sucrose (n = 5) or sucralose (n = 3; main effect for reinforcer: F1,6 = 1.4, p = 0.3; two-way ANOVA) and control littermate mice (sucrose, n = 6; sucralose, n = 5; main effect for reinforcer: F1,9 = 7.8, p = 0.02; two-way ANOVA). Grey bar indicates the period of water deprivation. Data are presented as mean ± SEM. For detailed statistical analysis, see Table S1.
Figure 4
Figure 4
VTA Dopaminergic Neuron Activity in Response to Postingestive Sucrose Is Dependent on the Hepatic Branch of the Vagus Nerve Calcium imaging of VTA dopamine neurons was performed in 3 DAT-IRES:Cre mice with hepatic vagus nerve (HVN) denervation and 3 mice receiving sham surgery, as described above. (A) Total number of neurons recorded per session in denervated and sham mice (p = 0.4, unpaired t test). (B–E) Neuronal activity relative to baseline (auROC) in VTA dopaminergic neurons recorded during intragastric sucrose and sucralose sessions in sham (B; sucrose, n = 249 neurons; sucralose, n = 221 neurons; main effect for reinforcer: F1,50544 = 674.7, ∗∗∗∗p < 0.0001; two-way ANOVA) and denervated mice (D; sucrose, n = 299; sucralose, n = 263; main effect for reinforcer: F1,60480 = 3.5, p = 0.6; two-way ANOVA; shading indicates SEM). Also shown is the mean proportion of positively modulated neurons per session, comparing sucrose and sucralose sessions in sham (C; p = 0.03) and denervated mice (E; p = 0.98, paired t tests). In this and other panels, a pink bar indicates the time of the reinforcer injection. (F) VTA single neuron activity in sham mice recorded in the last sucralose (left panel) and the following intragastric sucrose (right panel) sessions. Each line represents a single neuron with a color code for variation of neuronal activity relative to baseline (auROC) in consecutive 10-s bins. (G) Analysis described in (F) for denervated mice. (H) Percentage of positively modulated neurons in the last sucrose session in the sham and denervated groups (p = 0.02; Fisher’s exact test). (I) Behavioral task progressing to lever pressing for intragastric sucrose infusion, as described in Figure 1C, in mice randomly assigned to hepatic vagus denervation (n = 9) or sham surgery (n = 8). (J) Lever pressing for intragastric sucrose comparing sham and denervated mice (main effect for group: F1,15 = 3.8, p = 0.07; group-day interaction: F17,255 = 3.4, p < 0.0001; two-way ANOVA; post hoc comparisons between sham and denervated mice on each day, ##p < 0.01, ####p < 0.001). Grey bar indicates the period of water deprivation. Data are presented as mean ± SEM. For detailed statistical analysis, see Table S1.

Comment in

  • A Gut Feeling about Dopamine.
    Gianessi CA, Kash TL. Gianessi CA, et al. Neuron. 2020 Jun 3;106(5):703-704. doi: 10.1016/j.neuron.2020.05.018. Neuron. 2020. PMID: 32497503

References

    1. Atasoy D., Betley J.N., Su H.H., Sternson S.M. Deconstruction of a neural circuit for hunger. Nature. 2012;488:172–177. - PMC - PubMed
    1. Bai L., Mesgarzadeh S., Ramesh K.S., Huey E.L., Liu Y., Gray L.A., Aitken T.J., Chen Y., Beutler L.R., Ahn J.S. Genetic Identification of Vagal Sensory Neurons That Control Feeding. Cell. 2019;179:1129–1143.e23. - PMC - PubMed
    1. Barretto R.P.J., Ko T.H., Jung J.C., Wang T.J., Capps G., Waters A.C., Ziv Y., Attardo A., Recht L., Schnitzer M.J. Time-lapse imaging of disease progression in deep brain areas using fluorescence microendoscopy. Nat. Med. 2011;17:223–228. - PMC - PubMed
    1. Beeler J.A., McCutcheon J.E., Cao Z.F.H., Murakami M., Alexander E., Roitman M.F., Zhuang X. Taste uncoupled from nutrition fails to sustain the reinforcing properties of food. Eur. J. Neurosci. 2012;36:2533–2546. - PMC - PubMed
    1. Beutler L.R., Chen Y., Ahn J.S., Lin Y.C., Essner R.A., Knight Z.A. Dynamics of Gut-Brain Communication Underlying Hunger. Neuron. 2017;96:461–475.e5. - PMC - PubMed

Publication types

MeSH terms

LinkOut - more resources