. 2020 May 5;31(5):969-986.e7.
doi: 10.1016/j.cmet.2020.03.010. Epub 2020 Apr 6.

Cholesterol Stabilizes TAZ in Hepatocytes to Promote Experimental Non-alcoholic Steatohepatitis

Affiliations

Cholesterol Stabilizes TAZ in Hepatocytes to Promote Experimental Non-alcoholic Steatohepatitis

Xiaobo Wang et al. Cell Metab. .

Abstract

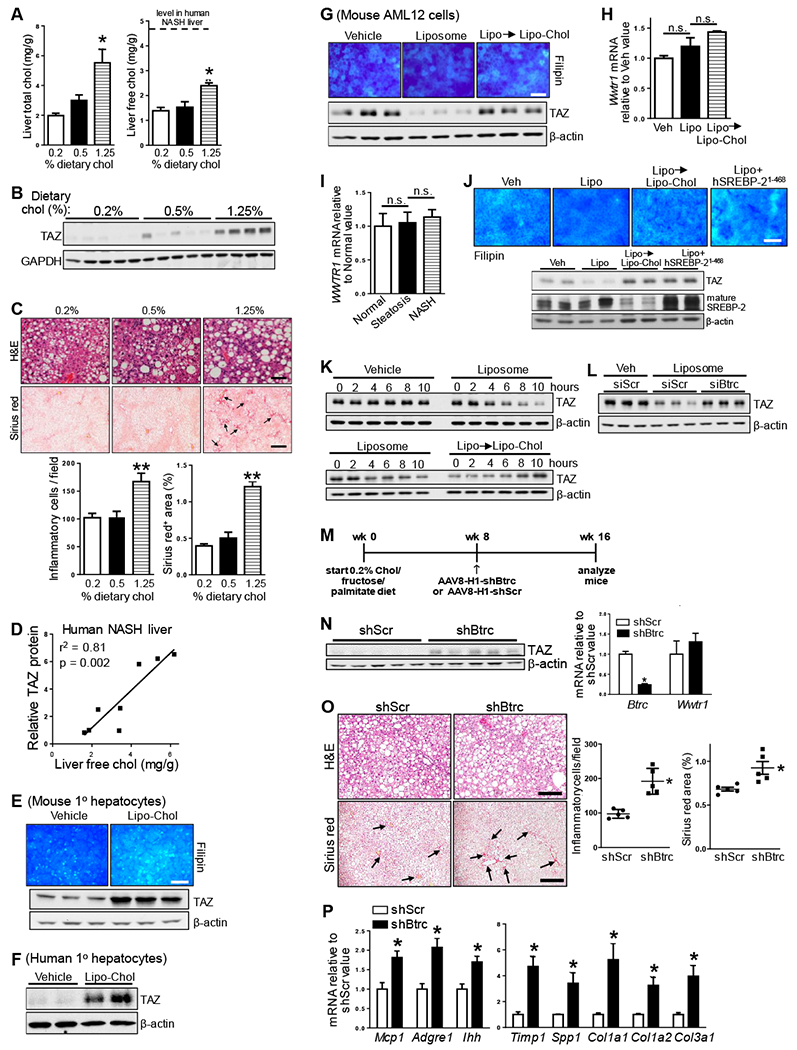
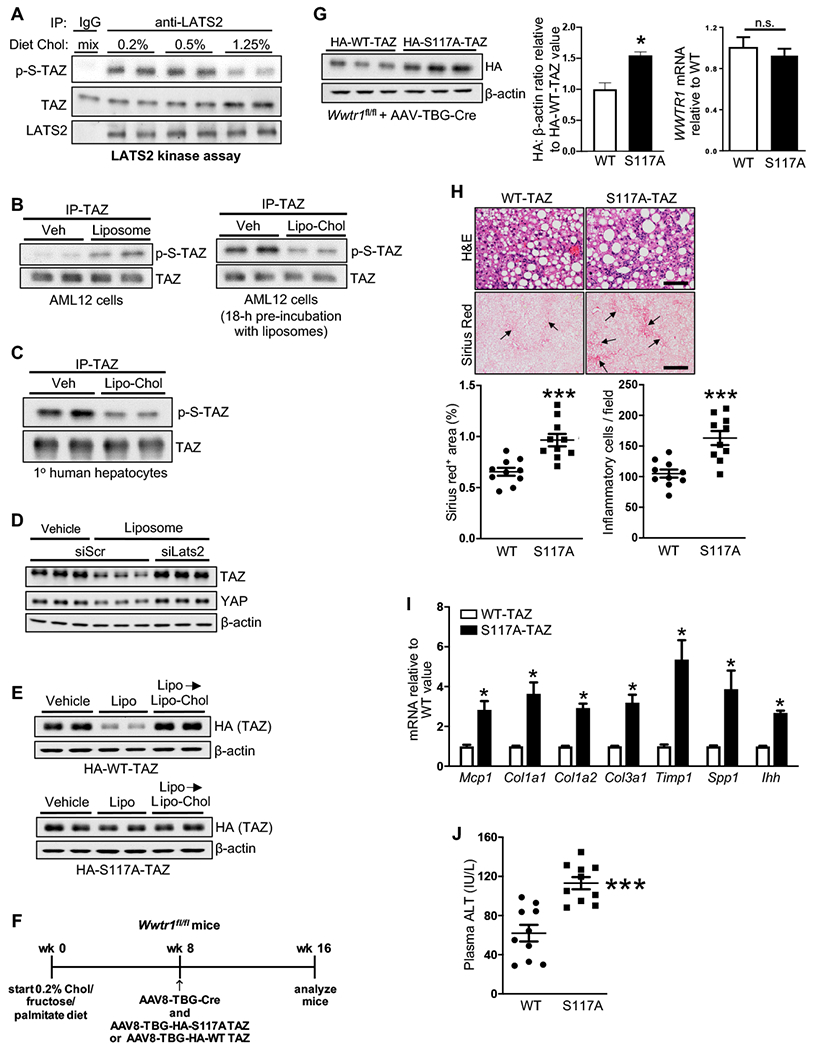
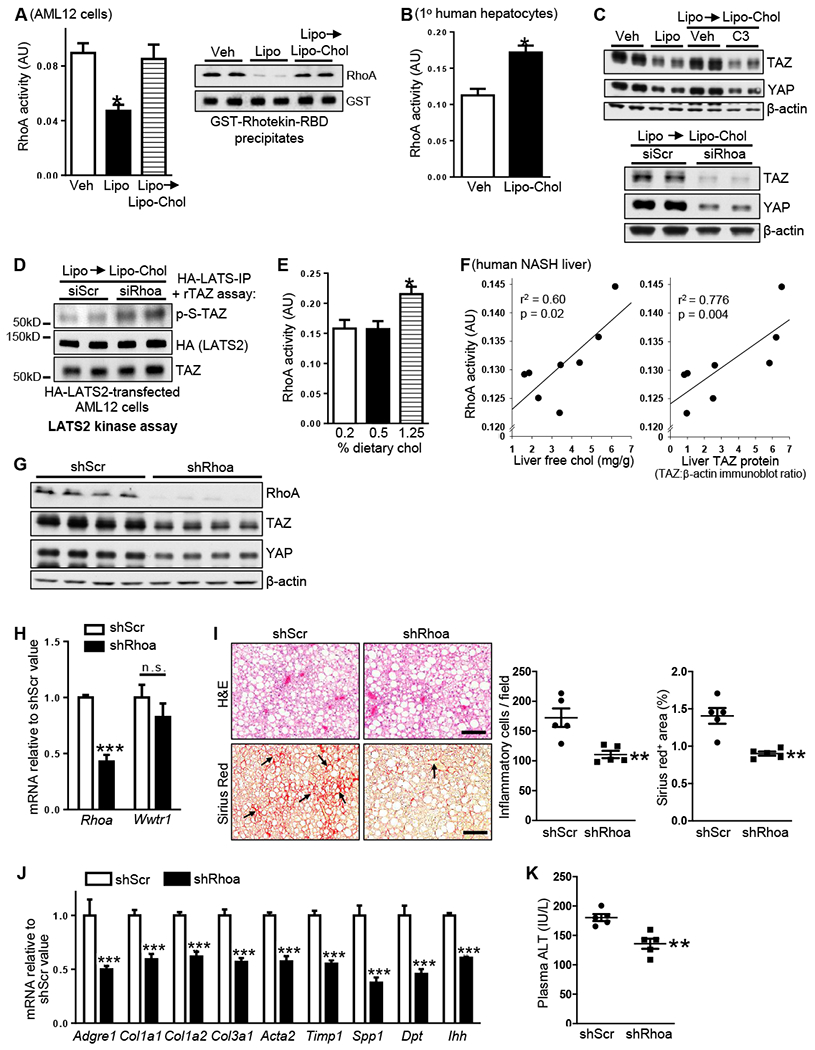
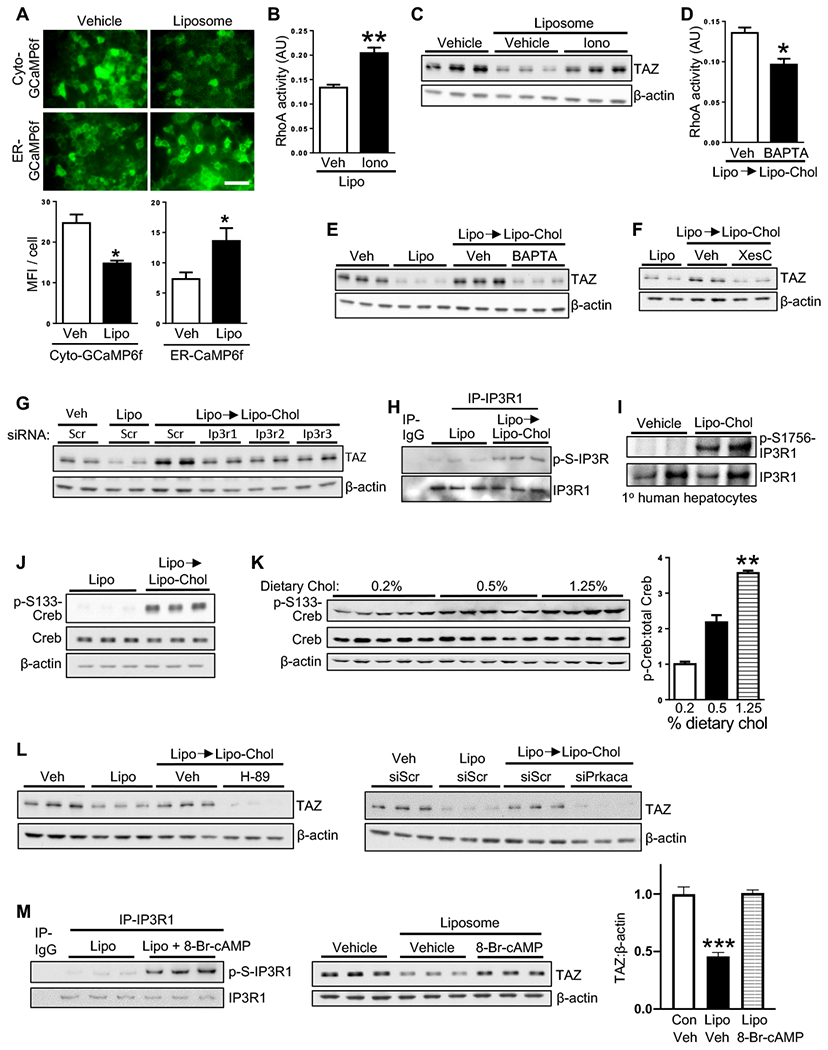
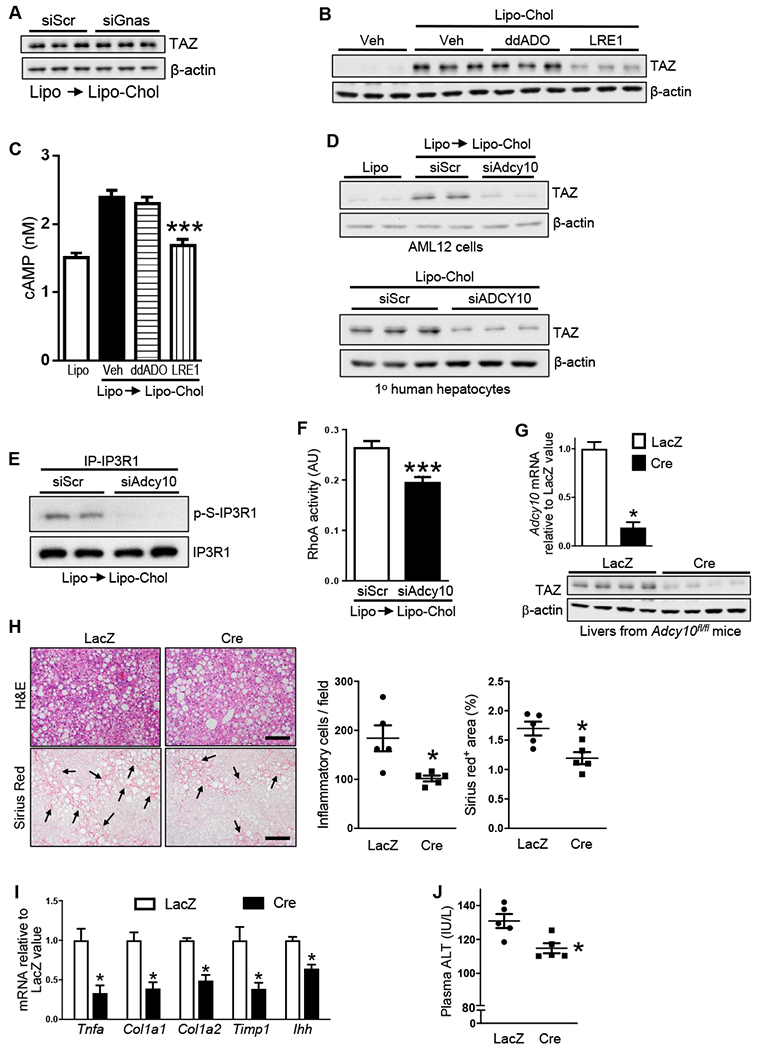
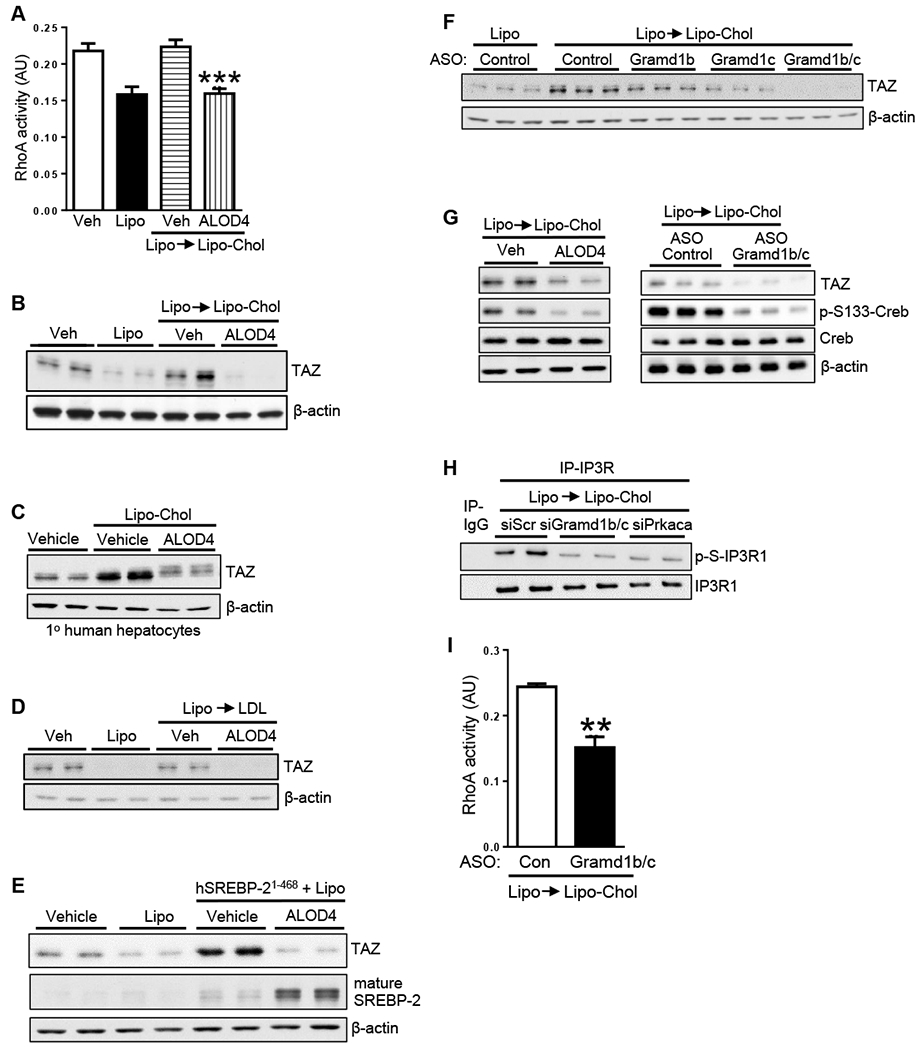
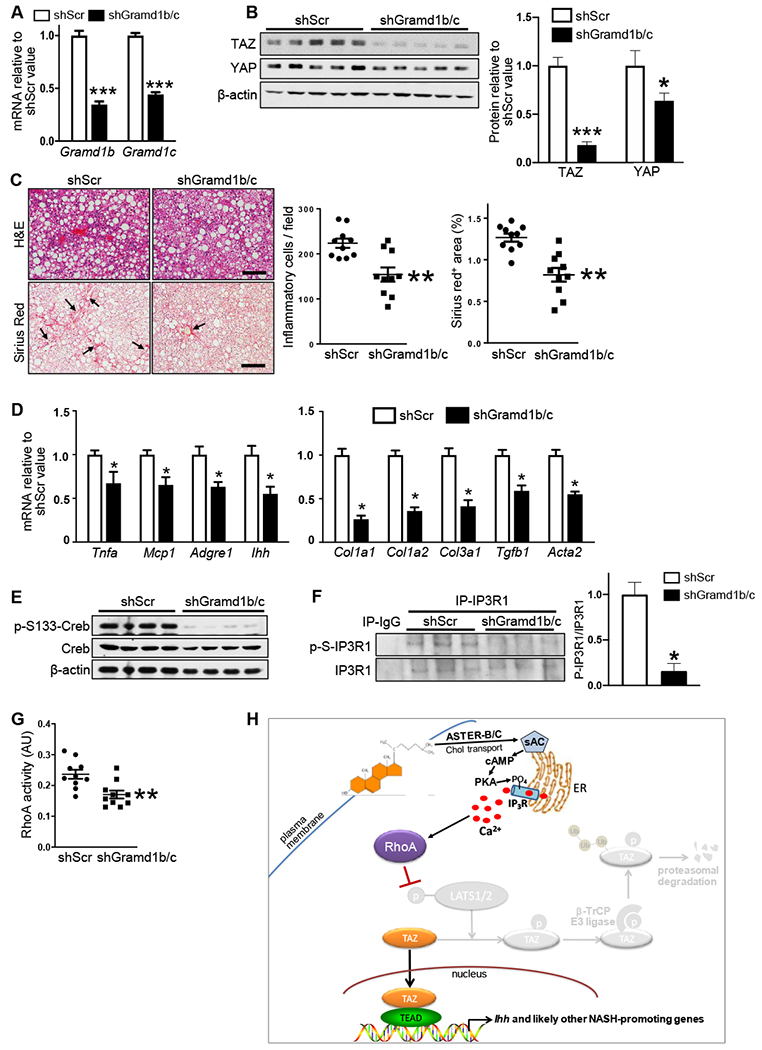
Incomplete understanding of how hepatosteatosis transitions to fibrotic non-alcoholic steatohepatitis (NASH) has limited therapeutic options. Two molecules that are elevated in hepatocytes in human NASH liver are cholesterol, whose mechanistic link to NASH remains incompletely understood, and TAZ, a transcriptional regulator that promotes fibrosis but whose mechanism of increase in NASH is unknown. We now show that increased hepatocyte cholesterol upregulates TAZ and promotes fibrotic NASH. ASTER-B/C-mediated internalization of plasma membrane cholesterol activates soluble adenylyl cyclase (sAC; ADCY10), triggering a calcium-RhoA-mediated pathway that suppresses β-TrCP/proteasome-mediated TAZ degradation. In mice fed with a cholesterol-rich NASH-inducing diet, hepatocyte-specific silencing of ASTER-B/C, sAC, or RhoA decreased TAZ and ameliorated fibrotic NASH. The cholesterol-TAZ pathway is present in primary human hepatocytes, and associations among liver cholesterol, TAZ, and RhoA in human NASH liver are consistent with the pathway. Thus, hepatocyte cholesterol contributes to fibrotic NASH by increasing TAZ, suggesting new targets for therapeutic intervention.

Keywords: ADCY10; Gramd1/ASTER; Hippo; NASH; RhoA; TAZ; WWTR1; cholesterol; liver fibrosis; sAC.


Conflict of interest statement

Declaration of Interests J.B. and L.R.L. own equity interest in CEP Biotech, which has licensed commercialization of a panel of monoclonal antibodies directed against sAC. I.T. and X.W. are co-inventors of a patent application related to the topic of this study, and I.T. is a scientific consultant for Genevant, which is developing therapies for NASH.

Figures

Figure 1.
Figure 1.. TAZ Protein Correlates with Liver Cholesterol and Fibrosis, and Cholesterol Increases TAZ in Hepatocytes
(A-C) The following parameters were measured in mice fed the NAFLD diet containing 0.2%, 0.5%, and 1.25% cholesterol (chol) for 16 weeks (n = 5 mice/group; means ± SEM; *p < 0.05, **p < 0.01, ***p < 0.001): (A) Liver total cholesterol and free cholesterol. The dotted line indicates the free cholesterol content in liver of NASH subjects (Puri et al., 2007). (B) Liver TAZ and GAPDH immunoblot. (C) Liver sections stained for H&E (scale bar, 100 μm), quantified for inflammatory cells, and stained and quantified for Sirius red (arrows indicate areas of fibrosis; scale bar, 500 μm). (D) Correlation between TAZ protein level and free cholesterol concentration in human NASH livers (n = 8 subjects). (E) Filipin staining and TAZ immunoblot of primary mouse hepatocytes incubated for 24 h with vehicle or cholesterol-rich liposomes (Lipo-Chol). Scale bar, 100 μm. (F) TAZ immunoblot of primary human hepatocytes incubated with 24 h with vehicle or Lipo-Chol. (G) Filipin staining and TAZ immunoblot of AML12 cells incubated for 24 h with vehicle, or for 16 h with liposomes and then 8 h with Lipo-Chol (Lipo → Lipo-Chol). Scale bar, 100 μm. (H) Wwtr1 mRNA of the cells in panel C (n = 4 biological replicates; means ± SEM; n.s., non-significant). (I) WWTR1 mRNA in normal human livers (n = 7) or human livers showing features of steatosis (n =12) or NASH (n = 16; means ± SEM; n.s., non-significant). (J) Filipin staining and TAZ and mature SREBP-2 immunoblot of AML12 cells incubated for 24 h with vehicle (Veh) or liposomes (Lipo); 16 h with liposomes followed by 8 h with Lipo-Chol); or 24 h with liposomes after transfection with human SREBP-2(1-468). Scale bar, 100 μm. (K) TAZ immunoblot of AML12 cells treated as follows: upper blot: vehicle or liposomes for 0-10 h; lower blot: liposomes for 0-10 h, or for 16 h followed by 0-10 h with Lipo-Chol. (L) TAZ immunoblot of AML12 cells transfected with siScr or siBtrc and then incubated for 24 h with vehicle (Veh) or liposomes. (M-N) The following parameters were measured in mice fed the 0.2% cholesterol NAFLD diet for 16 weeks, with AAV8-H1-shBtrc or AAV8-H1-scrambled RNA (shScr) injected at the 8-week time point (n = 5 mice/group; means ± SEM; *P < 0.05): (M) Experimental design. (N) TAZ immunoblot; and Btrc and Wwtr1 mRNA. (O) Liver sections stained for H&E, quantified for inflammatory cells, and stained and quantified for Sirius red (arrows indicate areas of fibrosis). Scale bar, 200 μm. (P) Liver Mcp1, Adgre1 (F4/80), Ihh, Timp1, Spp1, Col1a1, Col1a2, and Col3a1 mRNAs.
Figure 2.
Figure 2.. Cholesterol Depletion of Hepatocytes Decreases TAZ in a LATS2-Dependent Manner
(A) LATS2 kinase assay, using rTAZ as substrate, of extracts of livers of mice fed the NAFLD diet containing 0.2%, 0.5%, or 1.25% cholesterol for 16 weeks. (B) Immunoblots of phospho- and total TAZ in TAZ immunoprecipitates from AML12 cells incubated as follows: left blot, 4 h with MG132 plus vehicle (Veh) or liposomes; right blot, 18 h with liposomes and then 4 h with MG132 plus vehicle or Lipo-Chol. (C) Immunoblots of phospho- and total TAZ in TAZ immunoprecipitates from primary human hepatocytes incubated for 8 h with vehicle or Lipo-Chol, with MG132 included during the last 4 h. (D) TAZ and YAP immunoblots of siScr-treated or siLats2-treated AML12 cells that were incubated for 24 h with vehicle or liposomes. (E) HA-TAZ immunoblot of HA-WT-human TAZ- or HA-S117A-human TAZ-transfected AML12 cells that were incubated for 24 h with vehicle, or liposomes for 16 h and then Lipo-Chol for 8 h. (F-J) The following parameters were measured in Wwtr1fl/fl mice fed the NAFLD diet containing 0.2% cholesterol for 16 weeks, with AAV8-TBG-Cre plus either AAV8-TBG-HA-WT-hTAZ or AAV8-TBG-HA-S117A-hTAZ injected at the 8-week time point (n = 10 mice/group; means ± SEM; *p < 0.05, ***p < 0.001): (F) Design of the experiment. (G) Liver HA-TAZ immunoblot, with quantification, and WWTR1 mRNA. (H) Liver sections stained for H&E, quantified for inflammatory cells, and stained and quantified for Sirius red (arrows indicate areas of fibrosis). Scale bars, 100 μm for H&E and 500 μm for Sirius red. (I) Liver Mcp1, Col1a1, Col1a2, Col3a1, Timp1, Spp1, and Ihh mRNAs. (J) Plasma ALT.
Figure 3.
Figure 3.. Liver Cholesterol Correlates with RhoA Activity, and RhoA Silencing Decreases Liver TAZ, Inflammation, and Fibrosis in NASH Mice
(A) RhoA activity (left graph, G-LISA® assay; right graph, GTP-RhoA precipitation using GSTRhotekin-RBD) of AML12 cells incubated for 2 h with vehicle or liposomes, or for 24 h with liposomes and then 2 h with Lipo-Chol. For the G-LISA® assay, n = 4 biological replicates; values shown are means ± SEM; *p < 0.05. (B) RhoA activity of primary human hepatocytes incubated for 2 h with vehicle or Lipo-Chol (n = 3 biological replicates; means ± SEM; *p < 0.05). (C) Top, TAZ and YAP immunoblots of AML12 cells incubated for 24 h with vehicle or liposomes or 16 h with liposomes and then 8 h with Lipo-Chol ± 1 μg/ml C3 transferase Rho inhibitor (C3) included during the last 4 h. Bottom, TAZ and YAP immunoblots of siScr- or siRhoa-transfected AML12 cells incubated for 16 h with liposomes and then 8 h with Lipo-Chol. (D) LATS2 kinase assay, using rTAZ as substrate, of extracts of siScr- or siRhoa-transfected, HA-LATS-expressing AML12 cells that were incubated for 16 h with liposomes and then 2 h with Lipo-Chol. (E) RhoA activity in liver extracts from mice fed 16 weeks with the NAFLD diet containing 0.2%, 0.5%, and 1.25% cholesterol (n = 5 mice/group; means ± SEM; *p < 0.05). (F) Correlations of liver free cholesterol and liver TAZ with RhoA activity in liver extracts from humans subjects presented in Figure 1F (n = 8 subjects). (G-K) The following parameters were assayed in mice fed the NASH-inducing 1.25%-cholesterol diet for 16 weeks, with AAV8-H1-shRhoa or AAV8-H1-shScr administered at the 8-week time point (n = 5 mice/group; means ± SEM; **p < 0.01, ***p < 0.001): (G) Liver RhoA, TAZ, and YAP immunoblots. (H) Liver Rhoa and Wwtr1 mRNAs. (I) Liver sections stained for H&E, quantified for inflammatory cells, and stained and quantified for Sirius red (arrows indicate areas of fibrosis). Scale bar, 200 μm. (J) Liver Adgre1 (F4/80), Col1a1, Col1a2, Col3a1, Acta2, Timp1, Spp1, Dpt, and Ihh mRNAs. (K) Plasma ALT.
Figure 4.
Figure 4.. Cholesterol Increases TAZ in Hepatocytes through an IP3R-Calcium-Protein Kinase A Pathway
(A) Images and mean fluorescence intensity (MFI) per cell of AML12 cells transduced with cyto-GCaMP6f or ER-GCaMP6f and then incubated for 30 min with vehicle or liposomes (n = 4 biological replicates; means ± SEM; *p < 0.05). Scale bar, 100 μm. (B) RhoA activity of AML12 cells incubated for 2 h with liposomes ± 1 μM ionomycin (Iono) included during the last hour (n = 3 biological replicates; means ± SEM; **p < 0.01). (C) TAZ immunoblot of AML12 cells incubated with vehicle or liposomes for 24 h ± 1 μM ionomycin included during the last 4 h. (D) RhoA activity of AML12 cells incubated for 16 h with liposomes and then 2 h with Lipo-Chol ± 5 μM BAPTA-AM (n = 3 biological replicates; means ± SEM; *p < 0.05). (E-G) TAZ immunoblot in AML12 cells treated as follows: (E) Vehicle or liposomes for 24 h, or liposomes for 16 h and then Lipo-Chol for 8 h ± 5 μM BAPTA-AM. (F) Vehicle or liposomes for 24 h, or liposomes for 16 h and then Lipo-Chol for 8 h, with 2 μM xestospongin C (XesC) or vehicle included during the last 4 h. (G) Vehicle or liposomes for 24 h, or liposomes for 16 h and then Lipo-Chol for 8 h, in AML12 cells transfected with siScr, siItpr1, siItpr2, or siItpr3. (H) Phospho-IP3R and IP3R1 immunoblots in IP3R1 immunoprecipitates from AML12 cells incubated for 16.5 h with liposomes or 16 h with liposomes and then 30 minutes with Lipo-Chol. (I) Phospho-S1756-IP3R1 and IP3R1 immunoblots of primary human hepatocytes incubated for 30 minutes with vehicle or Lipo-Chol. (J) Phospho-S133-Creb and total Creb immunoblots of AML12 cells incubated for 16.5 h with liposomes or 16 h with liposomes and then 30 minutes with Lipo-Chol. (K) Phospho-S133-Creb and total Creb immunoblots of liver extracts from mice fed 16 weeks with the NAFLD diet containing 0.2%, 0.5%, and 1.25% cholesterol, with densitometric quantification (n = 5 mice/group; means ± SEM; **p < 0.01). (L) Left, TAZ immunoblot of AML12 cells incubated for 24 h with vehicle or liposomes or 16 h with liposomes and then 8 h with Lipo-Chol ± 10 μM H-89 PKA inhibitor for the final 4 h. Right, TAZ immunoblot of siScr- or siPrkaca-transfected AML12 cells that were incubated for 16 h with vehicle or liposomes or 16 h with liposomes and then 8 h with Lipo-Chol. (M) Left, Phospho-S1756-IP3R1 and IP3R1 immunoblots of AML12 cells incubated for 16.5 h with liposomes or 16 h with liposomes and then 30 minutes with liposomes ± 100 μM 8-Br-cAMP. Middle, TAZ immunoblot of AML2 cells incubated for 24 h with vehicle or 24 h with liposomes ± 100 μM 8-Br-cAMP. Right, Quantification of the middle blot (n = 5 biological replicates; means ± SEM; ***p < 0.001).
Figure 5.
Figure 5.. Adenylyl Cyclase 10 is Necessary for Increased TAZ in Cholesterol-Repleted Hepatocytes and in NASH Mice
(A) TAZ immunoblot of siScr- or siGnas-transfected AML12 cells that were incubated for 16 h with liposomes and then 8 h with Lipo-Chol). (B) TAZ immunoblot of primary mouse hepatocytes that were incubated for 24 h with vehicle or Lipo-Chol ± 10 μM 2′,5′-dideoxyadenosine (ddAdo) or 30 μM LRE1. (C) cAMP content of AML12 cells that were incubated for 16.5 h with liposomes or 16 h with liposomes and then 30 minutes with Lipo-Chol ± 10 μM ddAdo or 80 μM LRE1 (n = 4 biological replicates; values shown are means ± SEM; ***p < 0.001 vs. Veh and ddAdo). (D) Top, TAZ immunoblot of control AML12 cells that were incubated 24 h with liposomes, or siScr or siAdcy10-transfected AML12 that were incubated for 16 h with liposomes and then 8 h with Lipo-Chol. Bottom blot, TAZ immunoblot of siScr or siADCY10-transfected primary human hepatocytes that were incubated for 24 h with Lipo-Chol. (E) Phospho-IP3R1 and IP3R1 immunoblots of siScr- or siAdcy10-transfected AML12 cells that were incubated for 16 h with liposomes and then 30 minutes with Lipo-Chol. (F) RhoA activity of siScr- or siAdcy10-transfected AML12 cells that were incubated for 16 h with liposomes and then 2 h with Lipo-Chol (n = 4 biological replicates; means ± SEM; ***p < 0.001). (G-J) The following parameters were assayed in Adcy10fl/fl mice fed the NASH-inducing 1.25%-cholesterol diet for 16 weeks, with AAV8-TBG-Cre or AAV8-TBG-LacZ administered at the 8-week time point (n = 5 mice/group; means ± SEM, *p < 0.05): (G) Liver Adcy10 mRNA and TAZ immunoblot. (H) Liver sections stained for H&E, quantified for inflammatory cells, and stained and quantified for Sirius red (arrows indicate areas of fibrosis). Scale bars, 200 μm. (I) Liver Tnfa, Col1a1, Col1a2, Timp1, and Ihh mRNAs. (J) Plasma ALT.
Figure 6.
Figure 6.. Cholesterol Transport from the Plasma Membrane is Necessary for Increased TAZ in Cholesterol-Repleted Hepatocytes
(A) RhoA activity of AML12 cells that were incubated for 24 h with vehicle or liposomes or for 2 h with liposomes and then 3 h with Lipo-Chol ± 10 μM ALOD4 (n = 6 biological replicates; means ± SEM; ***p < 0.001 vs. both Veh groups). (B) TAZ immunoblot of AML12 cells that were incubated for 24 h with vehicle or liposomes or 24 h with liposomes and then 8 h with Lipo-Chol ± 10 μM ALOD4 included during the last 4 h. (C) TAZ immunoblot of primary human hepatocytes that were incubated for 24 h with vehicle or Lipo-Chol ± 10 μM ALOD4 included during the last 4 h. (D) TAZ immunoblot of AML12 cells that were incubated for 24 h with vehicle or liposomes or 24 h with liposomes and then 8 h with 100 μg/ml LDL ± 10 μM ALOD4 included during the last 4 h. (E) TAZ and mature SREBP-2 immunoblots of control or human SREBP-2(1-468)-transfected AML12 cells that were incubated for 24 h with vehicle or liposomes ± 10 μM ALOD4 included during the last 4 h. (F) TAZ immunoblot of AML12 cells were treated with control ASO or ASO targeting Gramd1b, Gramd1c, or both and then incubated for 24 h with liposomes or 16 h with liposomes and then 8 h with Lipo-Chol. (G) TAZ, p-S133-Creb, total Creb immunoblots of AML12 cells were treated and incubated as in panel E for ALOD4 and panel F for ASOs targeting Gramd1b and Gramd1c. (H) Phospho-IP3R1 and IP3R1 immunoblots of siScr-, siGramd1b- and siGramd1c-, or siPrkaca-transfected AML12 cells that were incubated for 16 h with liposomes and then 8 h with Lipo-Chol. (I) RhoA activity of control ASO- or Gramd1b/c ASO-treated AML12 cells that were incubated for 16 h with liposomes and then 2 h with Lipo-Chol (n = 3 biological replicates; means ± SEM; **p < 0.01).
Figure 7.
Figure 7.. Silencing of Hepatocyte Gramd1b/c in Mice with Hepatosteatosis Prevents TAZ Increase and Suppresses NASH Progression
The following parameters were assayed in mice fed the NASH-inducing 1.25%-cholesterol diet for 16 weeks, with AAV8-H1-shGramd1b/c or AAV8-H1-shSrc administered at the 8-week time point (n = 10 mice/group; means ± SEM; *p < 0.05, **p < 0.01, ***p < 0.001): (A) Liver Gramd1b and Gramd1c mRNAs. (B) Liver TAZ and YAP immunoblots for 5 mice/group, with quantification. (C) Liver sections stained for H&E, quantified for inflammatory cells, and stained and quantified for Sirius red (arrows indicate areas of fibrosis). Scale bars, 200 μm. (D) Liver Tnfa, Mcp1, Adgre1 (F4/80), Ihh, Col1a1, Col1a2, Col3a1, Tgfb, and Acta2 mRNAs. (E) Liver p-S133- and total Creb Immunoblots. (F) Phospho-IP3R1 and total IP3R1 immunoblots of liver IP3R1 immunoprecipitates, with quantification. (G) RhoA activity of liver extracts. (H) Summary scheme of the hepatocyte cholesterol-TAZ pathway in NASH. In cholesterol-enriched hepatocytes, internalization of plasma membrane cholesterol by ASTER-B/C leads to sAC-mediated increase in cAMP and PKA-dependent activation of IP3R. The resulting increase in Ca2+i activates RhoA, which inhibits LATS1/2-dependent phosphorylation of TAZ. Phosphorylation of TAZ, particularly on S117, blocks β-TrCP-dependent proteasomal degradation of TAZ, resulting in an increase in TAZ-TEAD-induced genes, notably Ihh, which promotes HSC activation and liver fibrosis in NASH (Wang et al., 2016).

Comment in

  • Liver cholesterol matters.
    Cai B, Wang X. Cai B, et al. Aging (Albany NY). 2020 Oct 26;12(20):19828-19829. doi: 10.18632/aging.104208. Epub 2020 Oct 26. Aging (Albany NY). 2020. PMID: 33125343 Free PMC article. No abstract available.

References

    1. Adams D, Gonzalez-Duarte A, O’Riordan WD, Yang CC, Ueda M, Kristen AV, Tournev I, Schmidt HH, Coelho T, Berk JL, et al. (2018). Patisiran, an RNAi therapeutic, for hereditary transthyretin amyloidosis. N Engl J Med 379, 11–21. - PubMed
    1. Angulo P, Kleiner DE, Dam-Larsen S, Adams LA, Bjornsson ES, Charatcharoenwitthaya P, Mills PR, Keach JC, Lafferty HD, Stahler A, et al. (2015a). Liver fibrosis, but no other histologic features, is associated with long-term outcomes of patients with nonalcoholic fatty liver disease. Gastroenterology 149, 389–397 e310. - PMC - PubMed
    1. Angulo P, Machado MV, and Diehl AM (2015b). Fibrosis in nonalcoholic fatty liver disease: mechanisms and clinical implications. Semin Liver Dis 35, 132–145. - PubMed
    1. Athyros VG, Alexandrides TK, Bilianou H, Cholongitas E, Doumas M, Ganotakis ES, Goudevenos J, Elisaf MS, Germanidis G, Giouleme O, et al. (2017). The use of statins alone, or in combination with pioglitazone and other drugs, for the treatment of non-alcoholic fatty liver disease/non-alcoholic steatohepatitis and related cardiovascular risk. An Expert Panel Statement. Metabolism 71, 17–32. - PubMed
    1. Aylon Y, Gershoni A, Rotkopf R, Biton IE, Porat Z, Koh AP, Sun X, Lee Y, Fiel MI, Hoshida Y, et al. (2016). The LATS2 tumor suppressor inhibits SREBP and suppresses hepatic cholesterol accumulation. Genes Dev 30, 786–797. - PMC - PubMed

Publication types

MeSH terms

Substances