. 2020 Apr 30;181(3):716-727.e11.
doi: 10.1016/j.cell.2020.03.029. Epub 2020 Apr 6.

Genetic Screen for Cell Fitness in High or Low Oxygen Highlights Mitochondrial and Lipid Metabolism

Affiliations

Genetic Screen for Cell Fitness in High or Low Oxygen Highlights Mitochondrial and Lipid Metabolism

Isha H Jain et al. Cell. .

Abstract

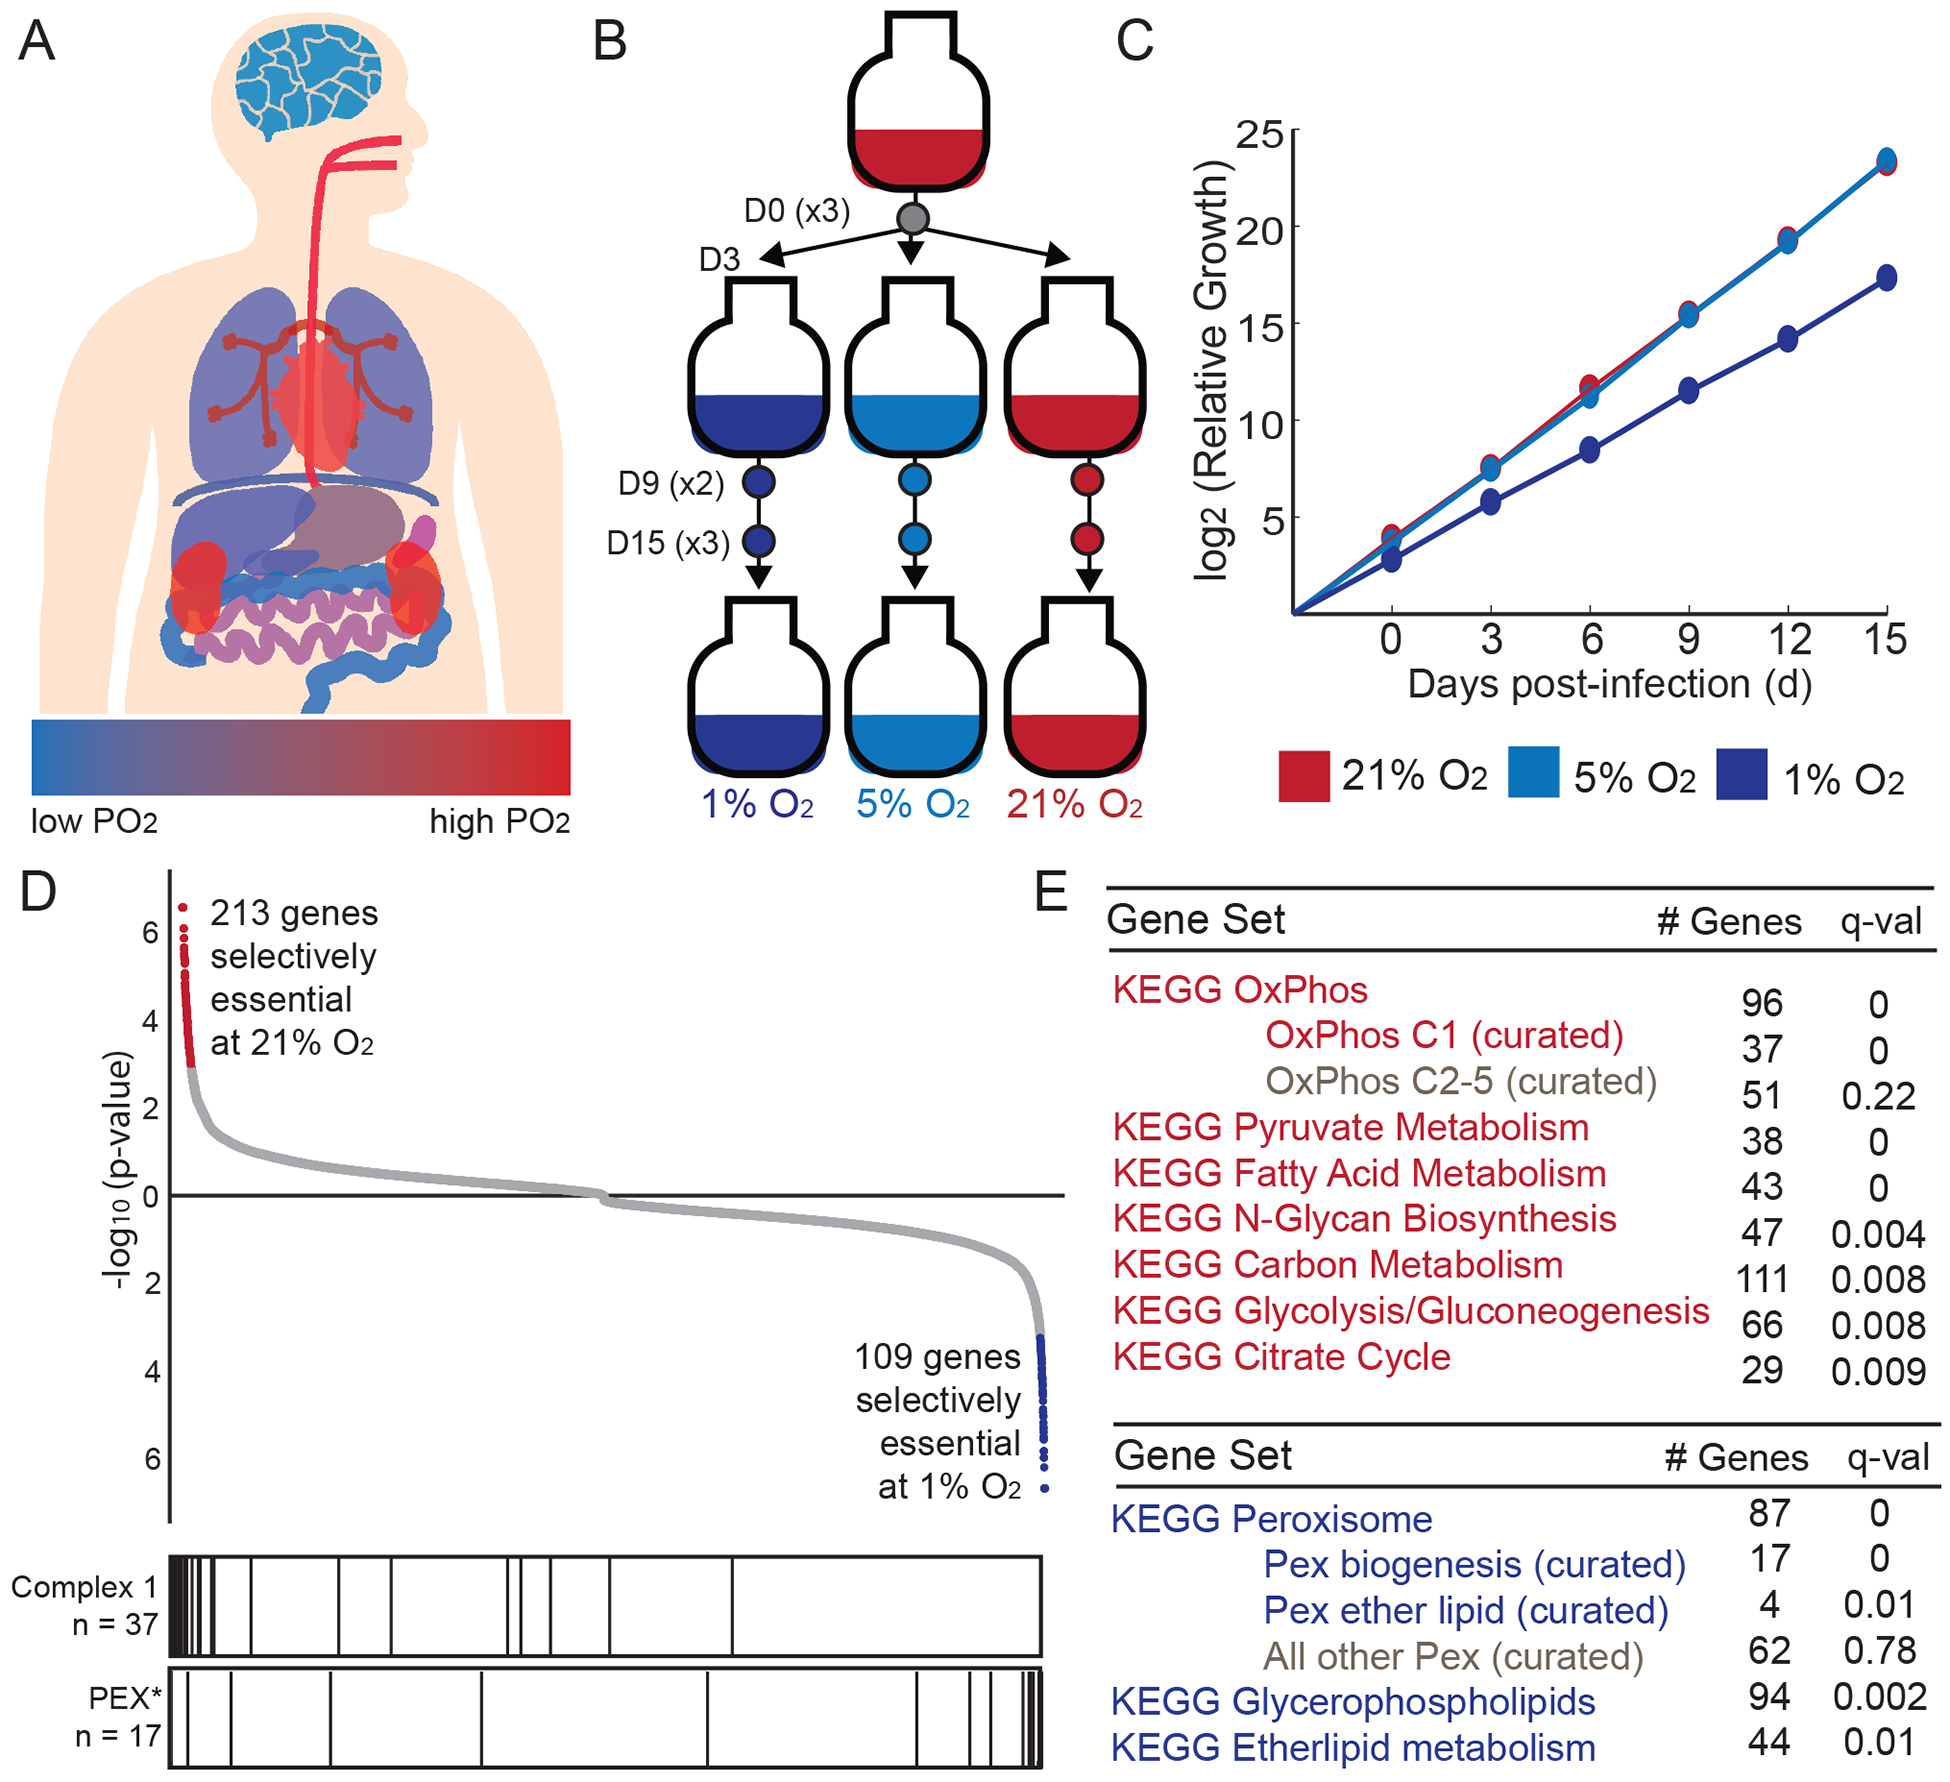
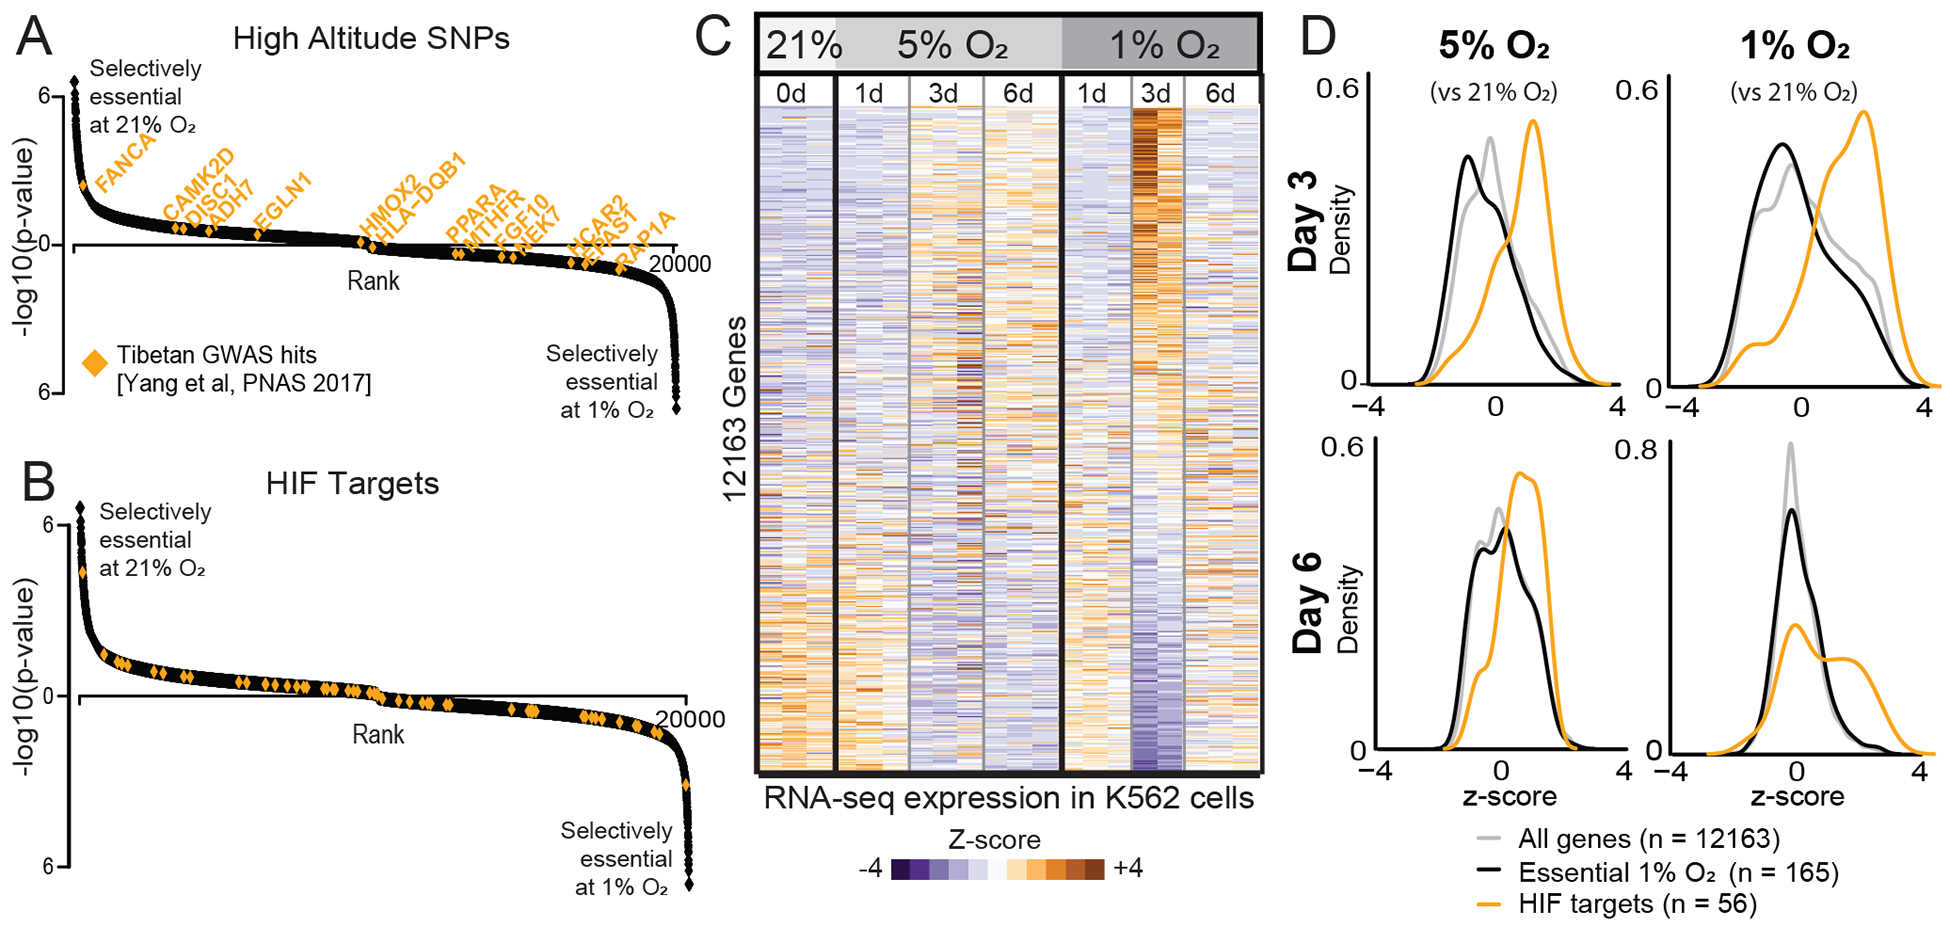
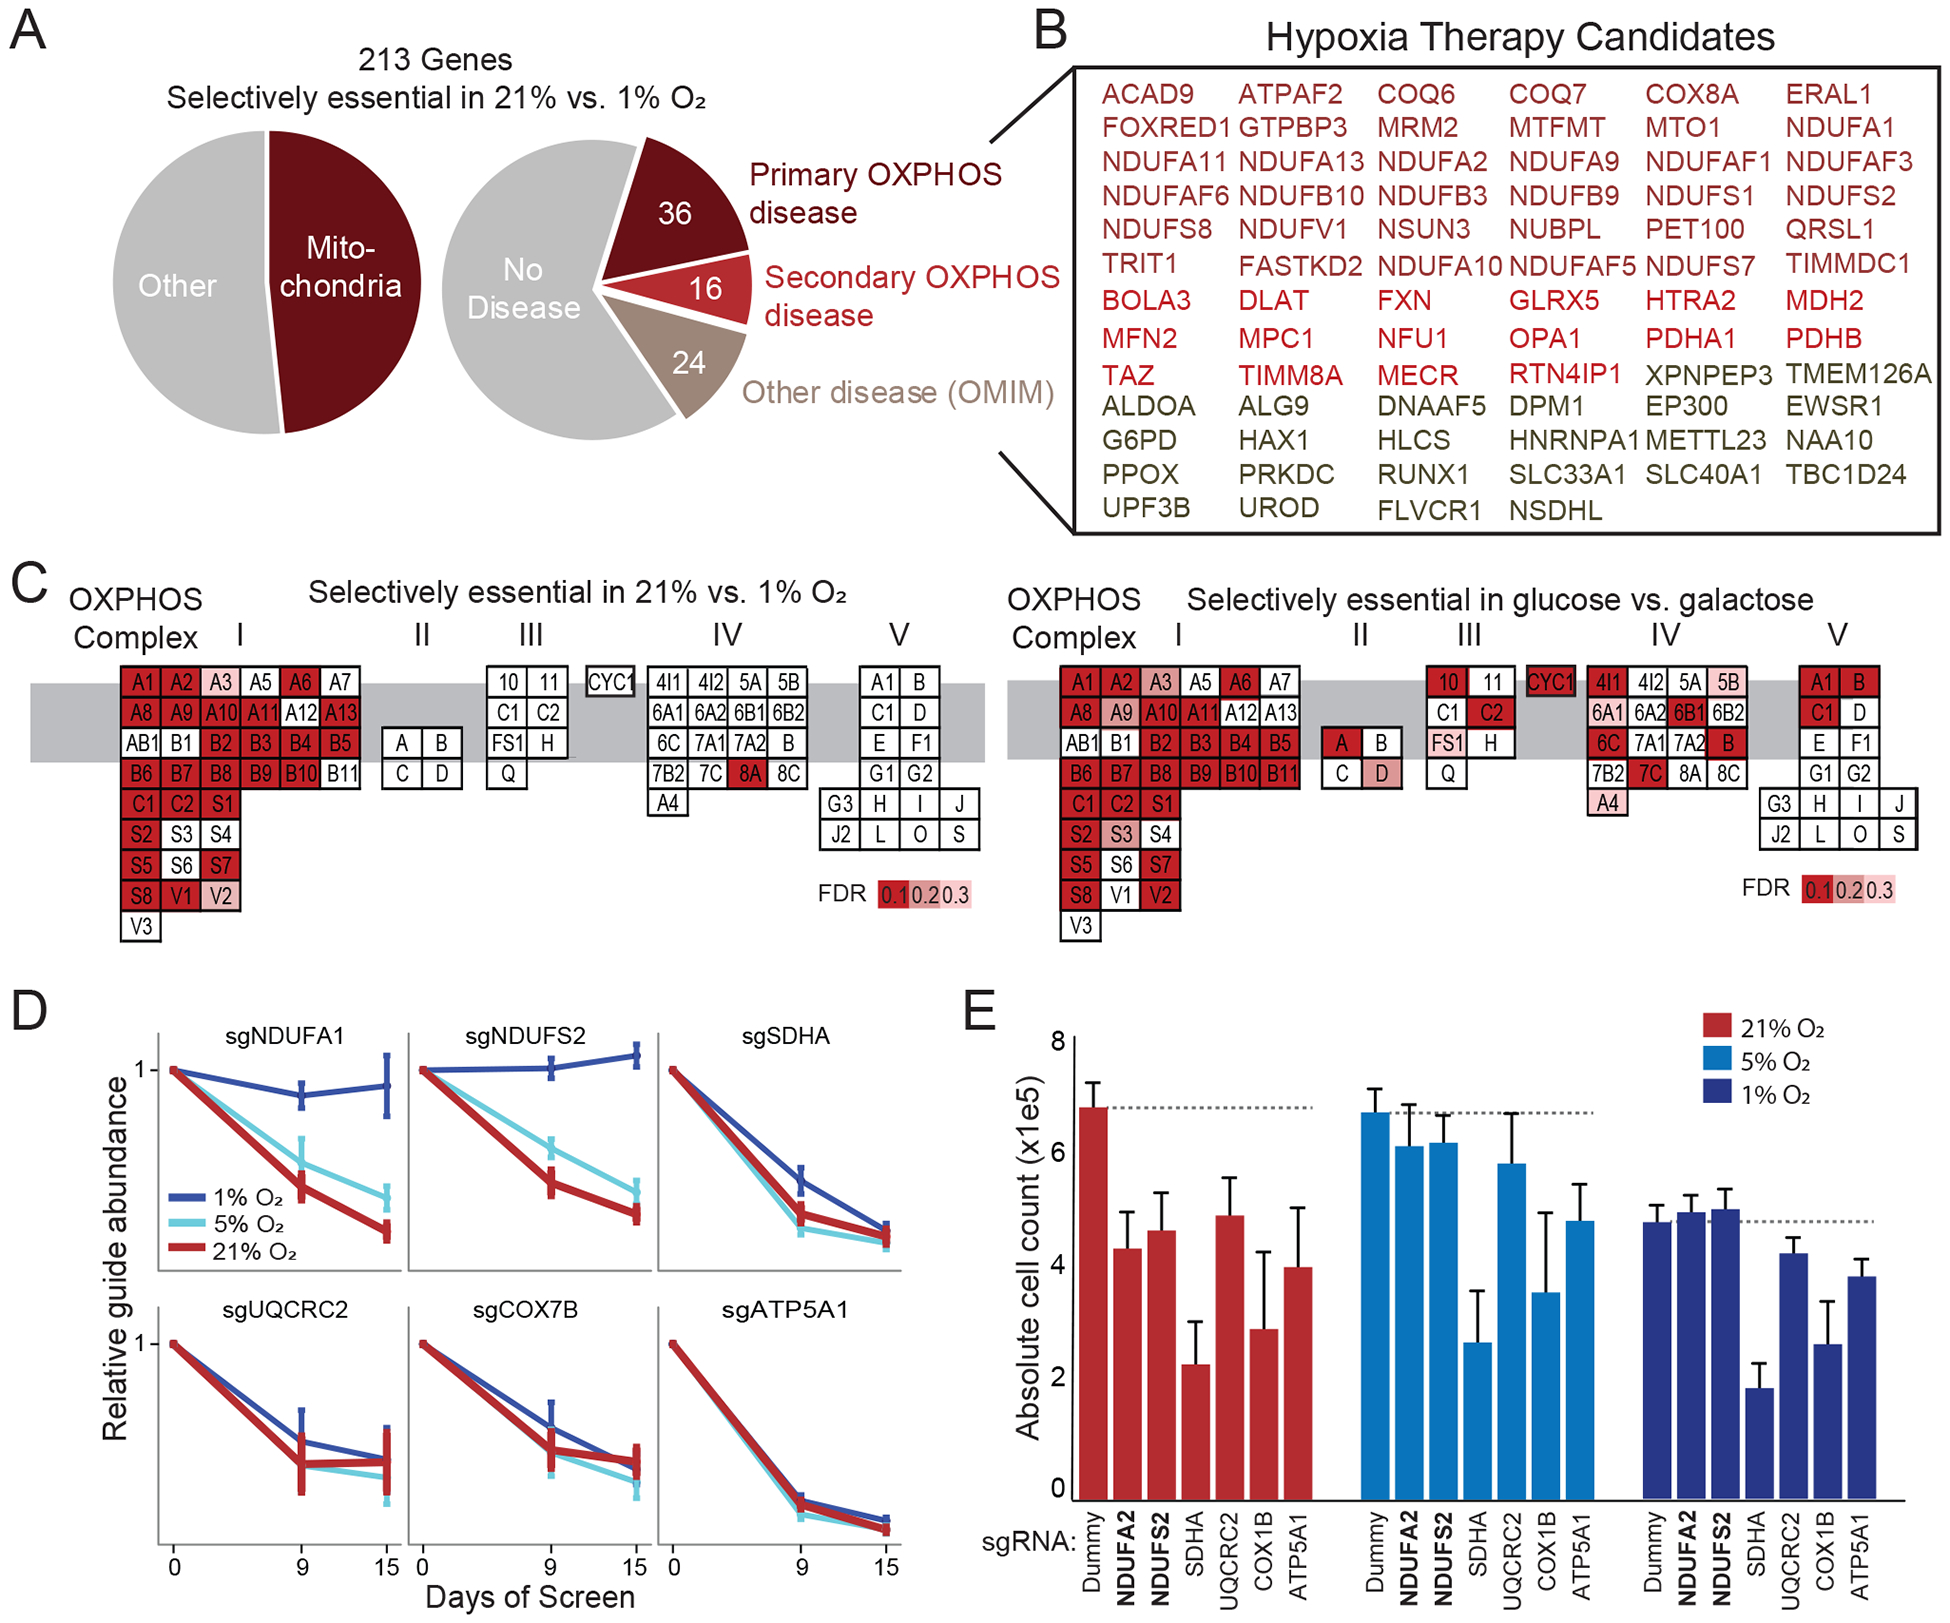
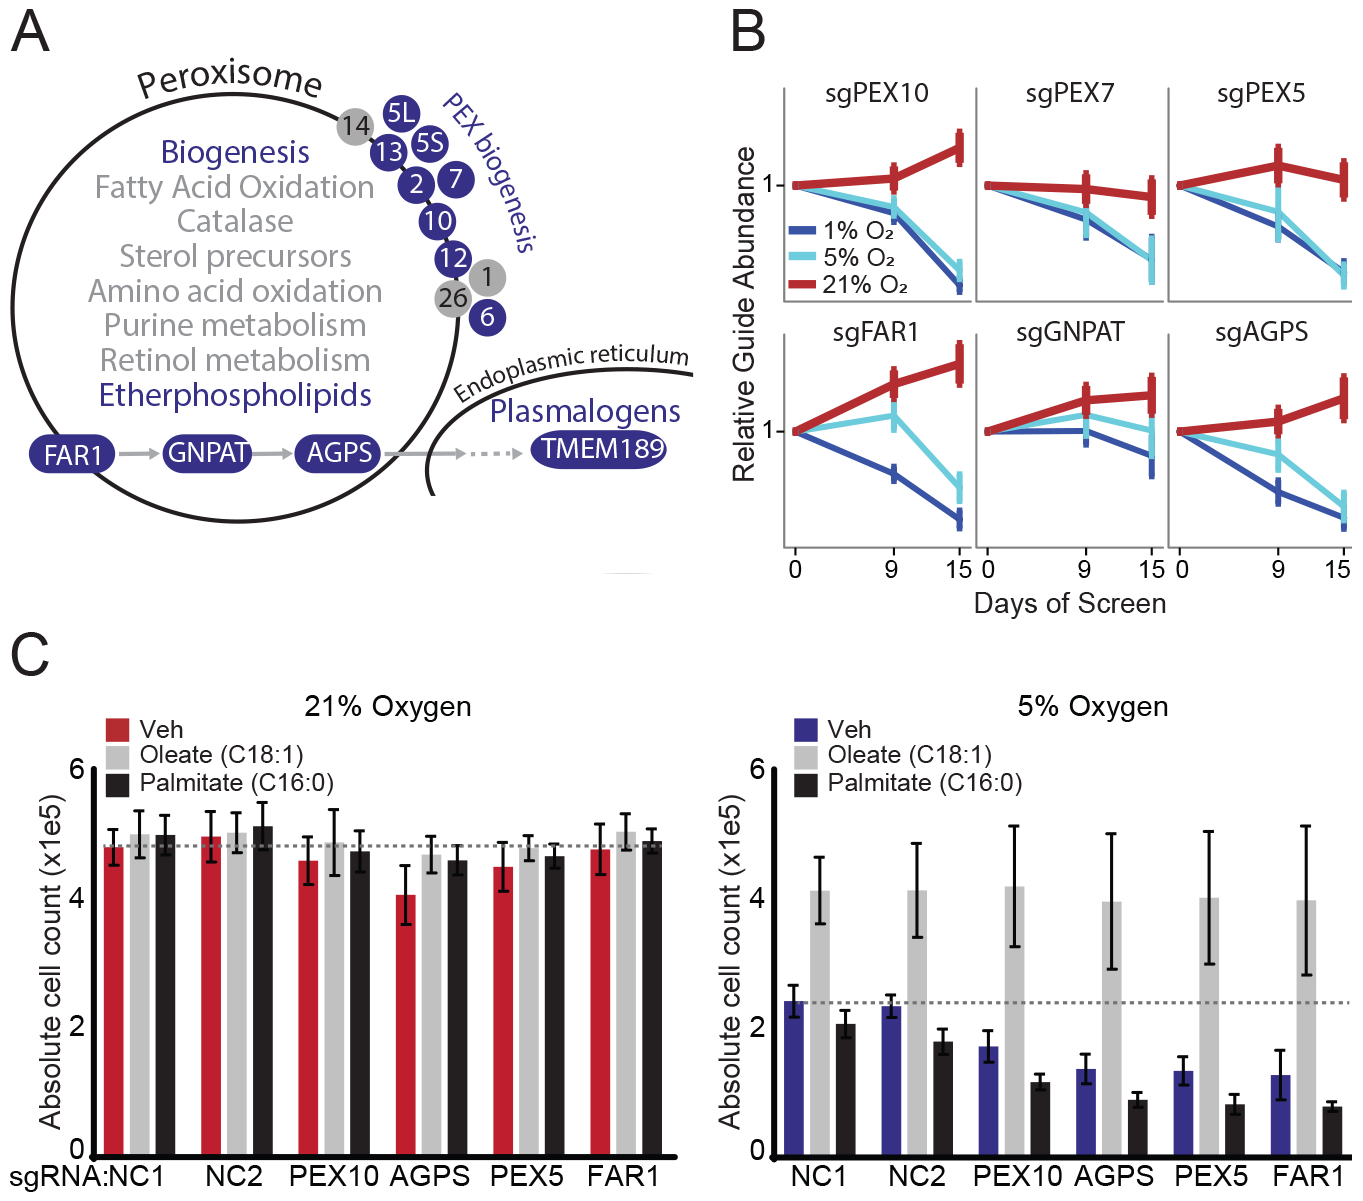
Human cells are able to sense and adapt to variations in oxygen levels. Historically, much research in this field has focused on hypoxia-inducible factor (HIF) signaling and reactive oxygen species (ROS). Here, we perform genome-wide CRISPR growth screens at 21%, 5%, and 1% oxygen to systematically identify gene knockouts with relative fitness defects in high oxygen (213 genes) or low oxygen (109 genes), most without known connection to HIF or ROS. Knockouts of many mitochondrial pathways thought to be essential, including complex I and enzymes in Fe-S biosynthesis, grow relatively well at low oxygen and thus are buffered by hypoxia. In contrast, in certain cell types, knockout of lipid biosynthetic and peroxisomal genes causes fitness defects only in low oxygen. Our resource nominates genetic diseases whose severity may be modulated by oxygen and links hundreds of genes to oxygen homeostasis.

Keywords: CoQ biosynthesis; FASII; MPC; TMEM189; hypoxia; iron-sulfur clusters; membrane fluidity; plasmalogens; pyruvate dehydrogenase; type II fatty acid synthesis.


Conflict of interest statement

Declaration of Interests V.K.M. is a paid scientific advisor to 5AM Ventures and Janssen Pharmaceuticals. O.S.S. is a paid consultant for Proteinaceous. V.K.M. and I.H.J are listed as inventors on a patent application filed by Massachusetts General on the use of hypoxia as a therapeutic strategy.

Figures

Figure 1.
Figure 1.. Genome-wide screen identifies genes that are selectively essential as a function of oxygen levels.
(A) Approximate tissue PO2 values across the human body (Carreau et al., 2011); blue for low PO2 and red for high PO2. (B) Experimental design for genome-wide screen. Three environmental oxygen tensions were tested at Day 0, 9 and 15 of treatment (n = 3 per D15 and D0 time points, n = 2 for D9 time points). (C) Cumulative relative growth throughout screens for cells exposed to 1, 5, 21% O2 (average shown for all technical replicates, curves at 21% and 5% overlap). (D) All 20,112 genes are ranked by their selective essentiality in 21% vs. 1% O2. The two sides of the list are compiled independently by running MAGeCK analysis on 21% vs. 1% O2 and then in 1% vs. 21% O2. Red and blue color indicates genes selectively essential at 10% FDR. Bar plot vertical lines indicate position of genes in complex I or peroxisome biogenesis (PEX*) gene sets. (E) KEGG pathways that are selectively essential in 1% O2 (blue) or 21% O2 (red).
Figure 2.
Figure 2.. High-altitude SNPs and hypoxia-inducible transcripts are not selectively essential as a function of oxygen levels.
(A) High-altitude SNPs identified in Tibetan high-altitude natives (Yang et al., 2017) shown in orange on genes ranked as in Figure 1D. (B) Canonical HIF targets (Benita et al., 2009) shown in orange. (C) Heatmap of normalized transcript levels in 21%, 5% and 1% O2 performed in triplicate. Relative expression (Z-score) indicates genes down-regulated (blue) or up-regulated (orange) in hypoxia. (D) Distribution of gene expression Z-scores at two time points at 5% and 1% O2 relative to 21% O2. All genes shown in light gray. Genes selectively essential in 1% vs. 21% O2 from CRISPR screen (FDR<0.3) shown in black. Experimentally defined HIF targets (Benita et al., 2009) shown in orange.
Figure 3.
Figure 3.. Mitochondrial genes are selectively essential at high oxygen levels.
(A) Percentage of screening hits that encode mitochondrial proteins (left) or underlie human Mendelian disease (right) (Frazier et al., 2019; Hamosh et al., 2005). (B) Disease genes whose loss is buffered by hypoxia in cell culture. Different colors correspond to primary or secondary mitochondrial disease (Frazier et al., 2019), or non-mitochondrial diseases. (C) OXPHOS genes are organized by complex with red indicating genes that are hits in current screen (selectively essential in 21% vs. 1% O2, left panel) or in the glucose-galactose screen (unable to survive in galactose, right panel) (Arroyo et al., 2016). Genes are ordered alphabetically within complex using complex-specific prefixes (NDUF, SDH, UQCR, COX, ATP5) (e.g. A1 in CI refers to NDUFA1 whereas A in CII refers to SDHA). (D) sgRNA abundance at different time points of screen and oxygen tensions for CI-CV genes. Mean relative abundance (+/− SEM) shown across 4 guides per gene across all screen replicates. (E) Experimental validation in HEK293T knockout cell lines shows three-day growth as a function of oxygen tension (mean n=6 replicates +/− SD, Dummy indicates non-coding control). While all knockouts showed reduced growth compared to Dummy in 21% O2 and 5% O2, only complex I knockouts (bold text) show similar or increased growth in 1% O2.
Figure 4.
Figure 4.. Peroxisomal genes are selectively essential in low oxygen.
(A) Schematic of peroxisomal pathways with blue color indicating pathways and genes selectively essential in 1% vs. 21% O2 (FDR≤0.3). Subunits refer to PEX biosynthesis genes (e.g. 10 refers to PEX10). (B) sgRNA abundance corresponding to ether phospholipid synthesis genes and peroxisome biogenesis genes. Mean sgRNA relative abundance (+/− SEM) shown across 4 guides per gene across all screen replicates. (C) Cell counts for HEK293T non-coding (NC) control and knockout cell lines grown in low serum (3% FBS) for 2 days at different oxygen tensions and treated with vehicle, 10μM oleic or 10μM palmitic acid. Bars indicate averages (+/−SD) for triplicate experiments each with technical duplicates (n = 6). Dotted line indicates level of NC1 vehicle-treated control cells.
Figure 5:
Figure 5:. Peroxisomal lipids are synthesized in hypoxia.
(A) Density plot shows saturated lipid levels increased after 24 hr exposure to hypoxia (5% oxygen) in K562 control cells treated with sgDummy (non-coding control). (B) Density plot shows lipid classes that are increased during hypoxia in K562 control cells treated with sgDummy. (C) Volcano plot shows all confirmed peroxisome-derived lipids, where color indicates lipid class and shape indicates linkage (circle denotes ether, cross denotes vinyl-ether). (D) Heatmaps show all eight peroxisome-derived lipids that are significantly increased in hypoxia in K562 cells treated with sgDummy (non-coding control) (top) and all lyso-phospholipids (bottom). Heatmaps show relative lipid abundance in sgDummy and CRISPR knockout cell lines, with lipids ordered by fold change (FC) between mean of control cells in 5% vs. 21% oxygen. Bold indicates peroxisome-derived lipids and asterisk indicates lipid not elevated in hypoxia. (E-G) Fold change of selected lyso-phospholipid species in hypoxia (5% vs. 21%) in K562 cells (panel E) and HEK293T cells (panel F) and in HEK293T cells with SCDi treatment (SCDi vs. Veh, panel G). (H) Fold change of saturated DAG species in different conditions (compared to sgDummy at 21% O2) shows changes due to FAR1 knockout, hypoxia, and FAR1 knockout and hypoxia. (I) Schematic model shows hypoxia inhibits SCD which induces toxicity that can be abrogated by three known mechanisms: lipid droplet formation (Piccolis et al., 2019), lyso-phospholipid scavenging (Kamphorst et al., 2013), or peroxisomal ether lipid synthesis shown here.
Figure 6.
Figure 6.. Essentiality of peroxisome genes correlates with lipid saturation across hundreds of cell lines.
(A) For each of 17635 genes, correlation between growth of CRISPR knockout (CERES score) and lipid desaturation metric (weighted mean number double bonds) are shown for three lipid classes: lyso-phosphatidylethanolamine (LPE), triacylglyerol (TAG), and phosphatidylcholine (PC). Significant hits shown in red (Bonferroni corrected p-value < 0.05). Positive correlation indicates genes are essential in cells with high levels of saturated lipids. (B) For two top-scoring genes (PEX2 and SCD), Spearman correlations between individual lipid abundance and growth of CRISPR knockout (CERES score, where lower score indicates lower growth, i.e. greater essentiality) are shown for all measured lipids in each class. Lipids are grouped by the number of double bonds (e.g. LPE(16:0) and LPE(18:0) grouped under LPE.0), and individual lipids are colored by significance of correlation. Figure S5 shows results for all lipids.

Similar articles

Cited by

References

    1. Ackerman D, and Simon MC (2014). Hypoxia, lipids, and cancer: surviving the harsh tumor microenvironment. Trends Cell Biol 24, 472–478. - PMC - PubMed
    1. Ackerman D, Tumanov S, Qiu B, Michalopoulou E, Spata M, Azzam A, Xie H, Simon MC, and Kamphorst JJ (2018). Triglycerides Promote Lipid Homeostasis during Hypoxic Stress by Balancing Fatty Acid Saturation. Cell Rep 24, 2596–2605 e2595. - PMC - PubMed
    1. Alvarez SW, Sviderskiy VO, Terzi EM, Papagiannakopoulos T, Moreira AL, Adams S, Sabatini DM, Birsoy K, and Possemato R (2017). NFS1 undergoes positive selection in lung tumours and protects cells from ferroptosis. Nature 551, 639–643. - PMC - PubMed
    1. Arroyo JD, Jourdain AA, Calvo SE, Ballarano CA, Doench JG, Root DE, and Mootha VK (2016). A Genome-wide CRISPR Death Screen Identifies Genes Essential for Oxidative Phosphorylation. Cell Metab 24, 875–885. - PMC - PubMed
    1. Ast T, Meisel JD, Patra S, Wang H, Grange RMH, Kim SH, Calvo SE, Orefice LL, Nagashima F, Ichinose F, et al. (2019). Hypoxia Rescues Frataxin Loss by Restoring Iron Sulfur Cluster Biogenesis. Cell 177, 1507–1521 e1516. - PMC - PubMed

Publication types