. 2020 Apr:84:29-44.
doi: 10.1016/j.exphem.2020.03.003. Epub 2020 Apr 4.

Phospho-proteomic discovery of novel signal transducers including thioredoxin-interacting protein as mediators of erythropoietin-dependent human erythropoiesis

Affiliations

Phospho-proteomic discovery of novel signal transducers including thioredoxin-interacting protein as mediators of erythropoietin-dependent human erythropoiesis

Matthew A Held et al. Exp Hematol. 2020 Apr.

Abstract

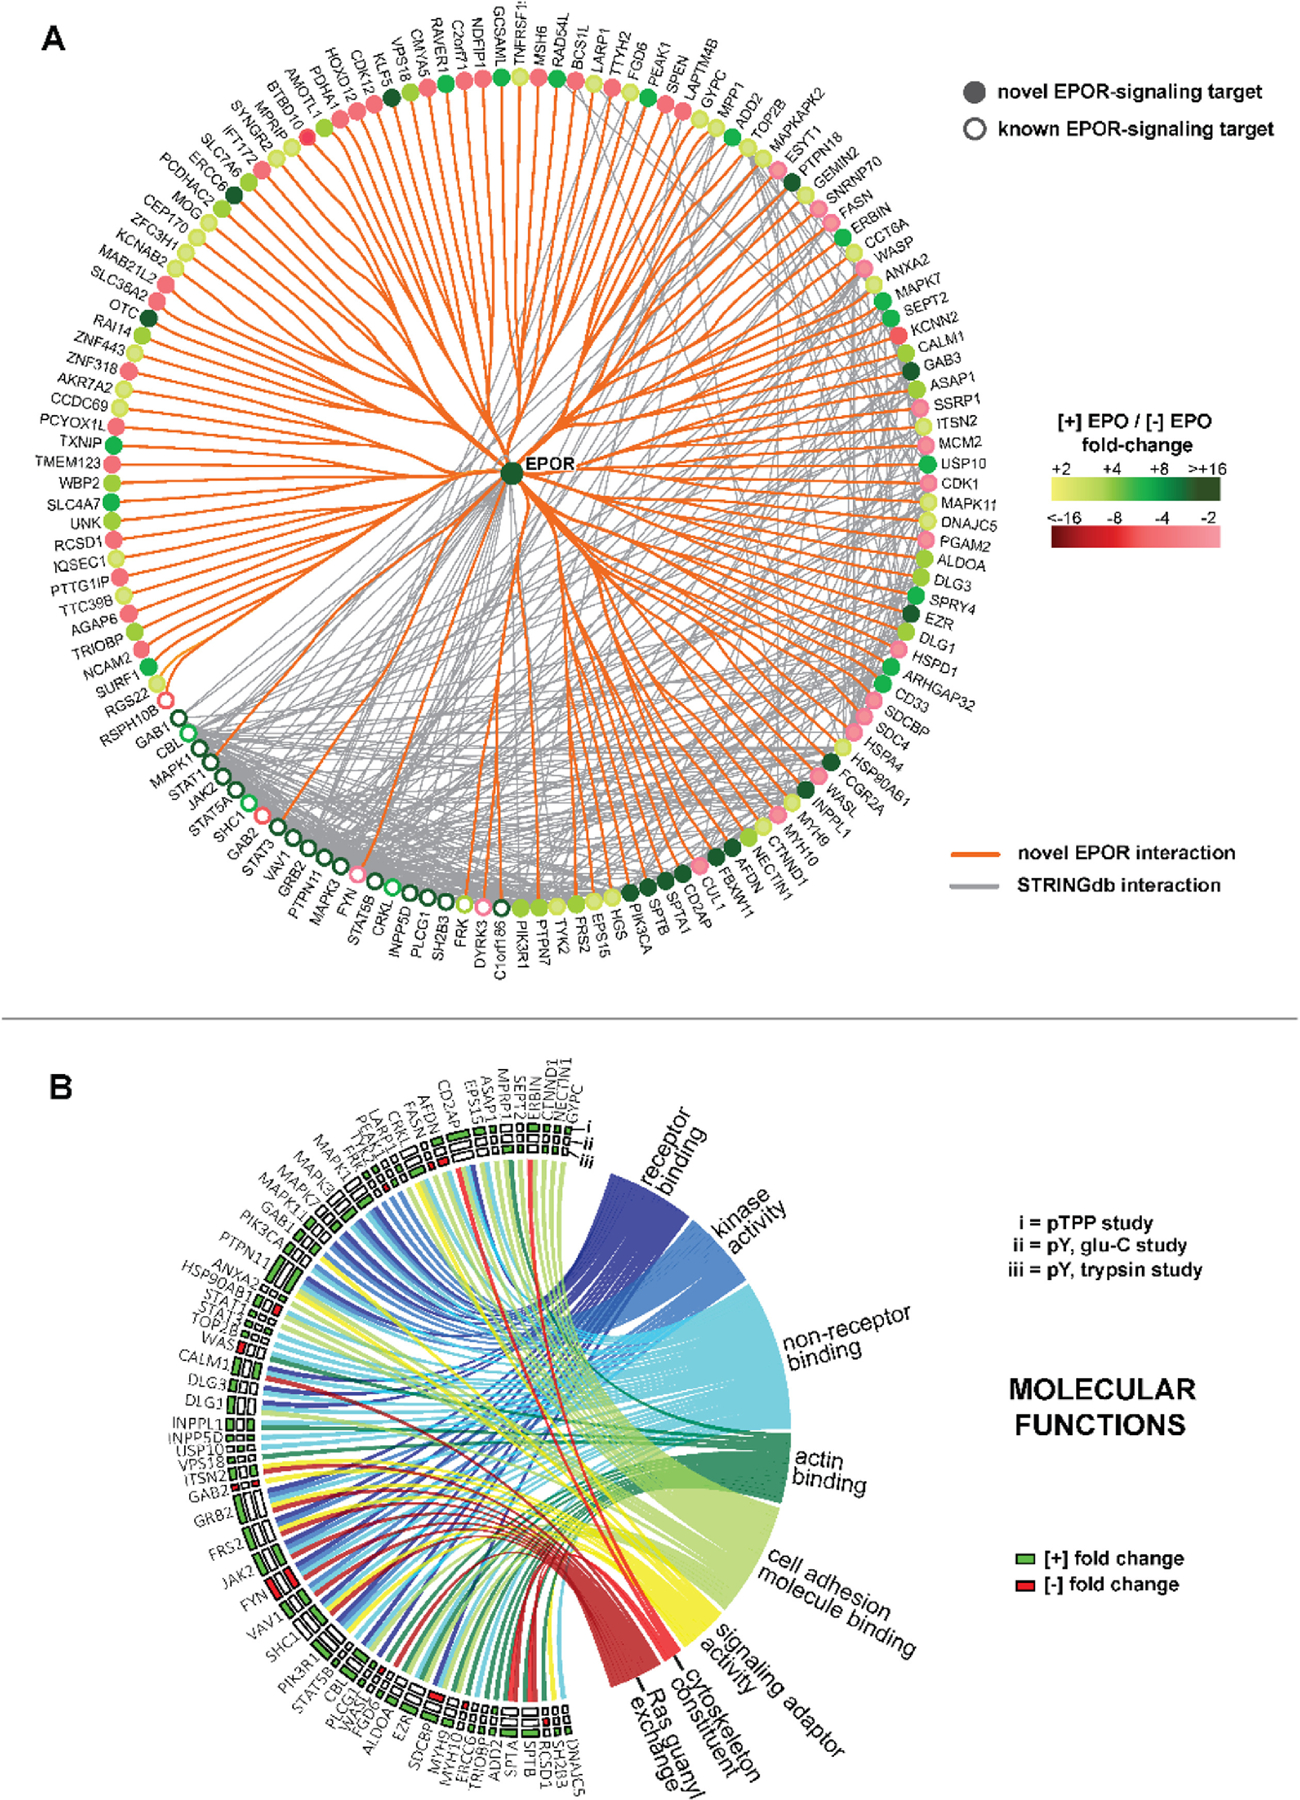
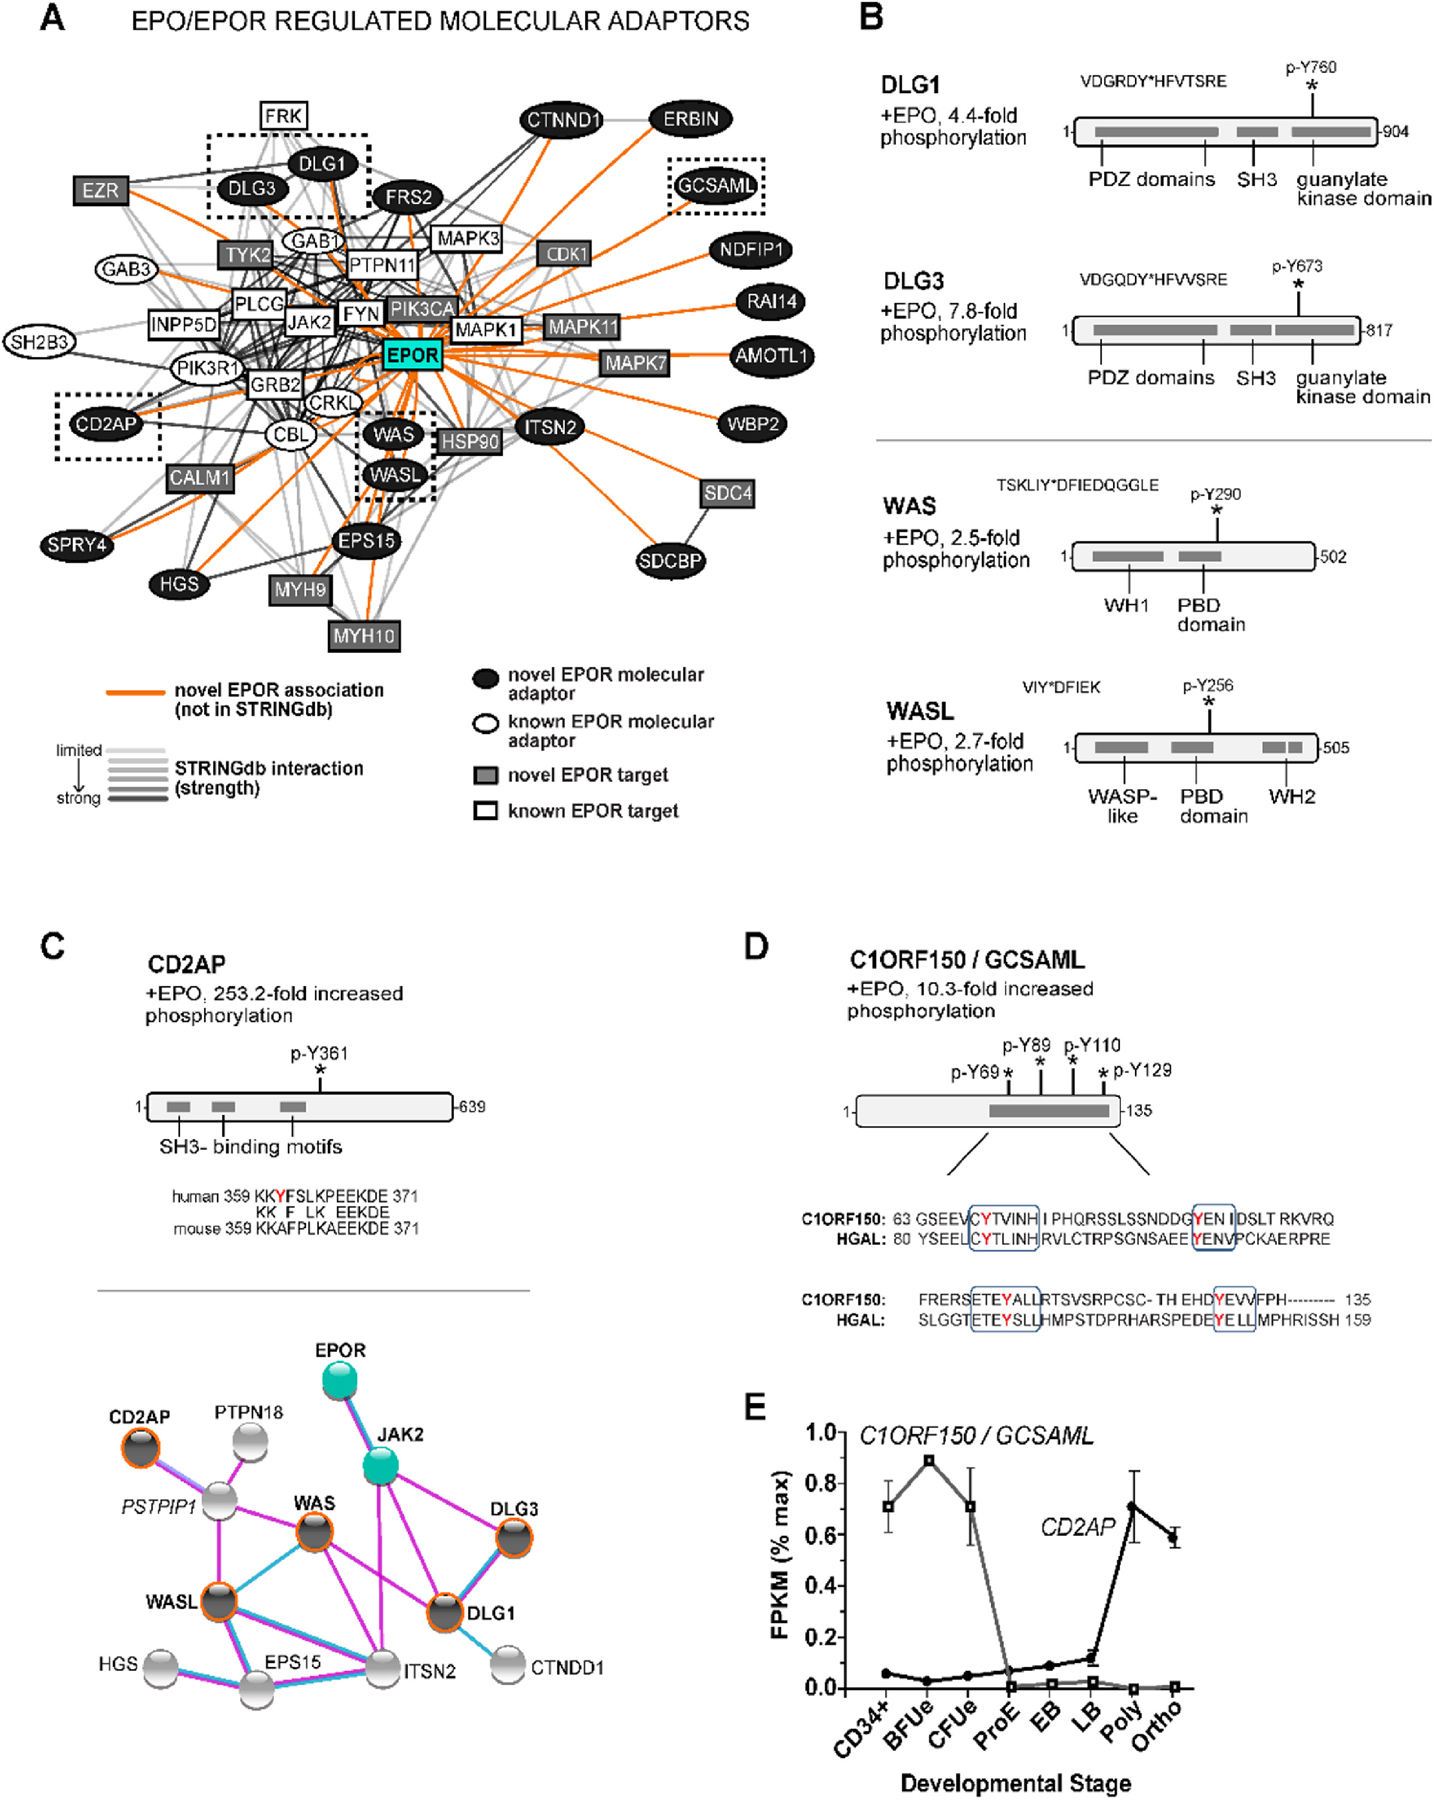
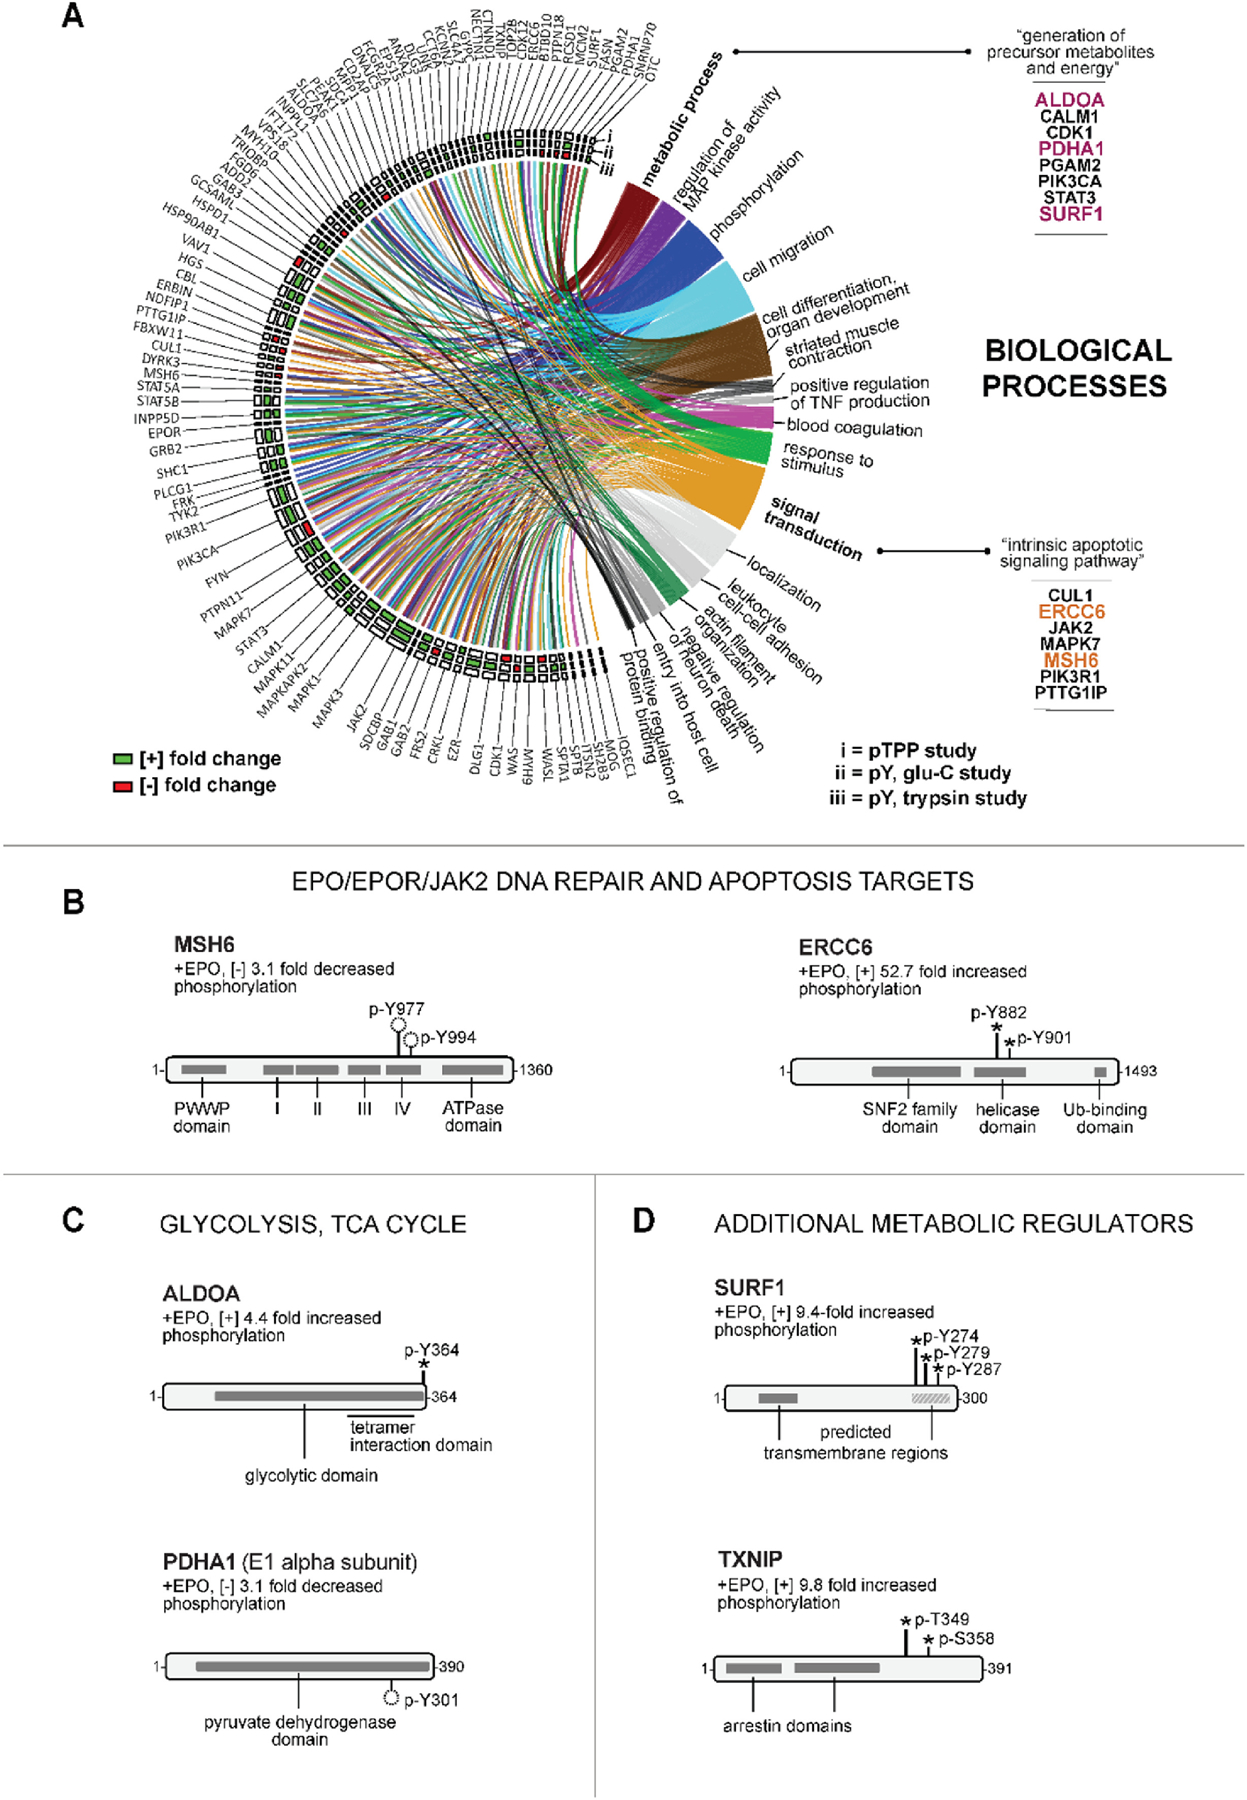
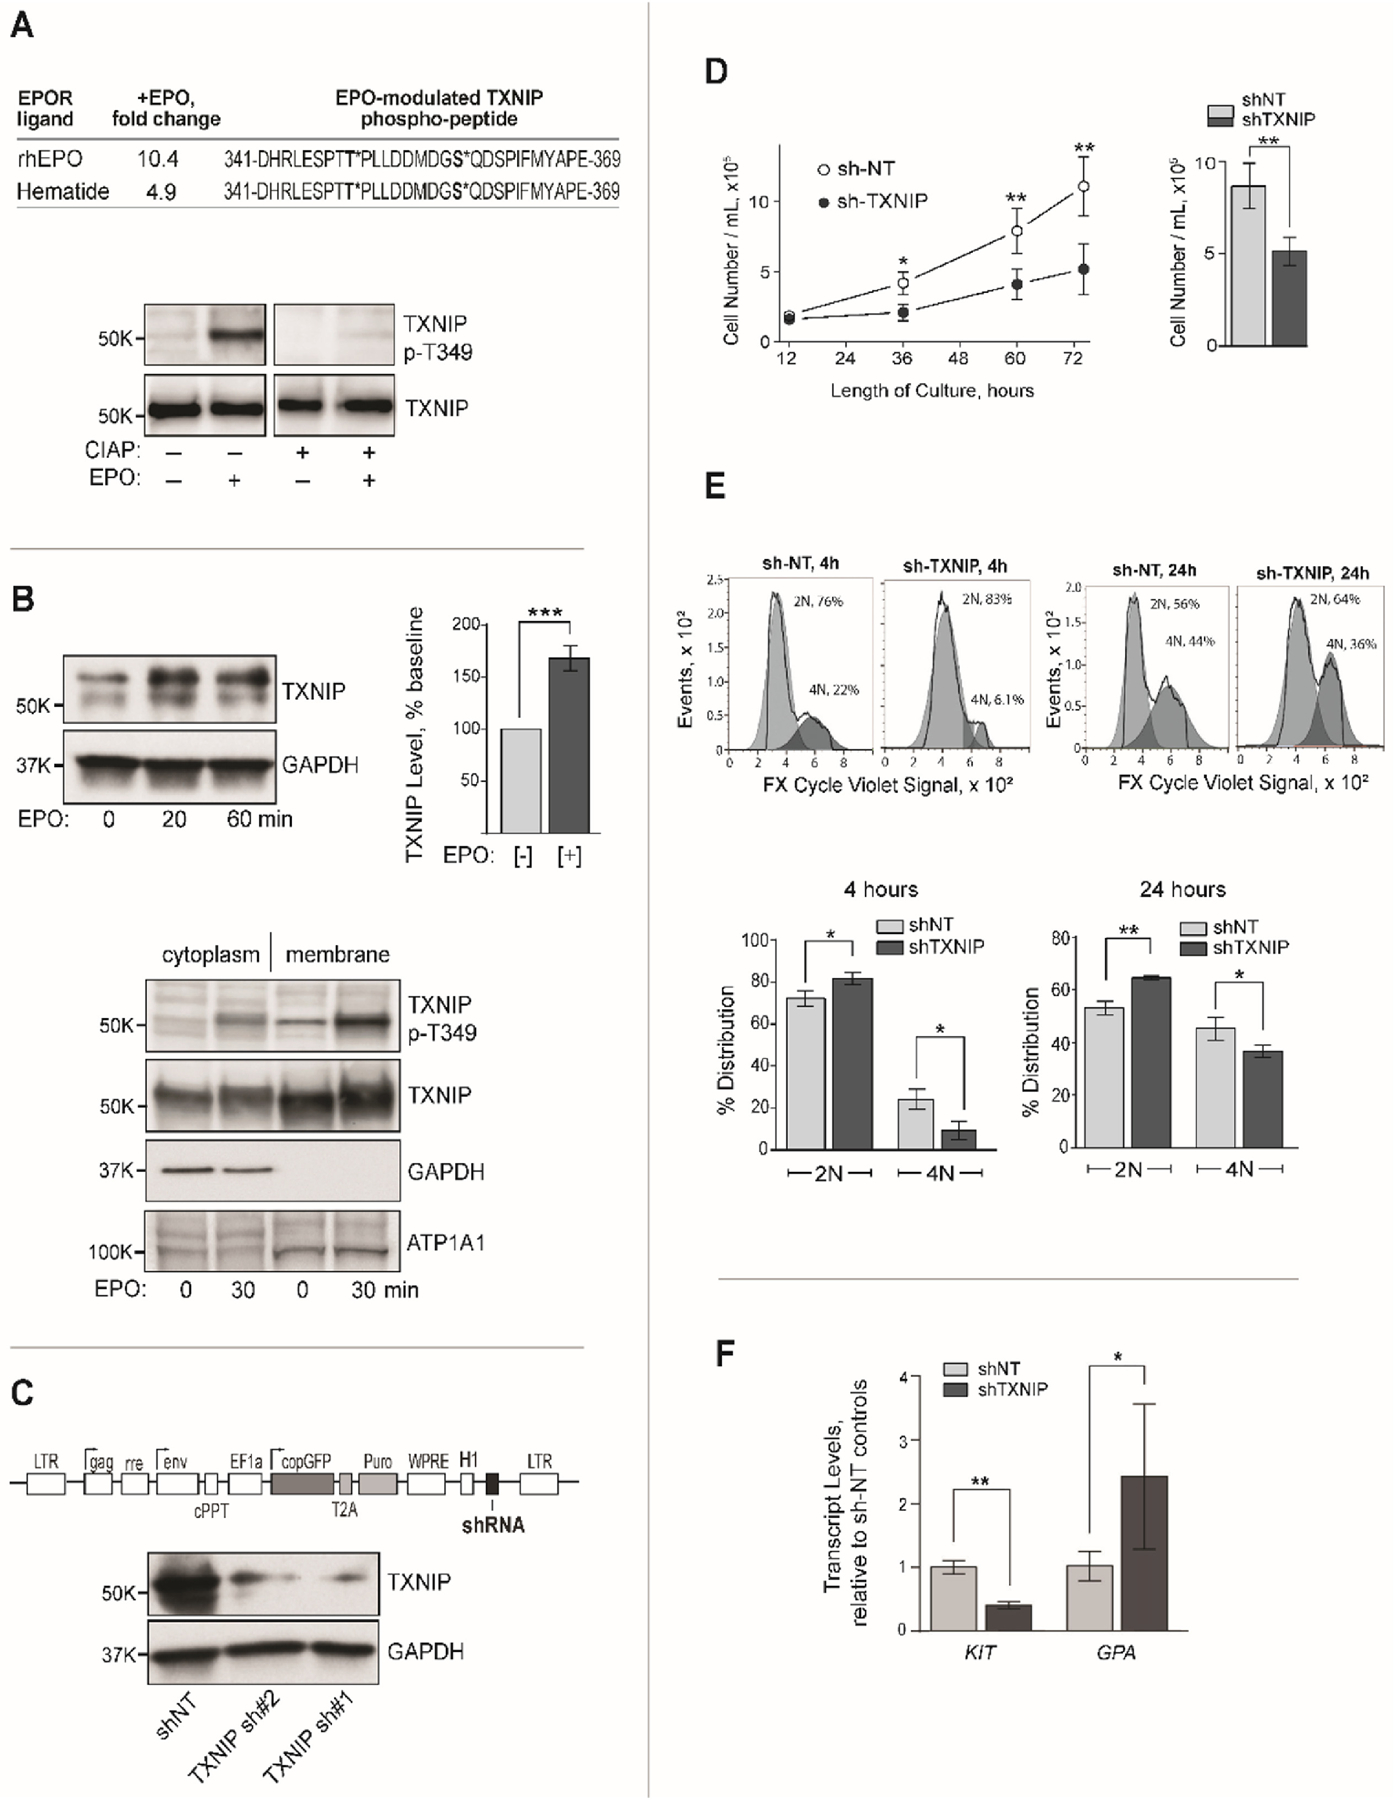
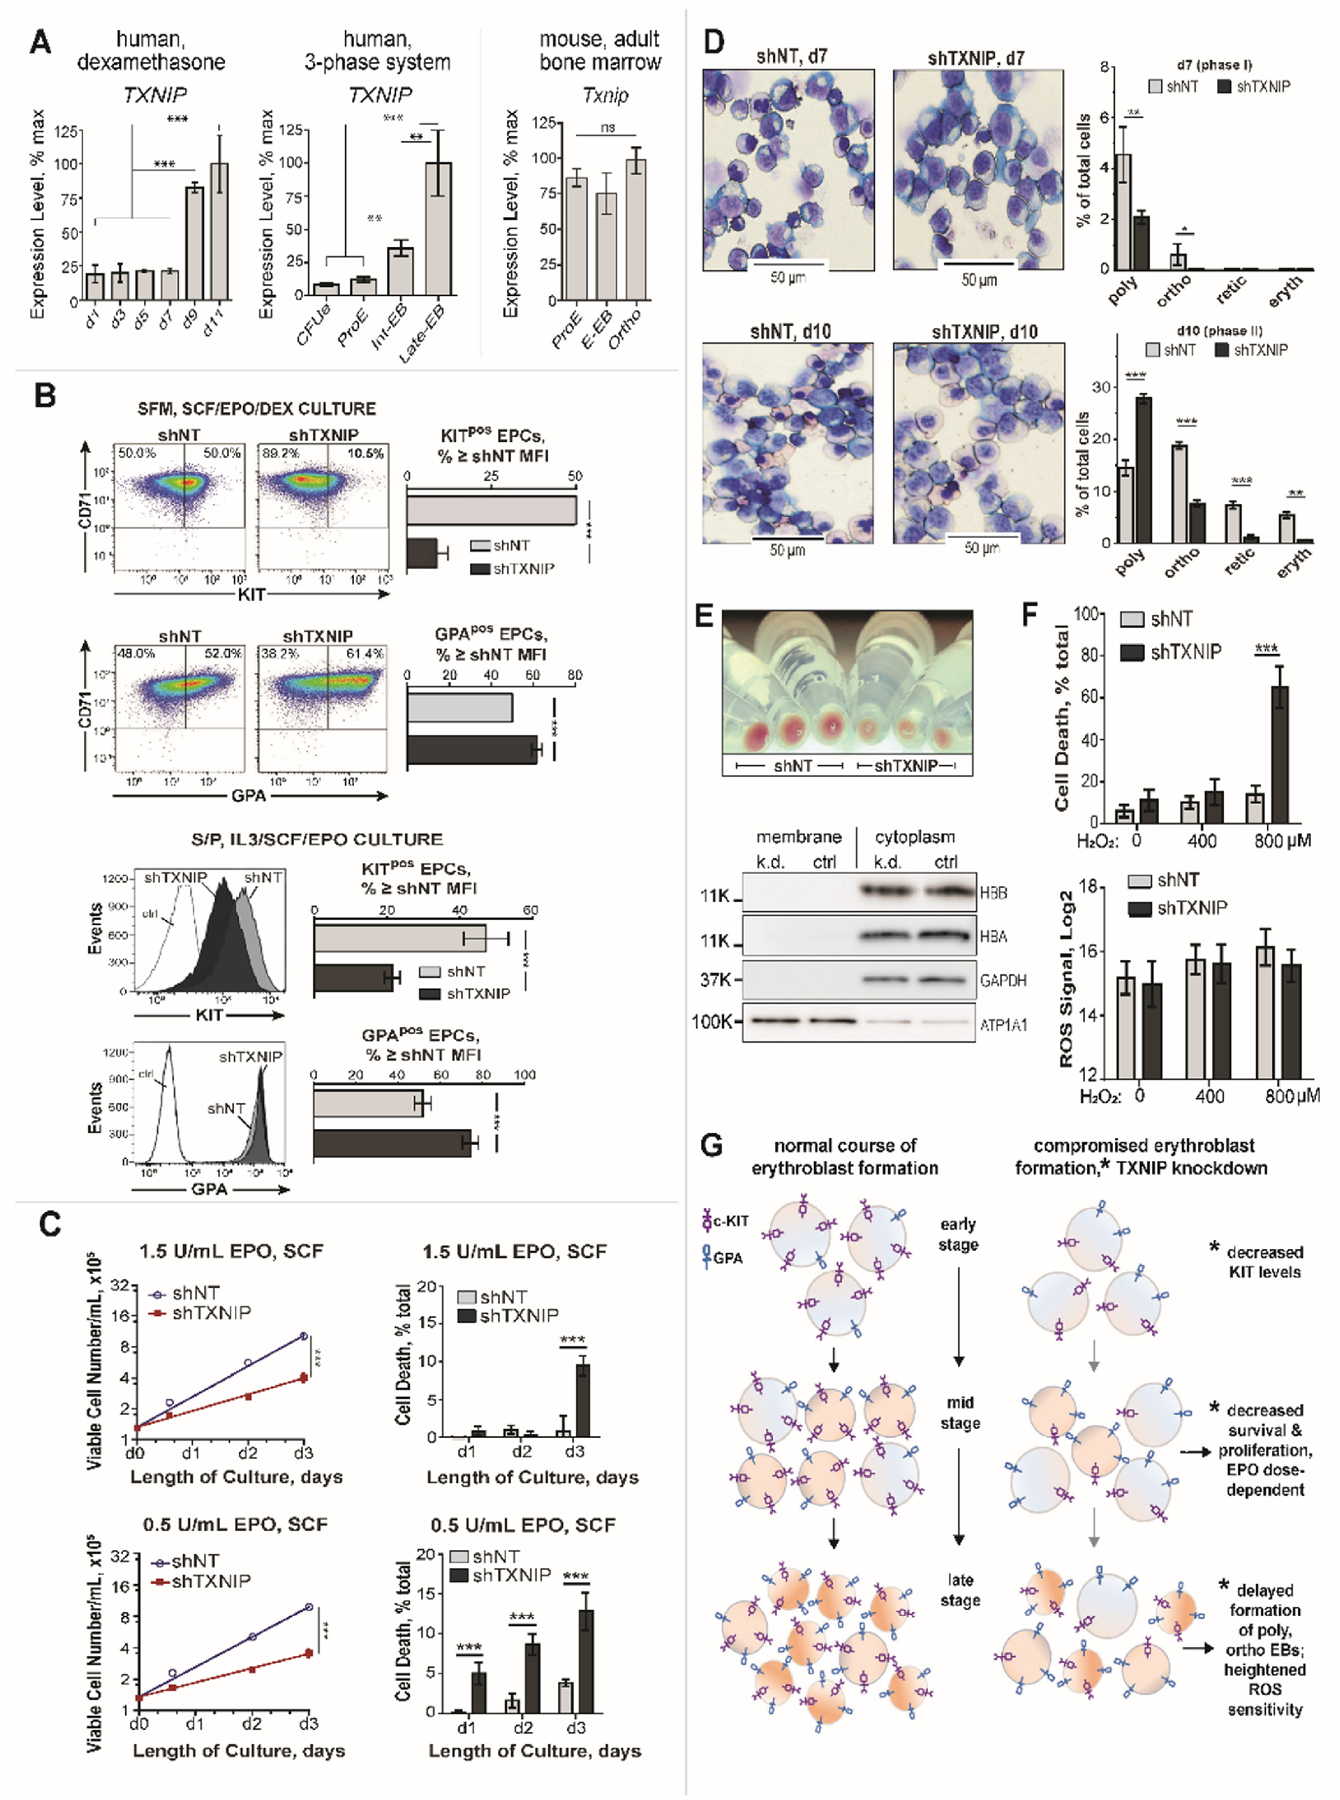
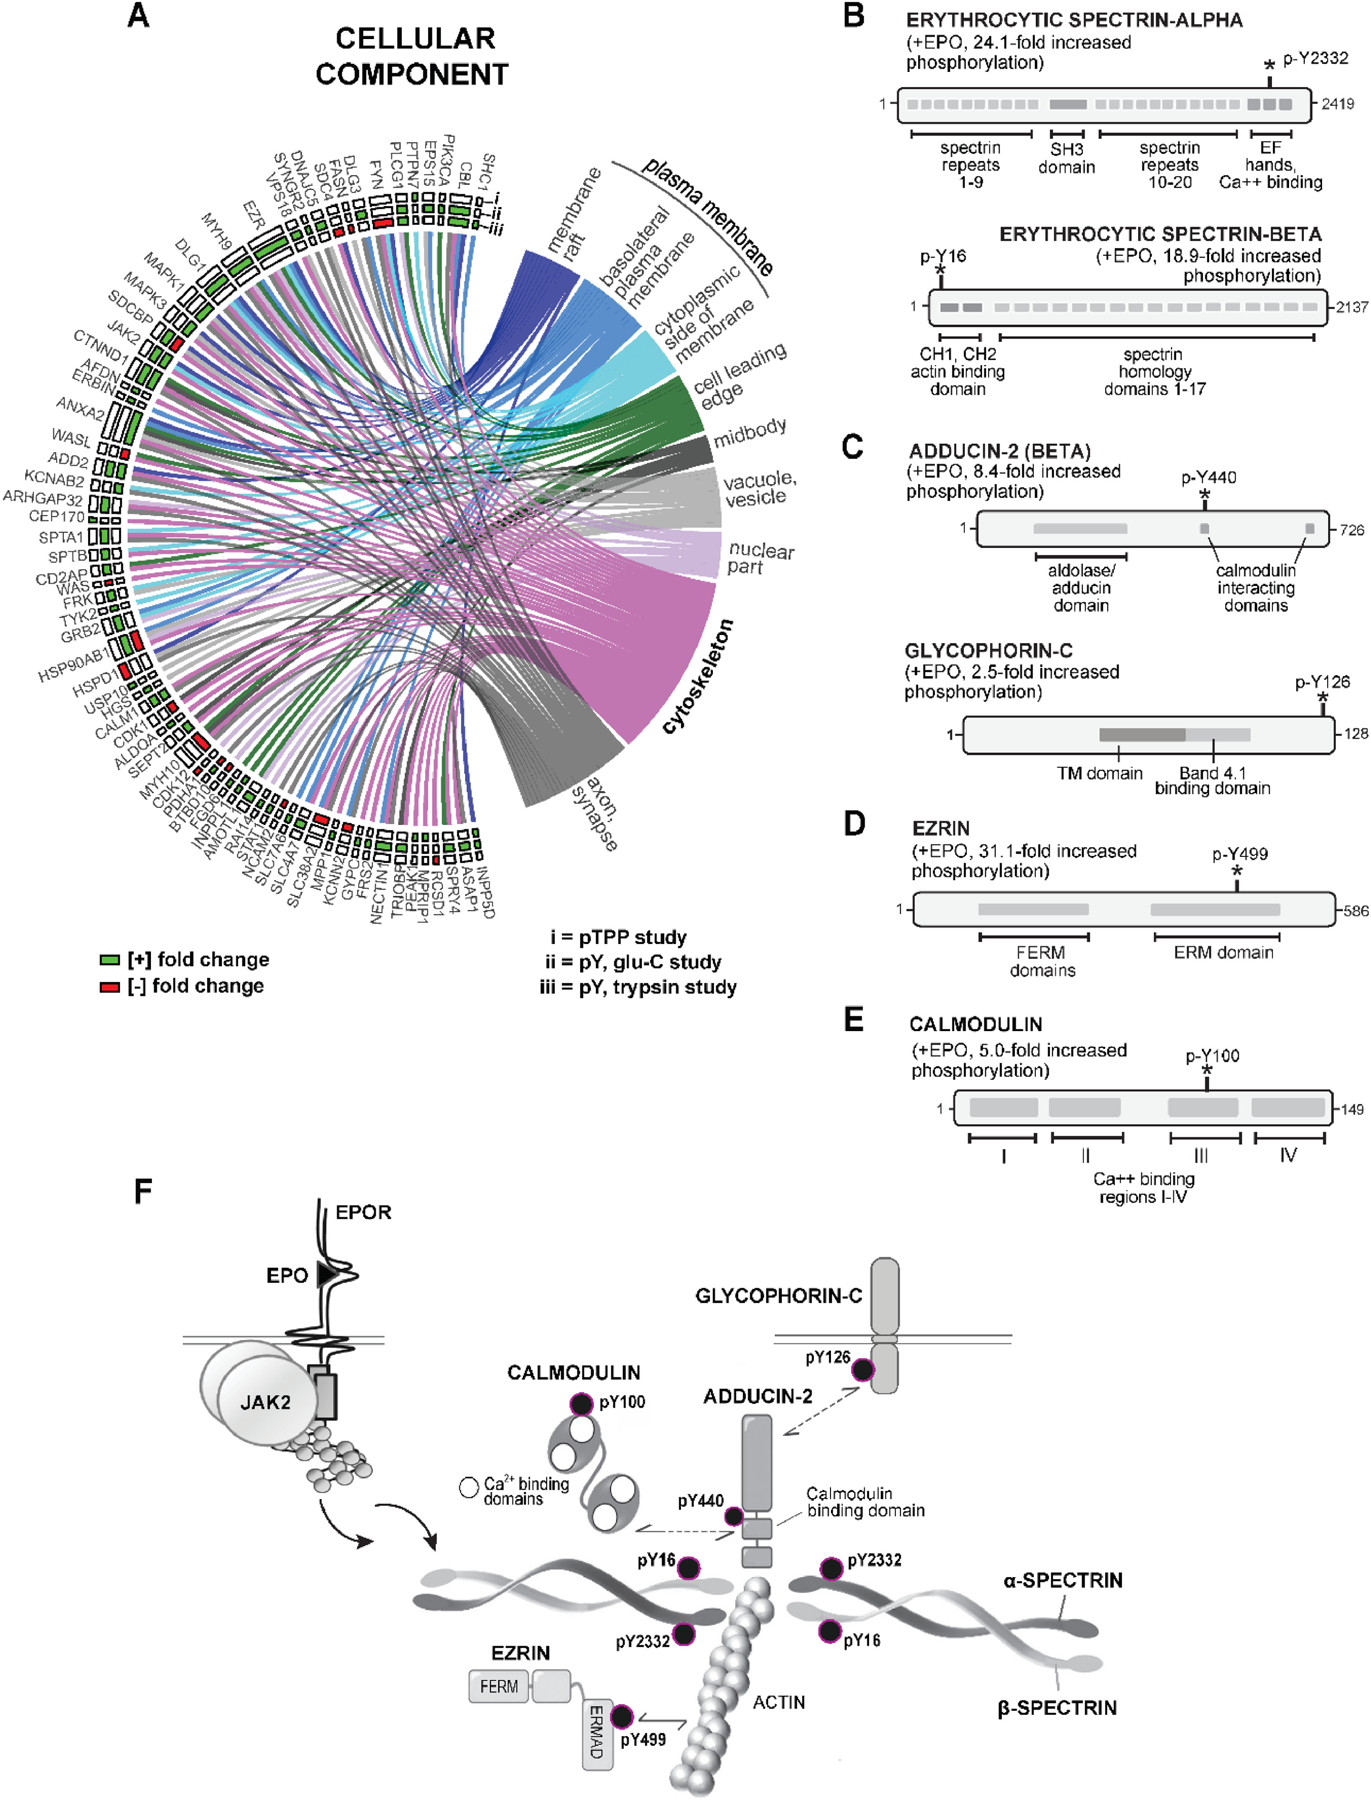
Erythroid cell formation critically depends on signals transduced via erythropoietin (EPO)/EPO receptor (EPOR)/JAK2 complexes. This includes not only core response modules (e.g., JAK2/STAT5, RAS/MEK/ERK), but also specialized effectors (e.g., erythroferrone, ASCT2 glutamine transport, Spi2A). By using phospho-proteomics and a human erythroblastic cell model, we identify 121 new EPO target proteins, together with their EPO-modulated domains and phosphosites. Gene ontology (GO) enrichment for "Molecular Function" identified adaptor proteins as one top EPO target category. This includes a novel EPOR/JAK2-coupled network of actin assemblage modifiers, with adaptors DLG-1, DLG-3, WAS, WASL, and CD2AP as prime components. "Cellular Component" GO analysis further identified 19 new EPO-modulated cytoskeletal targets including the erythroid cytoskeletal targets spectrin A, spectrin B, adducin 2, and glycophorin C. In each, EPO-induced phosphorylation occurred at pY sites and subdomains, which suggests coordinated regulation by EPO of the erythroid cytoskeleton. GO analysis of "Biological Processes" further revealed metabolic regulators as a likewise unexpected EPO target set. Targets included aldolase A, pyruvate dehydrogenase α1, and thioredoxin-interacting protein (TXNIP), with EPO-modulated p-Y sites in each occurring within functional subdomains. In TXNIP, EPO-induced phosphorylation occurred at novel p-T349 and p-S358 sites, and was paralleled by rapid increases in TXNIP levels. In UT7epo-E and primary human stem cell (HSC)-derived erythroid progenitor cells, lentivirus-mediated short hairpin RNA knockdown studies revealed novel pro-erythropoietic roles for TXNIP. Specifically, TXNIP's knockdown sharply inhibited c-KIT expression; compromised EPO dose-dependent erythroblast proliferation and survival; and delayed late-stage erythroblast formation. Overall, new insight is provided into EPO's diverse action mechanisms and TXNIP's contributions to EPO-dependent human erythropoiesis.


Conflict of interest statement

Conflict of interest disclosure The authors declare no competing interests.

Figures

Figure 1.
Figure 1.. Proteomic profiling of EPO/EPOR/JAK2 regulated phospho-PTM targets.
(A-F) Phospho-PTM workflow, and characterization of EPO-dependent human erythroid progenitor UT7epo-E cells. A: In the outlined phospho-PTM proteomic workflow, steps employed to profile EPO-regulated p-Y or p-TPP motif modified target proteins in UT7epo-E cells are defined. B: Analyses of mutations in 18 myeloproliferative driver genes were assessed, with no such mutations detected. C: Profiling of erythroid vs. megakaryocytic marker transcripts in UT7epo-E cells indicated a predominant erythroid phenotype. D: HBA globin levels in UT7epo-E cells (via western blotting) approximate levels in primary basophilic erythroblasts (western blot, right panel). E,F: UT7epo-E cells retain sharp EPO dose- dependency for growth and survival (E), and dynamic cell surface EPOR expression (F) (flow cytometry assays). (G,H) Validation data for known EPO- modulated phospho-PTM targets – G: To illustrate insight generated via this affinity LC-MS/MS approach, PTM-modulated signal transduction factors known to associate with EPO/EPOR/JAK2 complexes are first considered. Data illustrated for ten validation targets include: The fold-modulation of specific phospho-PTMs (“EPO, fold-modulation” column); parent target protein identities (“protein target” column); the use of trypsin (t) or Glu-C (g) to generate peptides (“study” column); EPO-regulated phospho-residues within the parent protein sequence (“site(s)” column); LC-MS/MS defined sequences of the EPO-regulated phospho-peptide (“peptide” column); and identifiers for parent proteins (“protein description” column). H: For comparison, western blot signals for select known EPO- regulated phospho-PTM targets are also shown including p-Y1007/p-Y1008-JAK2, p-Y570-JAK2, p-Y132/p-Y141-RHEX, and p-Y986/p-Y987 INPPL1.
Figure 2.
Figure 2.. Discovery phospho-PTM proteomics identifies 121 novel EPO-regulated targets with diverse molecular functions.
(A) Overall EPO-regulated phospho-PTM targets discovered in UT7epo-E cells via p-Y trypsin, p-Y GluC, and p-TPP GluC proteomic studies: Among 138 unique proteins identified, 121 proved to be novel EPO/EPOR regulated proteins (filled circles) that contain one or more p-Y and/or p-TPP site with ≥2-fold regulation due to EPO. For novel EPO targets, orange lines illustrate their new connections to the EPOR. As defined via STRINGdb, gray lines indicate existing associations among overall targets. Fold-change effects of EPO on phospho-PTM targets are coded by green intensities (induced by EPO), and red intensities (decreased due to EPO). (For p-TPP studies, fold changes are median-adjusted; see Methods). (B) GO enrichment analysis of ‘Molecular Function’ identifies eight principle sets of EPO-regulated phospho-PTM targets: EPO targets analyzed for ‘Molecular Function’ include those discovered in p-TPP(i), p-Y Glu-C (ii), and p-Y trypsin phospho-PTM studies (iii) (see insert key “i, ii, iii”). Target proteins are identified on the left border, and are connected via chords to associated ‘molecular function’ categories (as semantically similar sets of enriched GO terms). Enriched annotations include ‘receptor binding’ (n=15 proteins), ‘kinase activity’ (n=16), non-receptor binding terms (n=30), ‘actin binding’ (n=14), ‘cell adhesion molecule binding’ (n=23), ‘signaling adaptor activity’ (n=10), ‘structural constituent of cytoskeleton’ (n=4) and ‘Ras guanyl-nucleotide exchange factor activity’ (n=11) (also, see Supplemental Table S-5).
Figure 3.
Figure 3.. Analysis of 18 novel EPO- regulated phospho-PTM modified molecular adaptors defines an extended signaling network.
(A) EPO/EPOR/JAK2 molecular adaptor networks: As identified via gene ontology “signaling adaptor activity” assignments (together with NCBI UniProt, Gene Cards, and Phosphosite-Plus® database mining), eighteen novel EPO- and phospho- PTM regulated adaptor proteins were defined (closed circles). For twelve, STRINGdb analysis further established EPOR interactions among DLG1, DLG3, WAS, WASL, CD2AP, SPRY4, HGS, EPS15, FRS2, CTNND1, ERBIN, and EPS15. For C1ORF150/GCSAML, SDCBP, NDFIP1, RAI14, AMOTL1 and WBP2, associations (as presently established) were restricted to the EPOR. (B) Coordinated EPO- and phospho-PTM modulation of actin regulating scaffold proteins DLG1, DLG3, WAS and WASLUpper panels: For the related scaffold proteins DLG-1 and −3, EPO-induced their phosphorylation at aligned novel p-Y760 (DLG-1) and p-Y673 (DLG-3) sites within guanylate kinase domains. Lower panels: WAS and WASL (co-regulators of actin, and DLG interacting proteins) likewise were coordinately regulated by EPO in their aligned p-Y290 (WAS) and p-Y256 (WASL) phosphorylations within central PBD domains. (C) CD2AP as a novel H sapiens EPO- and phospho-PTM regulated signal adaptor: For CD2AP (a direct actin binding scaffold protein), EPO induced its phosphorylation 253.2-fold at a novel p-Y361 site which is conserved in human and primate CD2AP (not shown), but not mouse, rat or lower vertebrates. CD2AP further exhibited connectivity (via PSTPIP1) to WAS, WASL, DLG1, DLG3 within a defined EPOR/JAK2 signaling network (lower subpanel, biochemical evidence; blue connectors). (D) C1ORF150/GSCAML as a novel EPO- regulated signal adaptor (and HGAL orthologue): In C1ORF150, EPO induced the phosphorylation of four C- terminal p-Y sites with singular homology to the B-cell receptor adaptor protein HGAL. (E) During human erythropoiesis, C1ORF150 and CD2AP exhibit stage-selective expression (lower panel) with maximal C1ORF150 expression in BFUe, and maximal CD2AP expression in polychromatic erythroblasts (abbreviations: proerythroblasts, ProE; early erythroblasts, EB; late erythroblasts, LB; polychromatic, poly; orthochromatic, ortho).
Figure 4.
Figure 4.. GO Biological processes implicated for novel EPO-and phospho-PTM modulated target proteins, including DNA repair and energy metabolism factors.
(A) Enrichment analysis for ‘biological process’ terms defines sixteen diverse EPO target sets: Anticipated validating enriched annotations included ‘phosphorylation’, ‘regulation of MAP kinase activity’, ‘response to stimulus’, and ‘signal transduction’. Under ‘signal transduction’, ‘intrinsic apoptotic signaling pathway’ included the anti-apoptotic DNA repair factors ERCC6 and MSH6. Within ‘metabolic process’ category, eight novel EPO- and phospho-PTM regulated targets were ‘generation of precursor metabolites and energy’ annotated proteins, including ALDOA,PDHA1; and SURF1. (B) EPO modulation of MSH6, and ERCC6: For these DNA mismatch repair factors, novel dual sites of EPO regulated p-Y (de)-phosphorylation were within MSH6’s DNA binding region (p-Y977 and p-Y994), and ERCC6’s helicase domain (p-Y882 and p-Y901). (C,D) EPO modulation of core metabolic regulatorsC: EPO-modulated metabolic targets included ALDOLASE A (ALDOA; 4.4-fold EPO-induced p-Y364 phosphorylation, tetramerization domain) and PYRUVATE DEHYDROGENASE A1 (PDHA1; 3.1-fold decreased phosphorylation at Y301, catalytic domain). D: For the cytochrome oxidase C component, SURF1 (upper sub-panel) EPO induced the phosphorylation of clustered sites (p-Y274, p-Y279, and p-Y287) within a hydrophobic C-terminal domain. For THIOREDOXIN INTERACTING PROTEIN (TXNIP), EPO induced phosphorylation was at novel p-T349 and p-S358 sites (lower sub-panel).
Figure 5.
Figure 5.. EPO effects on TXNIP levels, and TXNIP effects on EPOR mediated UT7epo-E erythroid progenitor cell growth and c-KIT expression.
(A) Validation of TXNIP phosphorylation using an EPOR agonist (Hematide), and a TXNIP- p-T349 specific antibody – Upper panel: In phospho-PTM profiling of UT7epo-E cells, Hematide also induced TXNIP’s p-Y phosphorylation at p-T349 and S-358 sites. Lower panel: In EPO challenge experiments in UT7epo-E cells, EPO (+/− EPO, 10 min) induced TXNIP’s phosphorylation at p-T349 as assayed via western blotting. Upon blot pre-treatment with CIAP, this signal was abolished. (B) EPO rapidly increases TXNIP levelsUpper panels: In EPO challenge experiments, exposure of UT7epo-E cells (post EPO withdrawal) for 20 or 60 min rapidly increased TXNIP levels (western blot, total cell lysates). Bar graph data are normalized mean values +/− SE (n=3). Lower panel: Cell fractionation experiments demonstrated cytoplasmic and membrane localization of total and p-T349 TXNIP, with EPO-dependent increases in TXNIP again observed (also see Supplemental Figure S2). (C) Lentivirus mediated shRNA knockdown of TXNIP in UT7epo-E cells: Lentivirus pEF1aGreenPuro template pDNAs (upper panel) were used to generate lentiviruses expressing non-target (NT) or TXNIP transcript targeting shRNAs. In UT7epo-E cells transduced with these lentiviruses at low MOIs (and selected in puromycin), efficient knockdown (“KD”) of TXNIP was confirmed by western blotting. (D) Knockdown of TXNIP inhibits EPO-dependent growth of UT7epo-E cells: UT7epo-E cells stably expressing NT or 150#1 shRNAs were plated at 2x10⁵ cells in 10% FBS, IMDM, P-S and EPO (2U/mL). At the indicated time points, viable cell numbers were determined (mean +/− SE, n=3). Under these assay conditions, no significant effects of TXNIP KD on cell viability were observed (data not shown). (E) G1 to G2 phase progression is attenuated due to TXNIP knockdown: UT7epo-E sh-NT and sh-TXNIP cells were cultured for 20h in the presence of PD-0332991 (0.2 µg/mL), with EPO at 0.5 U/mL to establish G1 phase block. Cells were then washed free of inhibitor, plated in EPO at 2 U/mL and assayed for 2N to 4N advancement (FX Cycle Violet, flow cytometry). Delays in progression to G2 were observed at 4h and 24h (means +/− SE). (F) TXNIP knockdown decreases c-KIT, and increases GPA levels: In UT7epo-E cells, shTXNIP compared to control UT7epo-E sh-NT cells, TXNIP KD effects on KIT and GPA transcripts were assessed by quantitative RT-PCR. Values are means +/− SE (n=3).
Figure 6.
Figure 6.. TXNIP knockdown studies in primary human erythroid progenitor cells define positive roles for TXNIP in EPC growth, survival and development.
(A) TXNIP expression heightens during late stage erythroblast development: Analysis of transcriptome profiles for staged human EPCs from serum-free dexamethasone, and serum/plasma/IMDM cultures define 3− to 10− fold increases in TXNIP levels in late-stage poly- and ortho- chromatic erythroblasts (left and center panels). In developing murine EPCs, this late stage increase in Txnip is not observed (right panel). (B) In primary human EPCs, TXNIP KD sharply decreases c-KIT levels: CD34pos HSCs were pre-expanded (3.5 days; StemSpan, FLT3-L, TPO, IL3, SCF) and transduced with lentiviruses expressing shTXNIP or shNT (non-target shRNA). Lentiviruses were pre-calibrated for matched, ~50% transduction efficiencies (and single integrations). By d4 of erythroid culture in puromycin, ≥95% of cells were GFP positive (see Methods, and Supplemental Figure S-3). Transduced HSCs were cultured in dexamethasone serum-free medium (SFM, SCF/EPO/DEX; upper panels), or in IMDM medium with human serum and plasma (S/P, IL3/SCF/EPO; lower panels). By d7, and in each system, TXNIP KD led to marked decreases in cell surface KIT levels (flow cytometry), with modest increases in GPA also observed. Graphed data are median fluorescence intensities (MFIs) (mean values +/− SE, n=3). Results are representative of two independent experiments (for each culture system). (C) TXNIP supports EPO- dose dependent (pro)erythroblast growth, and survival: shTXNIP and shNT transduced and selected EPCs (S/P, IL3/SCF/EPO medium) were washed and replated at 1.5x10⁵ cells/mL, with EPO at 1.5 U/mL or 0.5 U/mL, and SCF at 15 ng/mL. At the indicated time points, numbers of viable, and non-viable cells were determined (means +/− SE, n=3). shTXNIP KD significantly limited EPC growth, and survival (also, see Supplemental Figure S-4). (D) TXNIP knockdown limits the formation of late stage erythroblasts: EPCs transduced with shTXNIP or shNT lentiviruses were cultured in S/P, IL3/SCF/EPO medium (3 U/mL EPO). At d7 of culture (upper panels), late-stage sh-TXNIP erythroblasts (basophilic, polychromatic, orthochromatic) were observed in replicate cytospin preparations to be 3.3-fold under-represented vs sh-NT EPC controls (mean values +/− SD, n=3). At d10 of culture (lower panels), sh-TXNIP KD decreased numbers of orthochromatic erythroblasts, reticulocytes and terminal erythrocytes while increasing polychromatic erythroblast relative frequencies. (E) TXNIP KD delays erythroblast hemoglobinization: At d7 of culture, visual inspection of cells indicated decreased hemoglobinization of erythroblasts due to TXNIP KD (equal cell numbers collected). Levels of HBB and HBA globin chains, however, were closely matched in d7 shTXNIP and shNT erythroblasts (western blotting, lower panel). (F) TXNIP knockdown sensitizes erythroblasts to peroxide induced cell death: In shTXNIP erythroblasts at d7 of culture (vs control shNT cells), exposure to hydrogen peroxide (800 µM, 4h) resulted in a 4.6-fold increased cell death among TXNIP KD cells (EthD-1 assays). Graphed values are means +/− SD (n=3). As shown in the lower sub-panel, this was not associated with differences in endogenous ROS levels between shTXNIP vs shNT EPCs. (G) Summary model of the observed course of human primary erythroblast development in normal versus TXNIP knockdown conditions: Altered erythroblast formation due to TXNIP knockdown included decreased KIT levels, compromised survival and proliferation, delayed formation of late-stage erythroblasts, and increased ROS sensitivity.
Figure 7.
Figure 7.. Coordinated EPO induced p-Y phosphorylation of networked erythroid cytoskeletal proteins.
(A) Enrichment analysis of GO ‘cellular component’ terms highlights plasma membrane and cytoskeletal-associated EPO-regulated phospho-PTM targets: Chord plots illustrate high representation among enriched Cellular Component’ terms for EPO phospho-PTM targets including ‘plasma membrane’ and „membrane raft’ term targets (n=13), ‘basolateral plasma membrane’ term targets (n=9), ‘cytoplasmic side of membrane’ term targets (n=11) and ‘cytoskeleton’ term targets (n=19). (For overall ‘cellular component’ listings, see Supplemental Table S-6). (B-F) EPO induced phosphorylation of the inter-connected cytoskeletal proteins ALPHA and BETA ERYTHROCYTIC SPECTRIN (SPTA, SPTB), BETA-ADDUCIN (ADD2), and GLYCOPHORIN-C (GYPC) at novel phospho-sites within functional subdomains: B: In erythrocytic SPTA, EPO induced p-Y2332 phosphorylation within a C-terminal calcium binding and EF hand domain, and at SPTB p-Y16 in an N-terminal actin-binding and CH1,2 sub-domain. C: Within ADD2, EPO induced the phosphorylation of p-Y440 within a CALM interacting domain. In GYPC, EPO induced the phosphorylation of p-Y126 (C-terminal cytoplasmic domain). D,E: Within EZRIN (EZR), EPO regulated the phosphorylation of p-Y499 phosphorylation within an actin-interacting ERMAD subdomain. In CALM-1, EPO regulated the phosphorylation of p-Y100 within calcium binding domain III. F: Findings define a network of interacting cytoskeletal factors that are rapidly and coordinately regulated by EPO at unique novel p-Y sites within functionally important subdomains.

Similar articles

Cited by

References

    1. Sathyanarayana P, Dev A, Pradeep A, Ufkin M, Licht JD, Wojchowski DM. Spry1 as a novel regulator of erythropoiesis, EPO/EPOR target, and suppressor of JAK2. Blood. 2012;119(23):5522–5531. - PMC - PubMed
    1. Gautier EF, Ducamp S, Leduc M, et al. Comprehensive Proteomic Analysis of Human Erythropoiesis. Cell Rep 2016;16(5):1470–1484. - PMC - PubMed
    1. Wu H, Liu X, Jaenisch R, Lodish HF. Generation of committed erythroid BFU-E and CFU-E progenitors does not require erythropoietin or the erythropoietin receptor. Cell. 1995;83(1):59–67. - PubMed
    1. Biggar P, Kim GH. Treatment of renal anemia: Erythropoiesis stimulating agents and beyond. Kidney Res Clin Pract 2017;36(3):209–223. - PMC - PubMed
    1. Stauder R, Valent P, Theurl I. Anemia at older age: etiologies, clinical implications, and management. Blood. 2018;131(5):505–514. - PubMed

Publication types