. 2020 Apr 3;12(4):995.
doi: 10.3390/nu12040995.

Sodium Imbalance in Mice Results Primarily in Compensatory Gene Regulatory Responses in Kidney and Colon, but Not in Taste Tissue

Affiliations

Sodium Imbalance in Mice Results Primarily in Compensatory Gene Regulatory Responses in Kidney and Colon, but Not in Taste Tissue

Kristina Lossow et al. Nutrients. .

Abstract

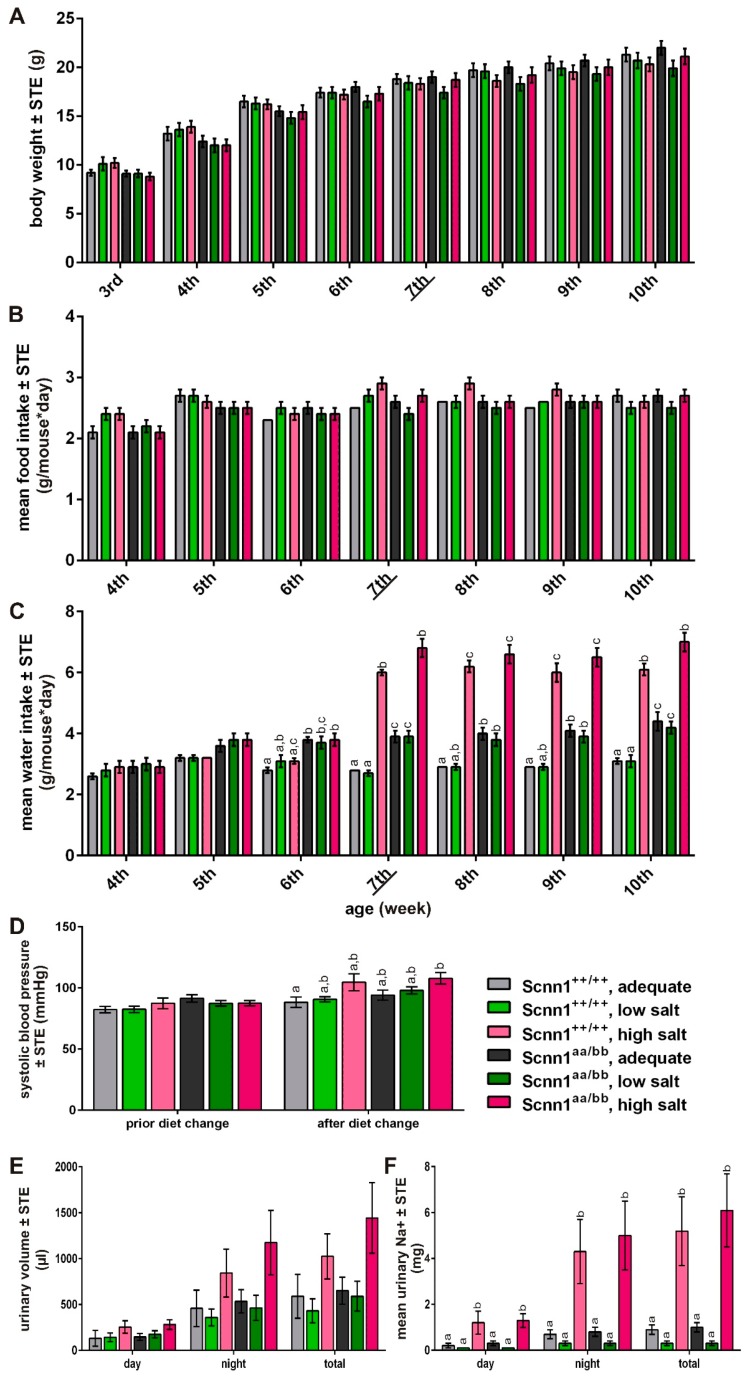
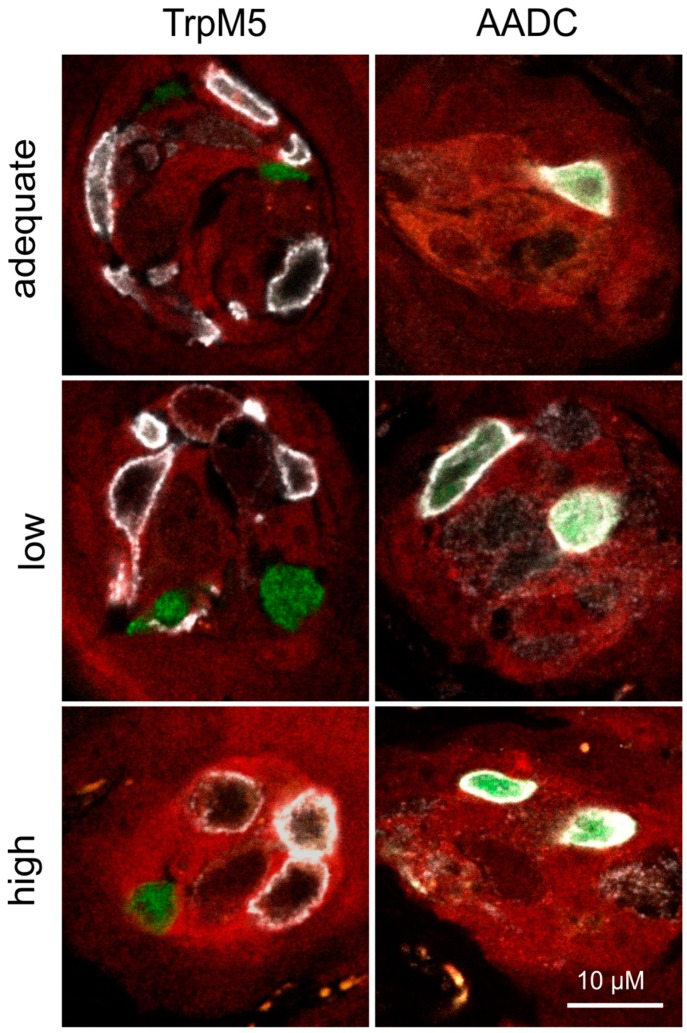
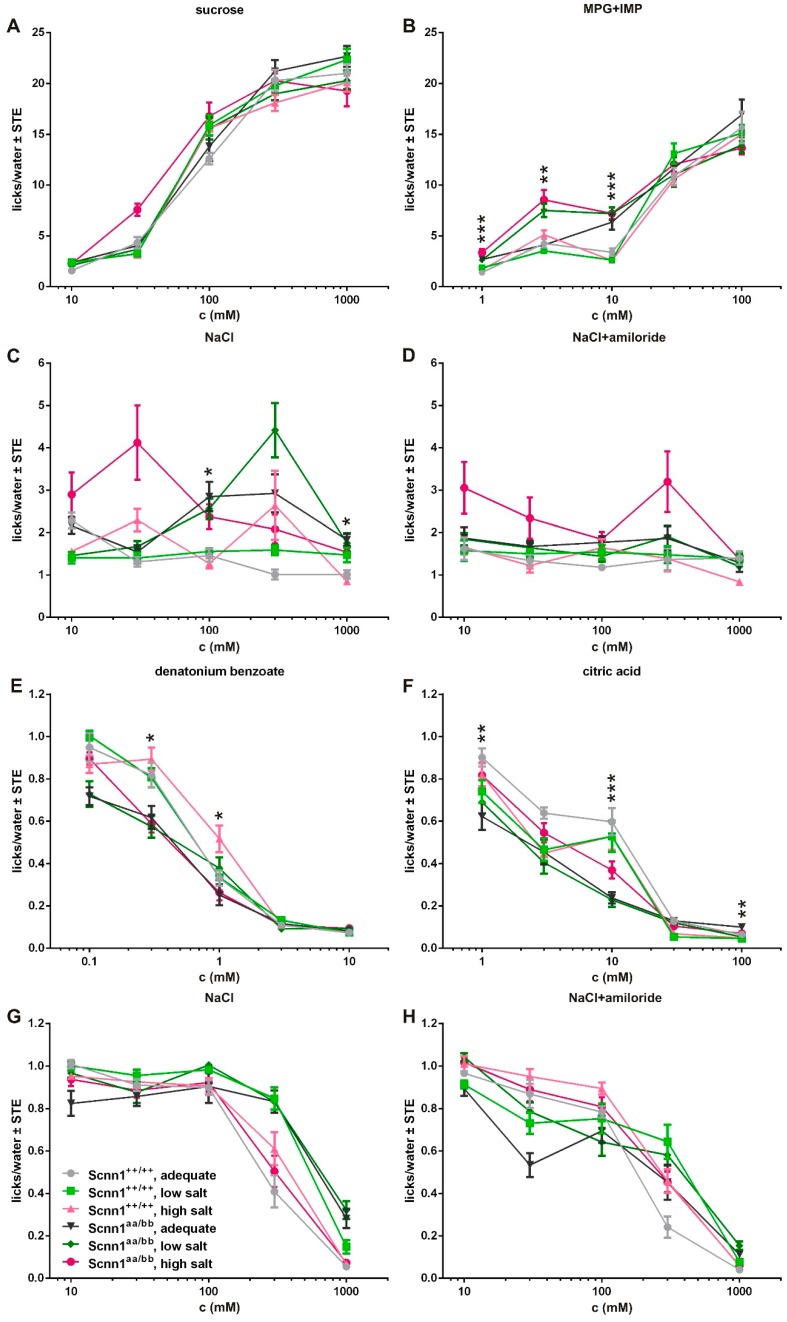
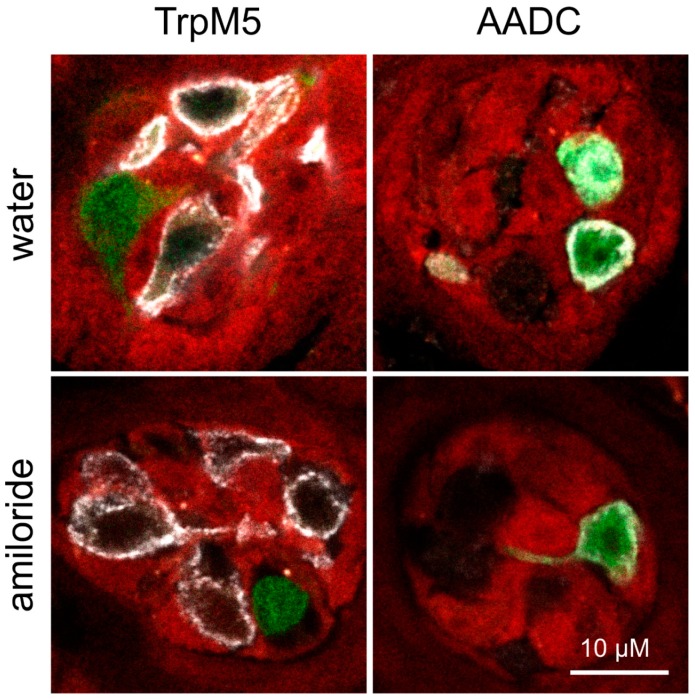
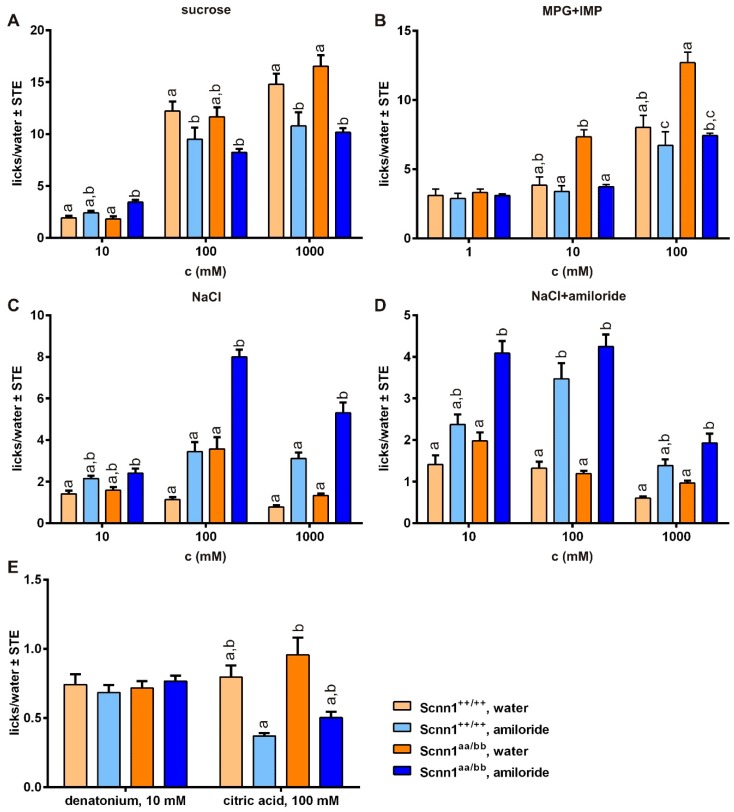
Renal excretion and sodium appetite provide the basis for sodium homeostasis. In both the kidney and tongue, the epithelial sodium channel (ENaC) is involved in sodium uptake and sensing. The diuretic drug amiloride is known to block ENaC, producing a mild natriuresis. However, amiloride is further reported to induce salt appetite in rodents after prolonged exposure as well as bitter taste impressions in humans. To examine how dietary sodium content and amiloride impact on sodium appetite, mice were subjected to dietary salt and amiloride intervention and subsequently analyzed for ENaC expression and taste reactivity. We observed substantial changes of ENaC expression in the colon and kidney confirming the role of these tissues for sodium homeostasis, whereas effects on lingual ENaC expression and taste preferences were negligible. In comparison, prolonged exposure to amiloride-containing drinking water affected β- and αENaC expression in fungiform and posterior taste papillae, respectively, next to changes in salt taste. However, amiloride did not only change salt taste sensation but also perception of sucrose, glutamate, and citric acid, which might be explained by the fact that amiloride itself activates bitter taste receptors in mice. Accordingly, exposure to amiloride generally affects taste impression and should be evaluated with care.

Keywords: amiloride; epithelial sodium channel; salt deprivation; short-term preference test; sodium homeostasis.


Conflict of interest statement

The authors declare no conflicts of interest.

Figures

Figure 1
Figure 1
Physiological parameters of Scnn1++/++ and Scnn1aa/bb mice during dietary monitoring. (A) Body weight, (B) food and (C) water intake, (D) blood pressure, (E) urinary volume, and (F) sodium excretion of Scnn1++/++ (n = 11) and Scnn1aa/bb mice (n = 19–20) fed with low salt, adequate, and high salt diet over a period of 4 weeks (7th to 10th week, time point of diet change is indicated by underline); after initial 3 weeks of sodium adequate chow diet (4th to 6th week) after weening (3rd week). Statistical differences between 2 bars at a specific time point are indicated by different letters based on UNIANOVA and post-hoc analysis using Bonferroni´s multiple comparison test.
Figure 2
Figure 2
Expression of fluorescent proteins in fungiform papillae after dietary intervention. Fungiform papillae sections of Scnn1aa/bb animals expressing GFP (synthesis of green) and tdRFP (synthesis of red) fluorescence in αENaC- and βENaC-expressing cells, respectively, were stained for Type II (TrpM5) and Type III (AADC) taste cell markers after dietary intervention. Therefore, animals received either an adequate, low, or high salt diet over a period of 4 weeks. Independently of the consumed diet, GFP and tdRFP fluorescence showed no co-localization in taste papillae. Whereas GFP-positive cells always co-expressed AADC, tdRFP-positive cells revealed no overlap with the cell markers TrpM5 or AADC, visualized by immunofluorescence (white). Scale bars apply to all images.
Figure 3
Figure 3
Taste response curves of Scnn1++/++ and Scnn1aa/bb mice after dietary intervention. After 4 weeks fed with sodium-adequate, low, or high salt diet, Scnn1++/++ and Scnn1aa/bb mice were subjected to short-term preference tests using an automated gustometer. To do so, animals were either restricted for 22.5 h with access to 2.0 mL water and 1 g food (attractive restriction conditions, (AD)) or water-deprived for 22.5 h (aversive restriction conditions, (EH)). Taste solutions and concentrations were presented randomly. Each data point represents a mean ± standard error (SE) of 5 s presentations from the 10 to 11 animals tested. Statistical testing was based on UNIANOVA and post-hoc analysis using Bonferroni´s multiple comparison test. Significant differences over all groups in line drawings were indicated by asterisk(s) with * p < 0.05, ** p < 0.01, and *** p < 0.001.
Figure 4
Figure 4
Expression of fluorescent proteins in taste papillae after amiloride intervention. Fungiform papillae sections of Scnn1aa/bb animals expressing GFP (green) and tdRFP (red) fluorescence in αENaC- and βENaC-expressing cells, respectively, were stained for Type II (TrpM5) and Type III (AADC) taste cell markers after amiloride intervention. Therefore, animals received adequate salt diet without or with 300 µM amiloride-containing drinking water prior to sacrifice. Independent of intervention, GFP and tdRFP fluorescence showed no co-localization in taste papillae. Whereas GFP-positive cells always co-expressed AADC, tdRFP-positive cells revealed no overlap with the cell markers TrpM5 or AADC, visualized by immunofluorescence (white). Scale bar applies to all images.
Figure 5
Figure 5
Taste responses of Scnn1++/++ and Scnn1aa/bb mice after access to amiloride-containing water. Scnn1++/++ and Scnn1aa/bb mice receiving a sodium-adequate diet had either access to 300 µM amiloride-containing water 13 h prior to restriction starting or received water without amiloride. The restriction phase lasted for 22.5 h with access to 2.0 mL water ± 300 µM amiloride and 1 g of food. Lick responses to different concentrated solutions of sucrose (A), monopotassium glutamate with inosine 5´monophosphate (MPG+IMP; B), sodium chloride (NaCl; C), NaCl with amiloride (NaCl+amiloride; D), or bitter and sour stimuli (E) were determined by an automated gustometer. Each data point represents a mean ± SE of 5 s presentations from 10 to 16 animals tested. Statistical was testing based on UNIANOVA and post-hoc analysis using Bonferroni´s multiple comparison test. Different letters indicate statistical significance.
Figure 6
Figure 6
Concentration-response relations of murine (A) and human (B) bitter taste receptor-expressing cells stimulated with increasing concentrations of amiloride calculated from calcium traces acquired by fluorometric imaging plate reader (FLIPR) recordings. Changes in fluorescence (ΔF/F) were plotted semi-logarithmically versus agonist concentrations.

References

    1. Hollenberg N.K. Surfeit, deficit, and the set point for sodium homeostasis. Kidney Int. 1982;21:883–884. doi: 10.1038/ki.1982.114. - DOI - PubMed
    1. Damkjaer M., Jensen P.H., Schwammle V., Sprenger R.R., Jacobsen I.A., Jensen O.N., Bie P. Selective renal vasoconstriction, exaggerated natriuresis and excretion rates of exosomic proteins in essential hypertension. Acta Physiol. (Oxf.) 2014;212:106–118. doi: 10.1111/apha.12345. - DOI - PubMed
    1. Healy V., Thompson C., Johns E.J. The adrenergic regulation of proximal tubular Na(+)/H(+) exchanger 3 in the rat. Acta Physiol. (Oxf.) 2014;210:678–689. doi: 10.1111/apha.12181. - DOI - PubMed
    1. Fujita T. Aldosterone in salt-sensitive hypertension and metabolic syndrome. J. Mol. Med. (Berl.) 2008;86:729–734. doi: 10.1007/s00109-008-0343-1. - DOI - PubMed
    1. Loffing J., Pietri L., Aregger F., Bloch-Faure M., Ziegler U., Meneton P., Rossier B.C., Kaissling B. Differential subcellular localization of ENaC subunits in mouse kidney in response to high- and low-Na diets. Am. J. Physiol. Ren. Physiol. 2000;279:F252–258. doi: 10.1152/ajprenal.2000.279.2.F252. - DOI - PubMed

MeSH terms

LinkOut - more resources