

Application of A Precision Apiculture System to Monitor Honey Daily Production
- PMID: 32260116
- PMCID: PMC7181046
- DOI: 10.3390/s20072012
Application of A Precision Apiculture System to Monitor Honey Daily Production
Abstract
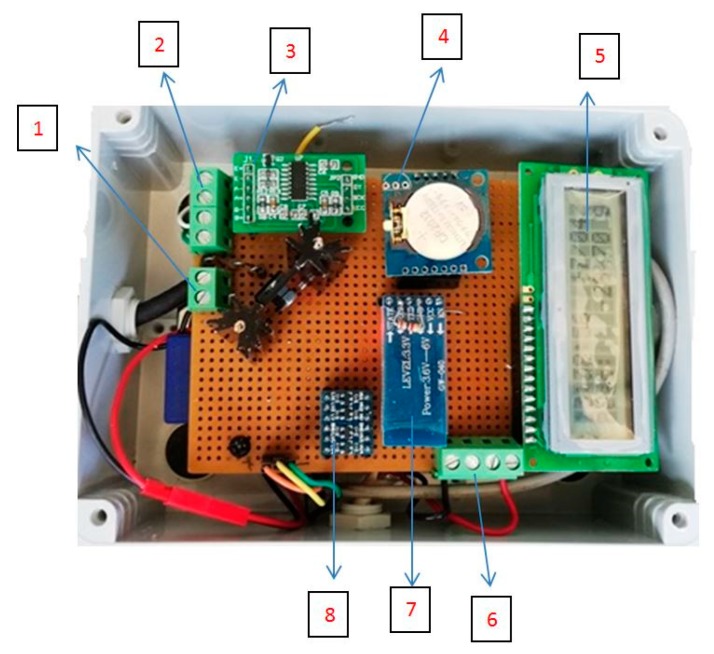
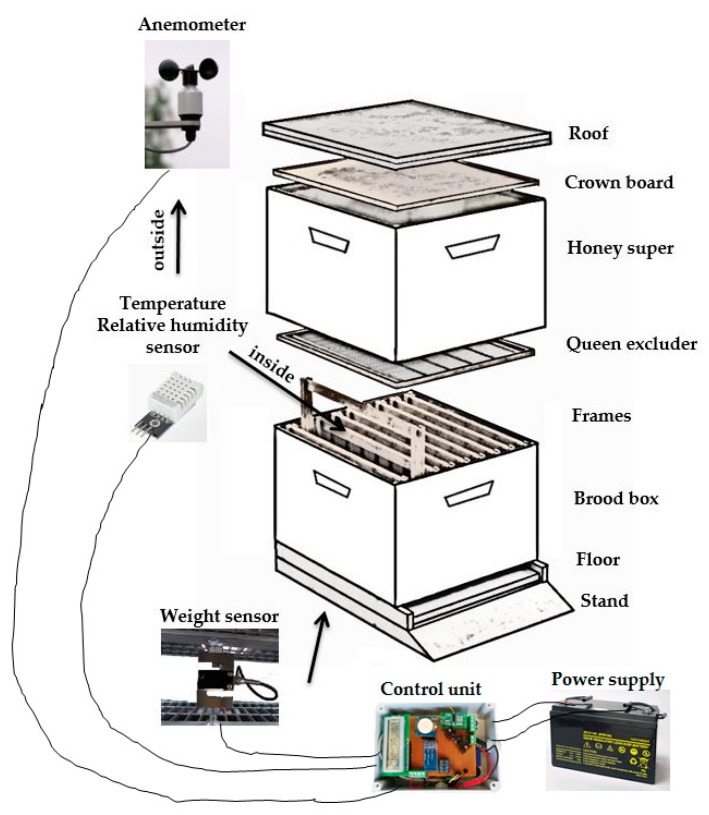
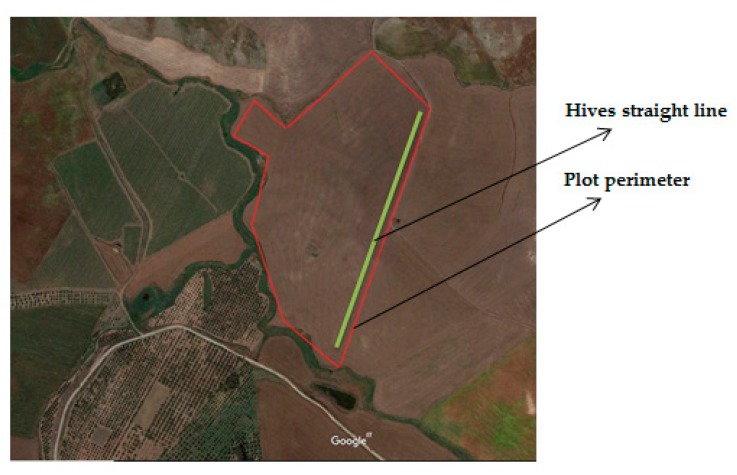
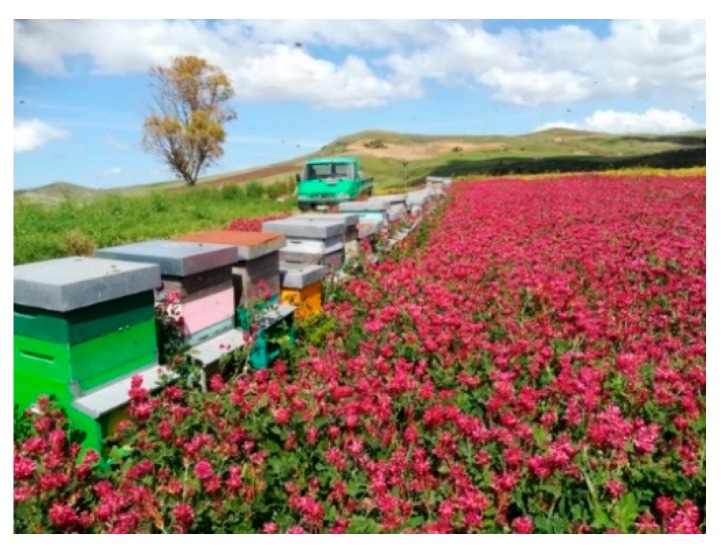
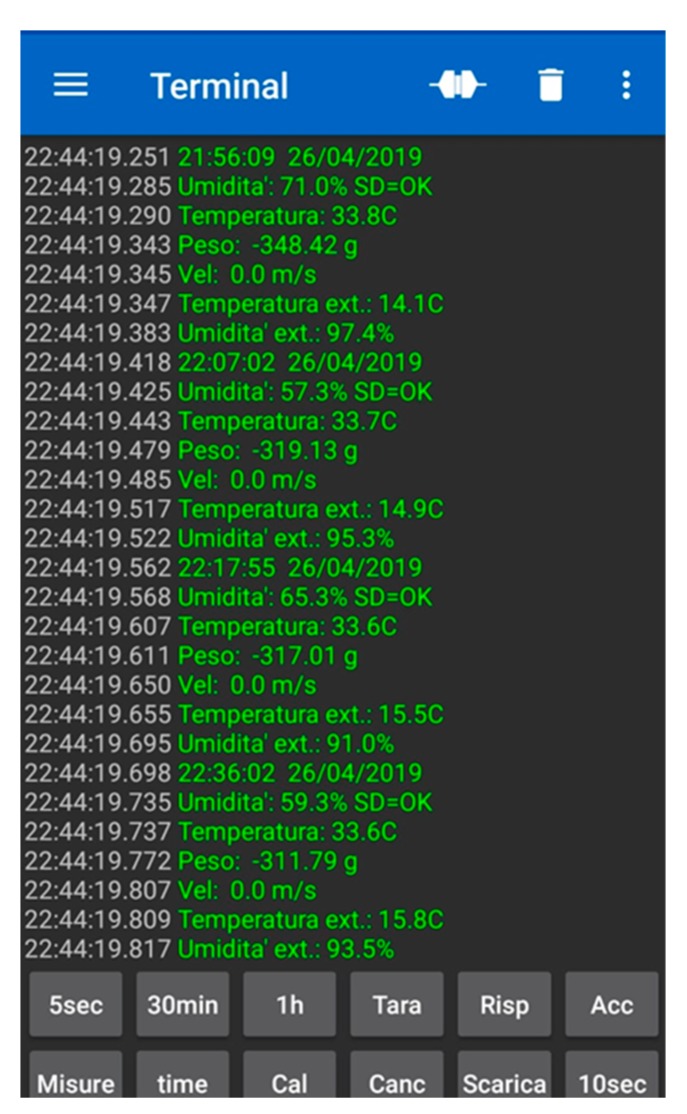
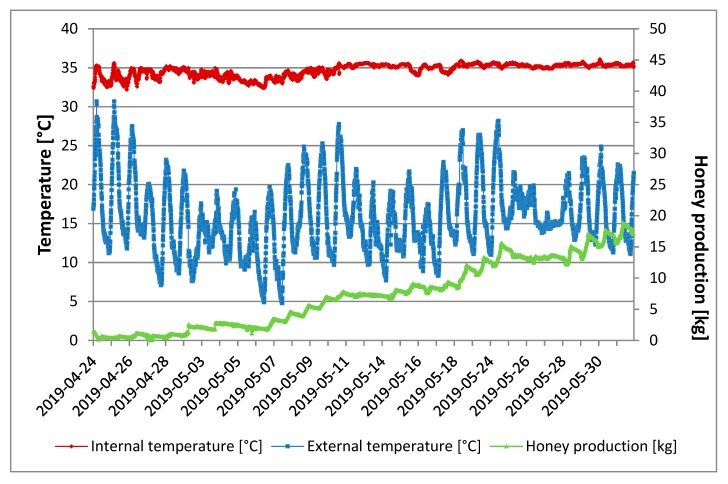
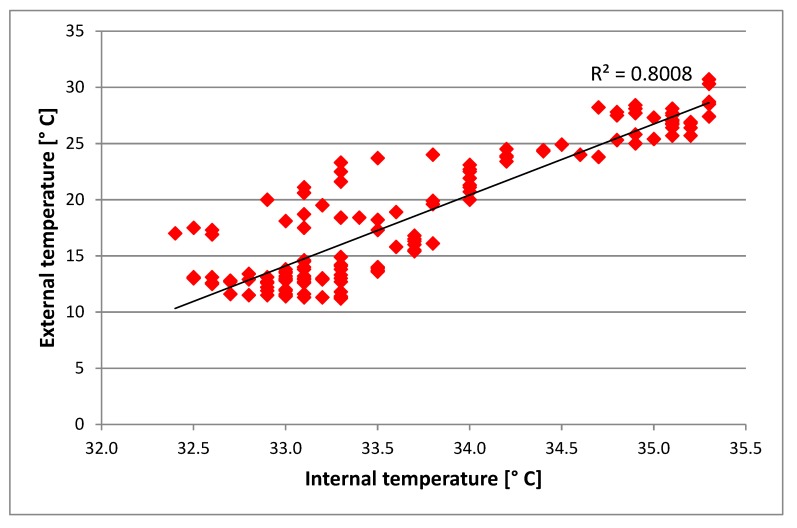
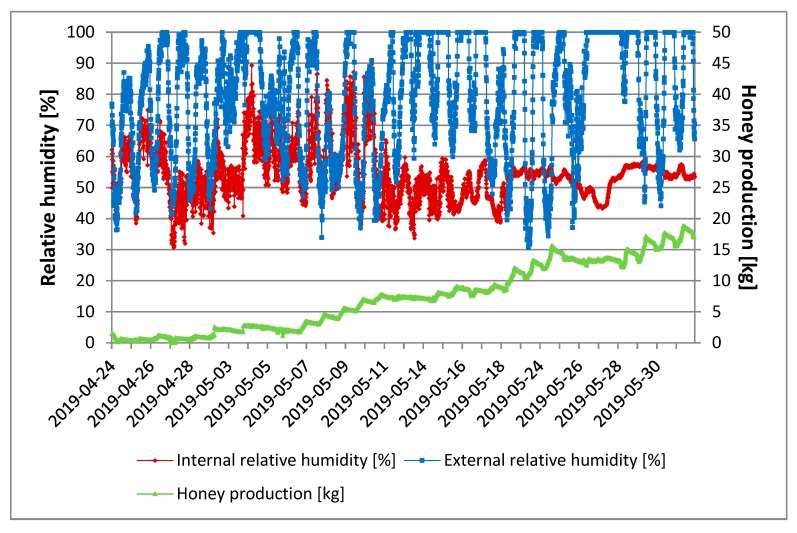
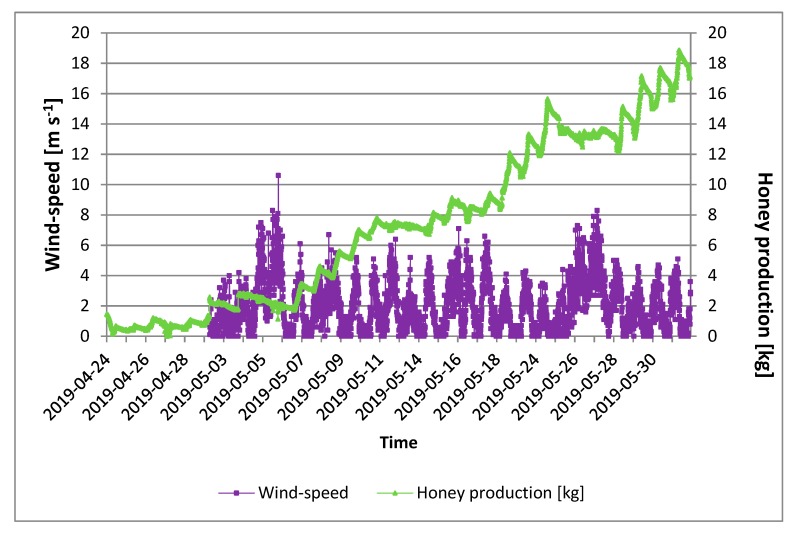
Precision beekeeping or precision apiculture is an apiary management strategy based on the monitoring of individual bee colonies to minimize resource consumption and maximize the productivity of bees. Bees play a fundamental role in ensuring pollination; they can also be considered as indicators of the state of pollution and are used as bio monitors. Beekeeping needs continuous monitoring of the animals and can benefit from advanced intelligent ambiance technologies. The aim of this study was the design of a precision apiculture system (PAS) platform for monitoring and controlling the following environmental parameters: wind, temperature, and relative humidity inside and outside the hive, in order to assess their influence on honey production. PAS is based on an Arduino board with an Atmel microcontroller, and the connection of a load cell for recording the weight of the hive, relative humidity and temperature sensor inside the hive, and relative humidity and temperature sensor outside the hive using an anemometer. PAS was installed in common hives and placed in an open field in a French honeysuckle plot; the system was developed to operate in continuous mode, monitoring the period of 24 April-1 June 2019. Temperature was constant in the monitored period, around 35 °C, inside the hive, proving that no criticalities occurred regarding swarming or absconding. In the period between 24 and 28 May, a lack of honey production was recorded, attributed to a lowering of the external temperature. PAS was useful to point out the eventual reduction in honey production due to wind; several peaks of windiness exceeding 5 m s-1 were recorded, noting that honey production decreases with the peaks in wind. Therefore, the data recorded by PAS platform provided a valid decisional support to the operator. It can be implemented by inserting additional sensors for detecting other parameters, such as rain or sound.
Keywords: arduino; beekeeping; environment; hive; honey; precision agriculture; wind.
Conflict of interest statement
The authors declare no conflicts of interest.
Figures
References
-
- Tzounis A., Katsoulas N., Bartzanas T., Kittas C. Internet of Things in agriculture, recent advances and future challenges. Biosyst. Eng. 2017;164:31–48. doi: 10.1016/j.biosystemseng.2017.09.007. - DOI
-
- Zacepins A., Stalidzans E., Meitalovs J. Application of Information Technologies in Precision Apiculture; Proceedings of the 13th International Conference on Precision Agriculture (ICPA 2012); Indianapolis, IN, USA. 15−18 July 2012.
-
- Davodpour R., Sobhanardakani S., Cheraghi M., Abdi N., Lorestani B. Honeybees (Apis mellifera L.) as a potential bioindicator for detection of toxic and essential elements in the environment (case study: Markazi province, Iran) Arch. Environ. Contam. Toxicol. 2019;77:344–358. doi: 10.1007/s00244-019-00634-9. - DOI - PubMed
-
- Catania P., Inglese P., Pipitone F., Vallone M. Assessment of the wind influence on spray application using an artificial vineyard. Eur. J. Hortic. Sci. 2011;76:102–108.
MeSH terms
LinkOut - more resources
Full Text Sources
Miscellaneous
