. 2020 Apr 4;20(7):2026.
doi: 10.3390/s20072026.

Wireless Sensors System for Stress Detection by Means of ECG and EDA Acquisition

Affiliations

Wireless Sensors System for Stress Detection by Means of ECG and EDA Acquisition

Antonio Affanni. Sensors (Basel). .

Abstract

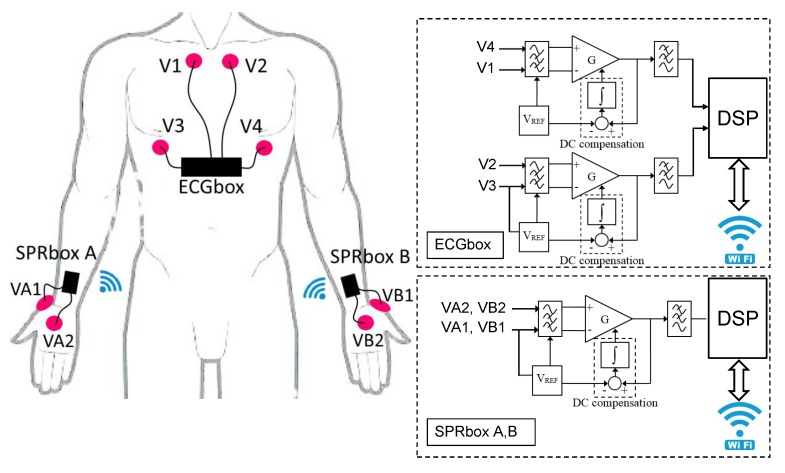
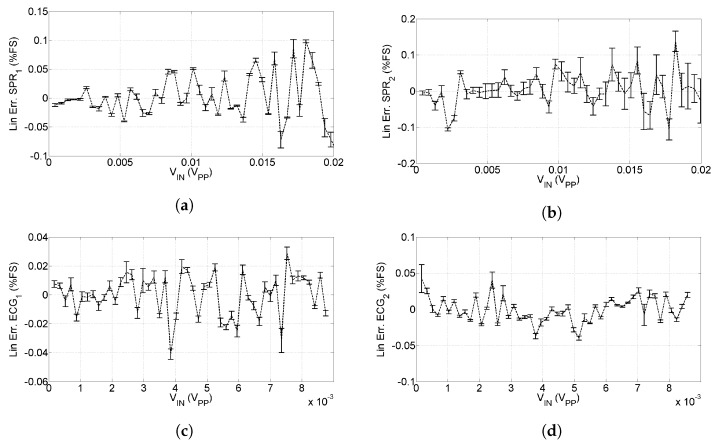
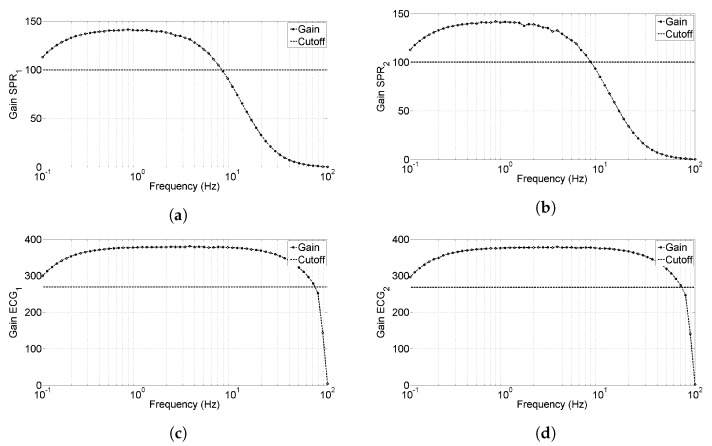
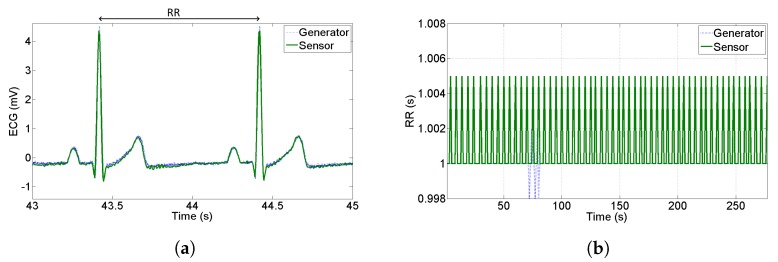
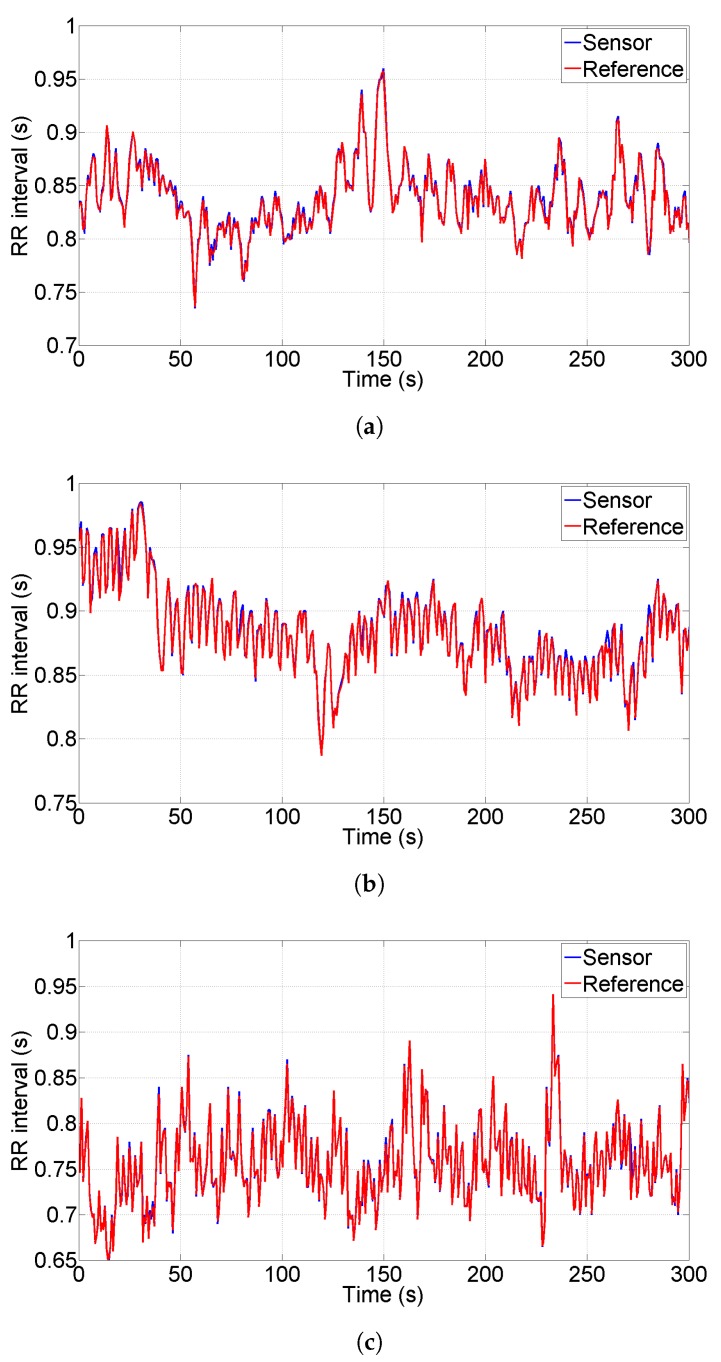
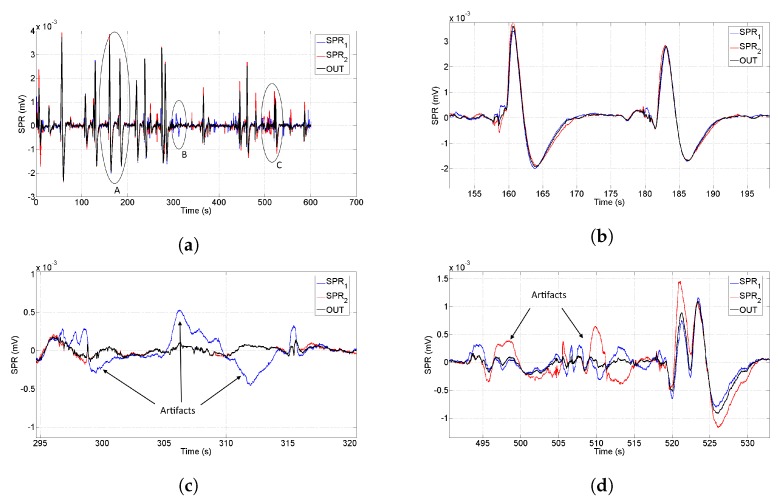
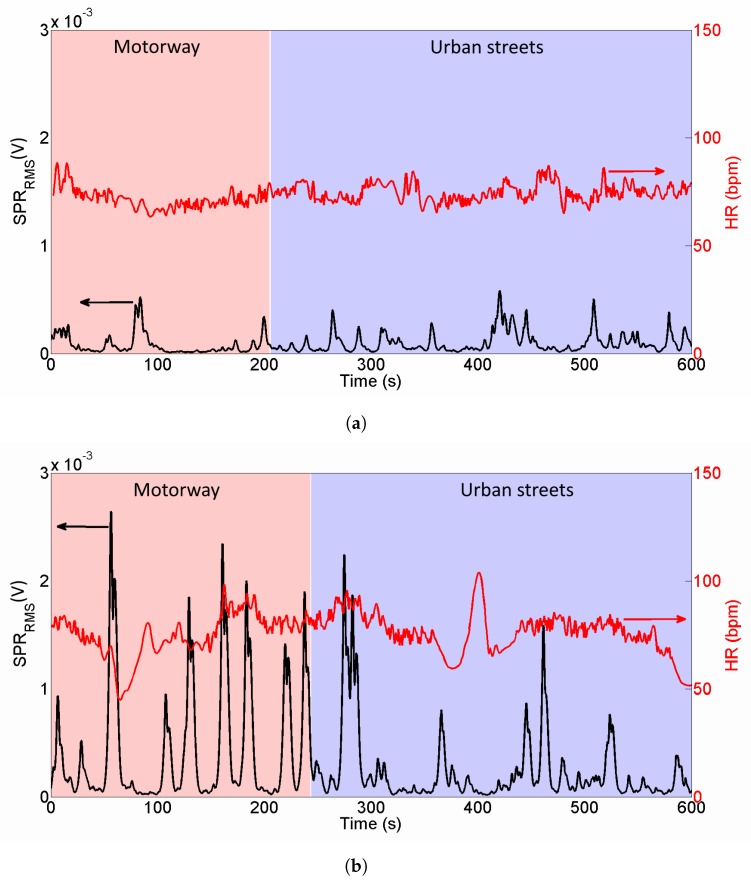
This paper describes the design of a two channels electrodermal activity (EDA) sensor and two channels electrocardiogram (ECG) sensor. The EDA sensors acquire data on the hands and transmit them to the ECG sensor with wireless WiFi communication for increased wearability. The sensors system acquires two EDA channels to improve the removal of motion artifacts that take place if EDA is measured on individuals who need to move their hands in their activities. The ECG channels are acquired on the chest and the ECG sensor is responsible for aligning the two ECG traces with the received packets from EDA sensors; the ECG sensor sends via WiFi the aligned packets to a laptop for real time plot and data storage. The metrological characterization showed high-level performances in terms of linearity and jitter; the delays introduced by the wireless transmission from EDA to ECG sensor have been proved to be negligible for the present application.

Keywords: ECG sensor; driving simulators; electrodermal activity; stress measurement.


Conflict of interest statement

The author declares no conflict of interest.

Figures

Figure 1
Figure 1
(Left) scheme of sensors and electrodes positioning—the skin potential response (SPR) boxes A and B acquire electrodermal activity (EDA) signals on the hands and transmit the data to the electrocardiogram (ECG) box; the ECG box acquires signals on the chest and sends data to a laptop. (Right) block diagram of SPR boxes and ECG box.
Figure 2
Figure 2
(a) Enclosures of SPR boxes and ECG box, and (b) Printed Circuit Boards of the developed sensors.
Figure 3
Figure 3
(a) Packets generation for transmission from SPR boxes to ECG box, and (b) packets alignment and reconstruction performed by the ECG box.
Figure 4
Figure 4
Control panel developed in .NET environment for data acquisition and real time plot; upper traces show SPR channels, bottom traces show ECG channels.
Figure 5
Figure 5
Linearity of the developed sensors, error bars represent the uncertainty on linearity. (a) Linearity for SPR1 signal, (b) Linearity for SPR2 signal, (c) Linearity for ECG1 signal, and (d) Linearity for ECG2 signal.
Figure 6
Figure 6
Bandwidth characterization for the developed sensors, horizontal line represents the cut-off limit. (a) Bandwidth for SPR1 signal, (b) bandwidth for SPR2 signal, (c) bandwidth for ECG1 signal, and (d) bandwidth for ECG2 signal.
Figure 7
Figure 7
(a) Comparison between the synthesized peaks acquired from the oscilloscope and the proposed sensor, and (b) tachogram extraction to evaluate the jitter introduced by the sensor.
Figure 8
Figure 8
Comparison of Tachograms extracted acquiring data with the proposed sensor and with a reference one on three different individuals (ac): blue lines represent the proposed sensor, red lines represent the reference one.
Figure 9
Figure 9
The driving simulator available in our laboratory at the University of Udine.
Figure 10
Figure 10
City map of the driving experiments; red line represents the motorway, blue line represents urban streets and checkered flag represents the start and the stop of experiments.
Figure 11
Figure 11
(a) Acquired SPR signals (blue line SPR1 on right hand, red line SPR2 on left hand) and output of the algorithm for motion artifact removal (black line) during a driving session; circles A, B and C represent some significant portions zoomed in the next sub-figures. (b) Zoom of the signals in the circle A; when hands are still, the three traces are identical and SPR pulses look with smooth shape. (c) Zoom of the signals in the circle B; it is evident a motion artifact in right hand, but the output is not affected remaining close to zero. (d) Zoom of the signals in the circle C; motion artifacts are evident in both hands in t ∈ [495, 515] s, but the output is not affected; at t = 520 s instead, an SPR pulse is properly recognized.
Figure 12
Figure 12
Acquired traces from a subject driving without traffic (a), and with aggressive traffic (b). Black line (left axis) represents SPRRMS signal, red line (right axis) represents HR signal. It is evident that SPR peaks are by far higher during traffic test and HR shows a higher variability.

References

    1. Akbar F., Mark G., Pavlidis I., Gutierrez-Osuna R. An Empirical Study Comparing Unobtrusive Physiological Sensors for Stress Detection in Computer Work. Sensors. 2019;19:3766. doi: 10.3390/s19173766. - DOI - PMC - PubMed
    1. Porter A.M., Goolkasian P. Video Games and Stress: How Stress Appraisals and Game Content Affect Cardiovascular and Emotion Outcomes. Front. Psychol. 2019;10:967. doi: 10.3389/fpsyg.2019.00967. - DOI - PMC - PubMed
    1. Nguyen T.H., Chung W.Y. Detection of Driver Braking Intention Using EEG Signals during Simulated Driving. Sensors. 2019;19:2863. doi: 10.3390/s19132863. - DOI - PMC - PubMed
    1. Koh D.W., Lee S.G. An Evaluation Method of Safe Driving for Senior Adults Using ECG Signals. Sensors. 2019;19:2828. doi: 10.3390/s19122828. - DOI - PMC - PubMed
    1. Li Y., Wang F., Ke H., Wang L., Xu C. A Driver’s Physiology Sensor-Based Driving Risk Prediction Method for Lane-Changing Process Using Hidden Markov Model. Sensors. 2019;19:2670. doi: 10.3390/s19122670. - DOI - PMC - PubMed

LinkOut - more resources