. 2020 Apr 7;20(1):291.
doi: 10.1186/s12885-020-06785-6.

Comprehensive routine diagnostic screening to identify predictive mutations, gene amplifications, and microsatellite instability in FFPE tumor material

Affiliations

Comprehensive routine diagnostic screening to identify predictive mutations, gene amplifications, and microsatellite instability in FFPE tumor material

Elisabeth M P Steeghs et al. BMC Cancer. .

Abstract

Background: Sensitive and reliable molecular diagnostics is needed to guide therapeutic decisions for cancer patients. Although less material becomes available for testing, genetic markers are rapidly expanding. Simultaneous detection of predictive markers, including mutations, gene amplifications and MSI, will save valuable material, time and costs.

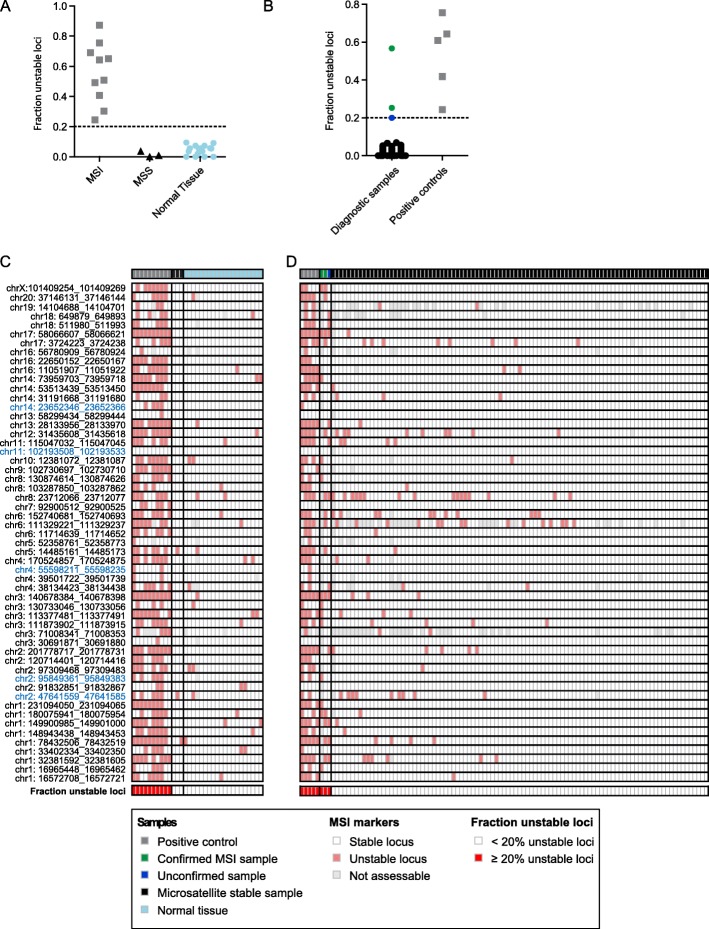
Methods: Using a single-molecule molecular inversion probe (smMIP)-based targeted next-generation sequencing (NGS) approach, we developed an NGS panel allowing detection of predictive mutations in 33 genes, gene amplifications of 13 genes and microsatellite instability (MSI) by the evaluation of 55 microsatellite markers. The panel was designed to target all clinically relevant single and multiple nucleotide mutations in routinely available lung cancer, colorectal cancer, melanoma, and gastro-intestinal stromal tumor samples, but is useful for a broader set of tumor types.

Results: The smMIP-based NGS panel was successfully validated and cut-off values were established for reliable gene amplification analysis (i.e. relative coverage ≥3) and MSI detection (≥30% unstable loci). After validation, 728 routine diagnostic tumor samples including a broad range of tumor types were sequenced with sufficient sensitivity (2.4% drop-out), including samples with low DNA input (< 10 ng; 88% successful), low tumor purity (5-10%; 77% successful), and cytological material (90% successful). 75% of these tumor samples showed ≥1 (likely) pathogenic mutation, including targetable mutations (e.g. EGFR, BRAF, MET, ERBB2, KIT, PDGFRA). Amplifications were observed in 5.5% of the samples, comprising clinically relevant amplifications (e.g. MET, ERBB2, FGFR1). 1.5% of the tumor samples were classified as MSI-high, including both MSI-prone and non-MSI-prone tumors.

Conclusions: We developed a comprehensive workflow for predictive analysis of diagnostic tumor samples. The smMIP-based NGS analysis was shown suitable for limited amounts of histological and cytological material. As smMIP technology allows easy adaptation of panels, this approach can comply with the rapidly expanding molecular markers.

Keywords: Colorectal carcinoma; FFPE; GIST; Gene amplification; Lung cancer; Melanoma; Microsatellite instability; Mutation; Next-generation sequencing; Predictive analysis.


Conflict of interest statement

The authors declare that they have no conflict of interest.

BBJT is a member of the BMC Cancer editorial board, but has not played any role in editorial decisions made regarding this manuscript. Outside the submitted work MJLL has relations with AstraZeneca, Bayer, Bristol-Myers Squibb, Illumina, Janssen pharmaceuticals, Merck, and Nimagen; outside the submitted work LCvK has relations with Janssen pharmaceuticals, Bristol-Myers Squib, Merck, nanoString, and is an advisor for Guidepoint; outside the submitted work ES has relations with AstraZeneca, Roche, Pfizer, Novartis, Bayer, BMS, BioCartis, Illumina, Agena Bioscience, CC Diagnostics, Janssen Cilag (Johnson&Johnson), Diaceutics, Bio-Rad, Abbott, Boehringer Ingelheim, Promega.

Figures

Fig. 1
Fig. 1
Validation of sequencing analysis. a Average read depth of 96.3% of the targets is within one order of magnitude. For every region (hotspot or whole exon) the mean coverage was calculated per sample. By dividing the mean coverage per region through the median coverage in a specific sample, the mean relative coverage for each region was defined. The average of the mean relative coverage per region of 10 samples is plotted. b 57 samples distributed over the indications lung, colon, melanoma, GIST, and miscellaneous (analysis in the context of evaluating clinical trial options) were sequenced and compared with the current routine diagnostics panel. c Percentage of samples with a specific number of mutations. d The variant allele frequencies (VAF) of the 32 mutations identified by both the PATH panel and the cancer hotspot panel. e Mutations detected in the 52 samples successfully sequenced during the validation phase. Dark red indicates mutations identified with both panels (cancer hotspot panel and PATH panel). Light red indicates additional mutations identified using the PATH panel. ‘2’ indicates two different mutations identified in the same gene. Dark and light purple indicates variants of unknown significance (VUS) identified by both panels or PATH panel only, respectively
Fig. 2
Fig. 2
Validation of detection of amplifications in smMIP-based NGS analysis on gDNA from clinical FFPE specimens. a Relative coverage and z-scores in 5 positive controls for EGFR, MET and ERBB2 (n = 3: high, medium, and low level amplification) normalized to a normal tissue control series. Values of all 13 genes relevant for amplification detection (see Supplementary Table 1) are plotted for the five samples. Values were calculated per gene per sample and sorted by increasing value. The positive control values (one gene per samples) are depicted in green, values for all other genes (12 per samples) are shown in black. The additional detected EGFR amplification, shown in orange, was confirmed by FISH. b Grouped relative coverage in a series of 46 clinical tissue samples and 15 normal tissue controls. Values were calculated per gene per sample. c Relative coverage per gene in the series of 46 clinical samples, with additional clinical/molecular information (details in main text). The cut-off for validation (relative coverage ≥3.0) is shown by an orange line. Potential amplifications in green were validated by OncoScan array analysis (the others were not analyzed by OncoScan array). d Three positive control samples were diluted in gDNA isolated from normal tissue. Relative coverage (y-axis) and z-scores (above bars) compared with a normal tissue control series are shown. On the x-axis the dilution based on gDNA concentration is shown. EGFR positive control: unknown tumor purity. ERBB2 high positive control: 70% tumor cells. ERBB2 low positive control: 50% tumor cells
Fig. 3
Fig. 3
Validation of MSI detection in smMIP-based NGS analysis on gDNA from clinical FFPE specimens. a The fraction of microsatellite loci that showed an MSI event is depicted for MSI tumor samples, MSS tumor samples, and normal tissue samples. b The fraction of microsatellite loci that showed an MSI event is depicted for 100 diagnostic samples and 5 positive control samples. c Landscape of MSI events in the different microsatellite loci of the samples that are shown in panel A. Each column represent a tumor sample. Each row represents a microsatellite locus. Colored (red) bars represent unstable loci, white bars represent microsatellite stable loci, and grey bars represent microsatellite loci which could not be analyzed due to poor quality. The top row shows which sample is depicted: positive control (grey), microsatellite stable tumor sample (black), or a normal tissue sample (light blue). The bottoms row indicates whether the fraction of unstable loci exceeds 20% (red) or is below 20% (white). On the left of the figure the location of the microsatellite loci is depicted. Loci that are shown in blue represent the pentaplex PCR markers. d Landscape of MSI events in the different microsatellite loci of the samples that are shown in panel B. Each column represent a tumor sample. Each row represents a microsatellite locus. Colored (red) bars represent unstable loci, white bars represent stable loci, and a grey bar means that the locus could not be analyzed. The top row shows which sample is depicted: positive control (grey), an MSI sample that is confirmed by another technique (green), a potential MSI sample that could not be confirmed by another technique (blue), or microsatellite stable diagnostic sample (black). The bottoms row indicates whether the fraction of unstable loci exceeds 20% (red) or is below 20% (white)
Fig. 4
Fig. 4
Mutational landscape of 729 tumor samples, which were analyzed with the PATH panel in routine diagnostics. (Likely) pathogenic mutations, variants of unknown significance, amplifications, and MSI status are depicted in the figure. Tumor samples are sorted on genetic alterations, followed by tumor type, and MSI status. Each column represents a tumor sample. Each row represents a genetic alterations (i.e. mutation (light red, red, or dark red), CNV (cyan), or MSI (light red). A colored bar represents a genetic alterations, a white bar represents no alteration, and a grey bar represents not analyzed. The top row shows the tumor types of the analyzed samples: lung cancer (dark blue), colorectal cancer (light blue), melanoma (dark green), GIST (light green), or miscellaneous (black)

References

    1. Herbst RS, Morgensztern D, Boshoff C. The biology and management of non-small cell lung cancer. Nature. 2018;553(7689):446–454. doi: 10.1038/nature25183. - DOI - PubMed
    1. Weathers SPS, Gilbert MR. Toward personalized targeted therapeutics: An overview. Neurotherapeutics. 2017;14(2):256–264. doi: 10.1007/s13311-016-0496-5. - DOI - PMC - PubMed
    1. Jennings LJ, Arcila ME, Corless C, Kamel-Reid S, Lubin IM, Pfeifer J, Temple-Smolkin RL, Voelkerding KV, Nikiforova MN. Guidelines for validation of next-generation sequencing-based oncology panels a joint consensus recommendation of the Association for Molecular Pathology and College of American pathologists. J Mol Diagn. 2017;19(3):341–365. doi: 10.1016/j.jmoldx.2017.01.011. - DOI - PMC - PubMed
    1. Dietel M, Johrens K, Laffert MV, Hummel M, Blaker H, Pfitzner BM, Lehmann A, Denkert C, Darb-Esfahani S, Lenze D, et al. A 2015 update on predictive molecular pathology and its role in targeted cancer therapy: a review focussing on clinical relevance. Cancer Gene Ther. 2015;22(9):417–430. doi: 10.1038/cgt.2015.39. - DOI - PubMed
    1. Le DT, Uram JN, Wang H, Bartlett BR, Kemberling H, Eyring AD, Skora AD, Luber BS, Azad NS, Laheru D, et al. PD-1 blockade in tumors with mismatch-repair deficiency. N Engl J Med. 2015;372(26):2509–2520. doi: 10.1056/NEJMoa1500596. - DOI - PMC - PubMed

MeSH terms

Substances

Grants and funding