. 2020 Apr 7;21(1):91.
doi: 10.1186/s13059-020-01990-9.

A multidimensional systems biology analysis of cellular senescence in aging and disease

Affiliations

A multidimensional systems biology analysis of cellular senescence in aging and disease

Roberto A Avelar et al. Genome Biol. .

Abstract

Background: Cellular senescence, a permanent state of replicative arrest in otherwise proliferating cells, is a hallmark of aging and has been linked to aging-related diseases. Many genes play a role in cellular senescence, yet a comprehensive understanding of its pathways is still lacking.

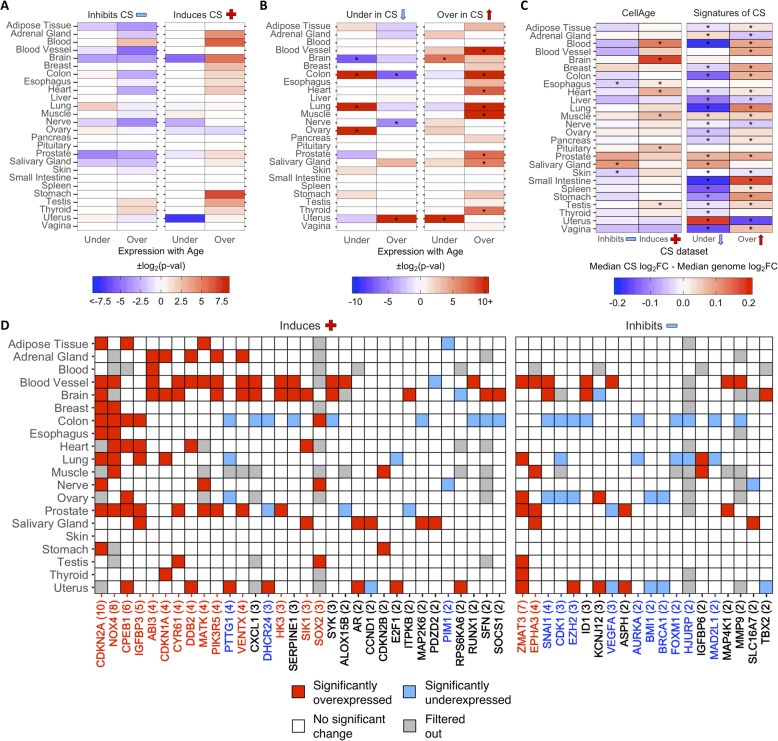
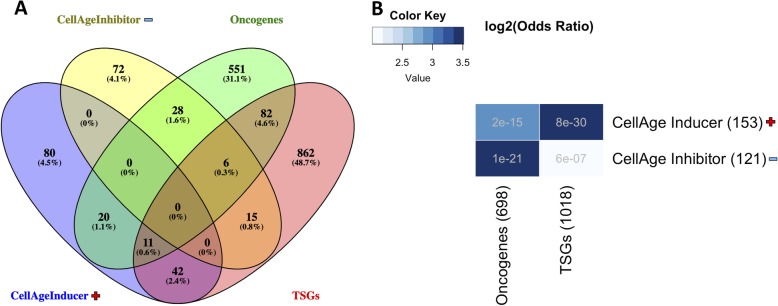
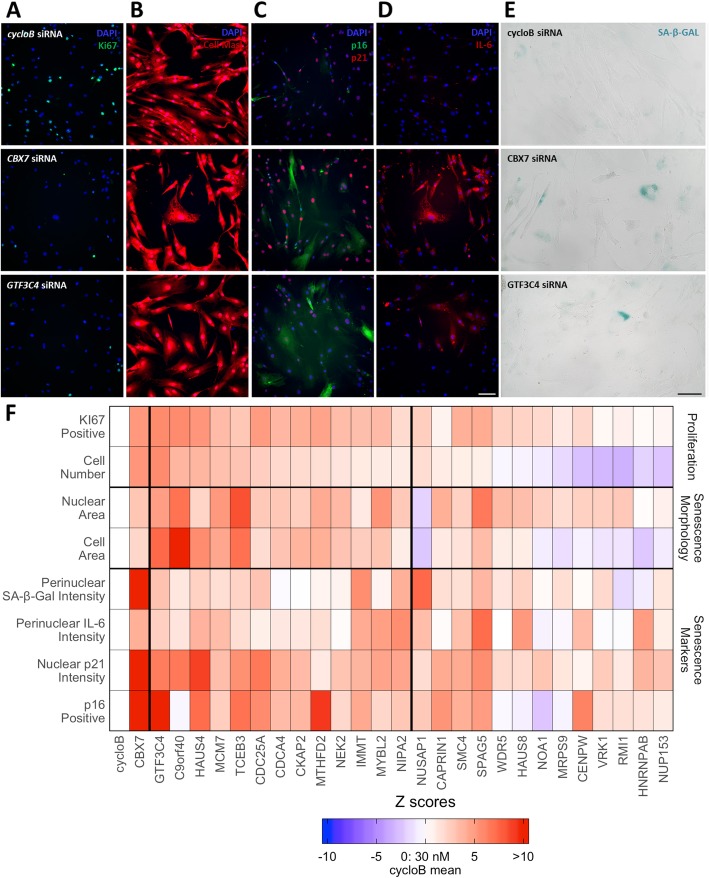
Results: We develop CellAge (http://genomics.senescence.info/cells), a manually curated database of 279 human genes driving cellular senescence, and perform various integrative analyses. Genes inducing cellular senescence tend to be overexpressed with age in human tissues and are significantly overrepresented in anti-longevity and tumor-suppressor genes, while genes inhibiting cellular senescence overlap with pro-longevity and oncogenes. Furthermore, cellular senescence genes are strongly conserved in mammals but not in invertebrates. We also build cellular senescence protein-protein interaction and co-expression networks. Clusters in the networks are enriched for cell cycle and immunological processes. Network topological parameters also reveal novel potential cellular senescence regulators. Using siRNAs, we observe that all 26 candidates tested induce at least one marker of senescence with 13 genes (C9orf40, CDC25A, CDCA4, CKAP2, GTF3C4, HAUS4, IMMT, MCM7, MTHFD2, MYBL2, NEK2, NIPA2, and TCEB3) decreasing cell number, activating p16/p21, and undergoing morphological changes that resemble cellular senescence.

Conclusions: Overall, our work provides a benchmark resource for researchers to study cellular senescence, and our systems biology analyses reveal new insights and gene regulators of cellular senescence.

Keywords: Biogerontology; Cancer; Genetics; Longevity; Transcriptome.


Conflict of interest statement

The authors declare that they have no competing interests.

Figures

Fig. 1
Fig. 1
a The CellAge database of CS genes. The main data browser provides functionality to filter by multiple parameters like cell line and senescence type, and select genes to view details and links with other aging-related genes on the HAGR website. b Breakdown of the effects all 279 CellAge genes have on CS, and the types of CS the CellAge genes are involved in. Genes marked as “Unclear” both induce and inhibit CS depending on biological context. Numbers above bars denote the total number of genes inhibiting, inducing, or having unclear effects on CS. c Functional enrichment of the nonredundant biological processes involving the CellAge genes (p < 0.05, Fisher’s exact test with BH correction) (Additional file 1: Table S3). GO terms were clustered based on semantic similarities
Fig. 2
Fig. 2
Differential expression of a CellAge inducers and inhibitors of CS and b differentially expressed signatures of CS in human tissues with age. Red values indicate that there were more genes differentially expressed with age than expected by chance (−log2(p-val)). Blue values indicate that there were less genes differentially expressed with age than expected by chance (log2(p-val)). Asterisks (*) denote tissues with significantly more CS genes differentially expressed with age (p < 0.05, Fisher’s exact test with BH correction, abs(50*log2FC) > log2(1.5)) (Additional file 1: Table S12 and S13). c Comparison of the median log2FC and distribution of log2FC with age between the CS genes and all protein-coding genes in human tissues. Red tiles indicate that the median log2FC of the CellAge and CS genes is higher than the median log2FC of all protein-coding genes for that tissue, while blue tiles indicate that the median log2FC of the CS genes is lower than the median genome log2FC. Asterisks (*) indicate significant differences between the log2FC distribution with age of CS genes and the log2FC distribution with age of all protein-coding genes for that tissue (p < 0.05, Wilcoxon rank sum test with BH correction) (Additional file 1: Table S16). d CellAge genes differentially expressed in at least two tissues with age. Gray tiles are genes which had low basal expression levels in the given tissue and were filtered out before the differential gene expression analysis was carried out [32]. Colored tiles indicate significant differential expression with age (p < 0.05, moderated t-test with BH correction, abs(50*log2FC) > log2(1.5)). Numbers by gene names in brackets denote the number of tissues differentially expressing the CellAge gene with age. Red gene names specify that the CellAge gene was significantly overexpressed with age in more tissues than expected by chance, while blue gene names show the CellAge genes significantly underexpressed with age in more tissues than expected by chance (p < 0.05, random gene expression tissue overlap simulations) (Additional file 1: Table S17 – S20). Liver, pancreas, pituitary, spleen, small intestine, and vagina did not have any significant CS DEGs with age
Fig. 3
Fig. 3
a Overlap between CellAge inducers and inhibitors, and oncogenes and tumor-suppressing genes. b Adjusted p value and odds ratio of the overlap analysis. The number of overlapping genes in each category was significant (p < 0.05, Fisher’s exact test with BH correction). p values are shown in gray writing for each comparison. Data available in Additional file 1: Table S22 – S27
Fig. 4
Fig. 4
a Cluster analysis of the RNA-Seq Unweighted Co-expression Network. The 171 seed nodes obtained from CellAge and their first order interactors. The colours represent the breakdown of the network into clusters. The algorithm revealed 52 distinct clusters, of which we color and order the 19 clusters with the best rankings for modularity, or in the case of module 17–19, size. The CellAge nodes are colored in dark purple, appearing throughout the network. Larger nodes have higher betweenness centrality. In order of decreasing modularity, the main function clusters of the modules were related to; Spermatogenesis (Module 1), Synapse (Module 2), Cardiac muscle contraction (Module 3), Cell Cycle (Module 4), Secreted (Module 5), Tudor domain (Module 6), ATP-binding (Module 7), Symport (Sodium ion transport) (Module 8), DNA damage and repair (Module 9), transit peptide: Mitochondrion (Module 10), Steroid metabolism (Module 11), Transcription regulation (Module 12), Protein transport (Module 13), Mitochondrion (Module 14), Heme biosynthesis (Module 15), Innate immunity (Module 16), Signal peptide (Module 17), Keratinocyte (Module 18), and Transcription repression (Module 19) (Enrichment results in Additional file 1: Table S35, genes in Additional file 1: Table S36). b RNA-Seq Unweighted Co-expression Network, local clustering. Red/Orange represents nodes with high clustering coefficient, whereas pale green represents nodes with lower clustering coefficient. Degree is also weighted using node size. CellAge nodes are colored purple, and GenAge Human nodes are also shown and highlighted in bright green. The right-hand panel is an enlarged view of the left-hand panel
Fig. 5
Fig. 5
Experimental validation of 26 senescence candidates. a–e Representative images of fibroblasts following transfection with cyclophilin B siRNA (top row), CBX7 siRNA (middle row), or GFT3C4 siRNA (bottom row). a DAPI (blue) and Ki67 (green). b DAPI (blue) and Cell Mask (red). c DAPI (blue), p16 (green) and p21 (red). d DAPI (blue) and IL-6 (red). e Brightfield images following staining for SA-β-galactosidase. Size bar, 100 μm. f Heatmap of multiparameter analysis of proliferation markers (cell number and % Ki67 positive), senescence-associated morphology (cellular and nuclear area) and senescence markers (% p16 positive, p21 intensity, perinuclear IL-6 and perinuclear SA-β-galactosidase). Colors illustrate the number of Z-scores the experimental siRNA is from the cyclophilin B (cycloB) negative control mean. Data are ranked by whether or not the siRNA is a top hit (siRNAs between the thick horizontal lines), and then by the cell number Z-score. Red values indicate Z-scores that are “senescence-associated measures.” The CBX7 positive control is also shown for comparison. Data presented are from at least two independent experiments each performed with a minimum of three replicates. All Z-scores are available in Additional file 1: Table S44

References

    1. Hayflick L, Moorhead PS. The serial cultivation of human diploid cell strains. Exp Cell Res. 1961;25:585–621. - PubMed
    1. Kuilman T, Michaloglou C, Mooi WJ, Peeper DS. The essence of senescence. Genes Dev. 2010;24(22):2463–2479. - PMC - PubMed
    1. Herbig U, Jobling WA, Chen BP, Chen DJ, Sedivy JM. Telomere shortening triggers senescence of human cells through a pathway involving ATM, p53, and p21(CIP1), but not p16(INK4a) Mol Cell. 2004;14(4):501–513. - PubMed
    1. d’Adda di Fagagna F, Reaper PM, Clay-Farrace L, Fiegler H, Carr P, Von Zglinicki T, et al. A DNA damage checkpoint response in telomere-initiated senescence. Nature. 2003;426(6963):194–198. - PubMed
    1. de Magalhaes JP, Passos JF. Stress, cell senescence and organismal ageing. Mech Ageing Dev. 2018;170:2–9. - PubMed

Publication types