. 2020 Apr 20;147(8):dev184069.
doi: 10.1242/dev.184069.

Kinesin-1-mediated axonal transport of CB1 receptors is required for cannabinoid-dependent axonal growth and guidance

Affiliations

Kinesin-1-mediated axonal transport of CB1 receptors is required for cannabinoid-dependent axonal growth and guidance

Trinidad M M Saez et al. Development. .

Abstract

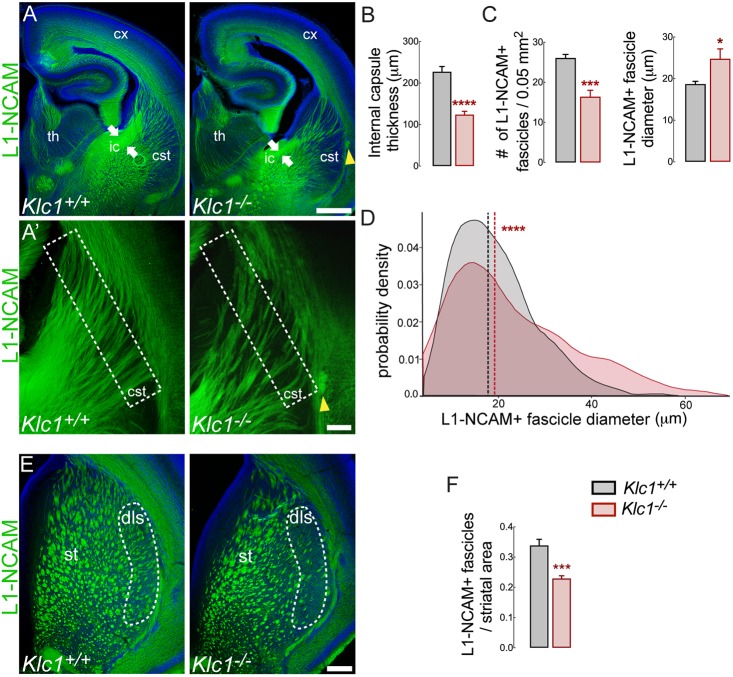
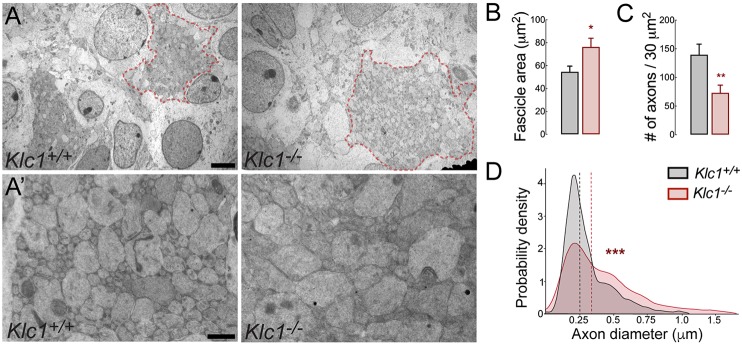
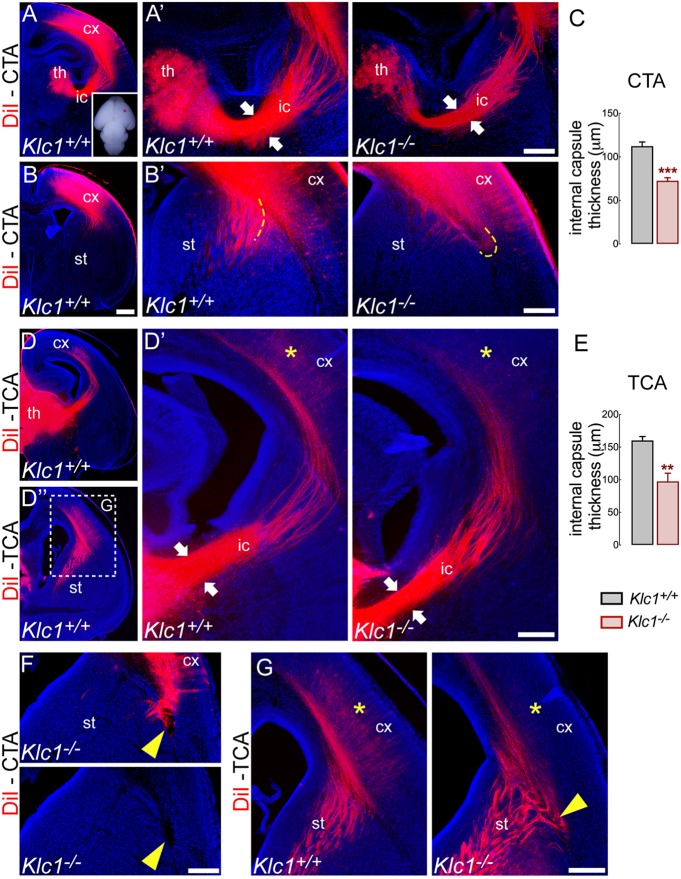
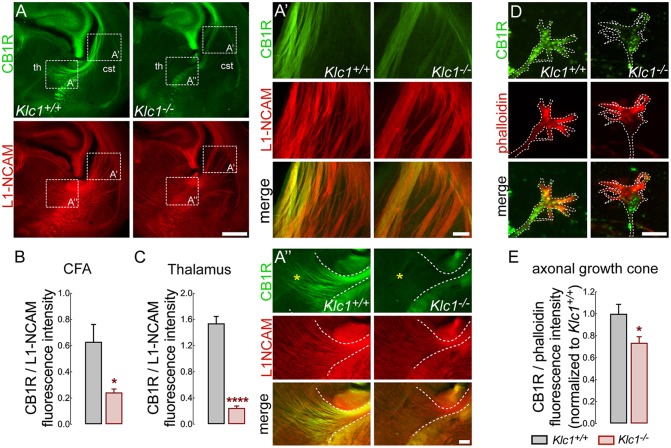
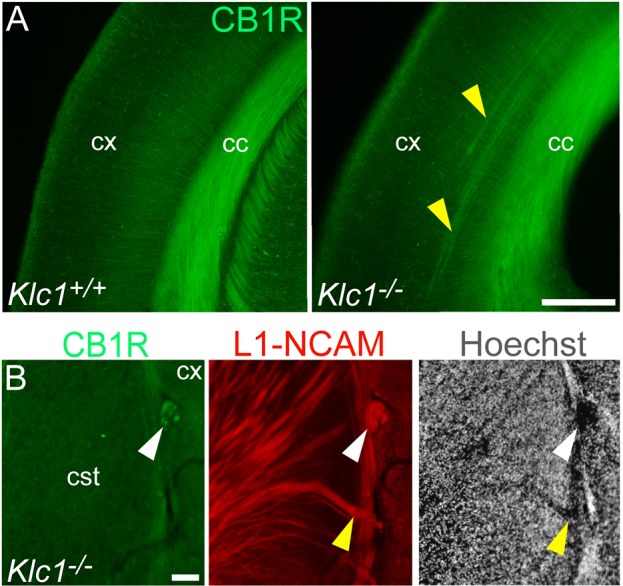
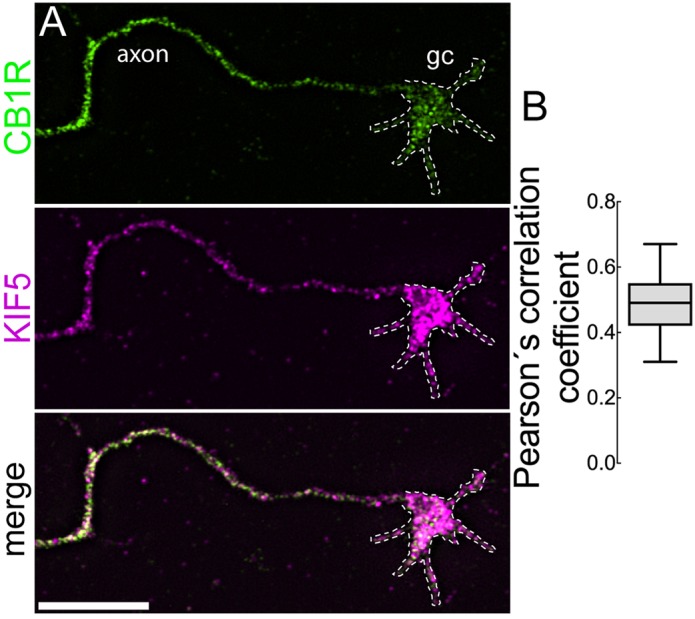
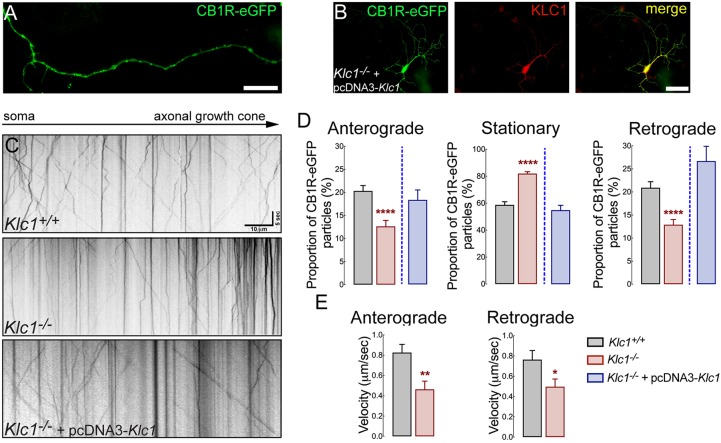
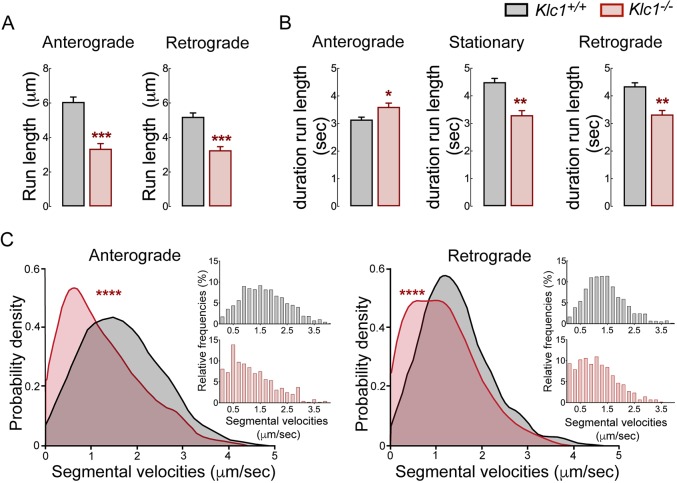
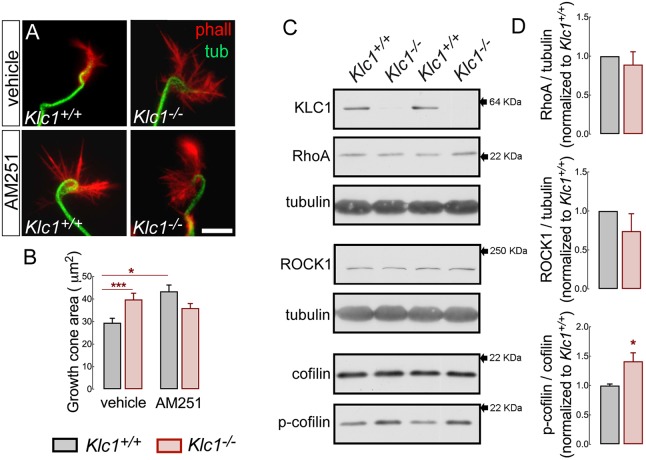
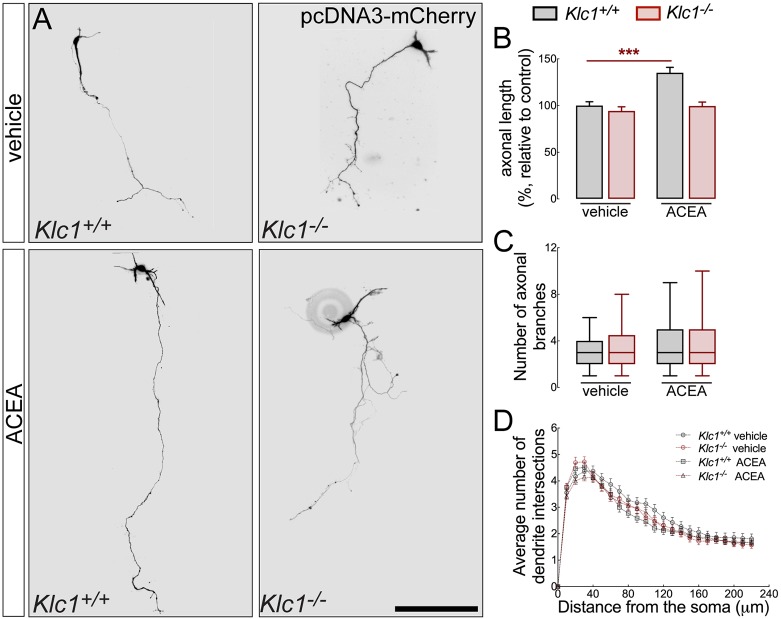
Endocannabinoids (eCB) modulate growth cone dynamics and axonal pathfinding through the stimulation of cannabinoid type-1 receptors (CB1R), the function of which depends on their delivery and precise presentation at the growth cone surface. However, the mechanism involved in the axonal transport of CB1R and its transport role in eCB signaling remains elusive. As mutations in the kinesin-1 molecular motor have been identified in patients with abnormal cortical development and impaired white matter integrity, we studied the defects in axonal pathfinding and fasciculation in mice lacking the kinesin light chain 1 (Klc1-/-) subunit of kinesin-1. Reduced levels of CB1R were found in corticofugal projections and axonal growth cones in Klc1-/- mice. By live-cell imaging of CB1R-eGFP we characterized the axonal transport of CB1R vesicles and described the defects in transport that arise after KLC1 deletion. Cofilin activation, which is necessary for actin dynamics during growth cone remodeling, is impaired in the Klc1-/- cerebral cortex. In addition, Klc1-/- neurons showed expanded growth cones that were unresponsive to CB1R-induced axonal elongation. Together, our data reveal the relevance of kinesin-1 in CB1R axonal transport and in eCB signaling during brain wiring.

Keywords: Actin; Axonal growth; Axonal pathfinding; Axonal transport; Cannabinoid; Endocannabinoids; Kinesin; Trafficking.


Conflict of interest statement

Competing interestsThe authors declare no competing or financial interests.

Figures

Fig. 1.
Fig. 1.
Axonal hyperfasciculation and pathfinding defects in Klc1−/− mice. (A) Epifluorescence images of L1-NCAM immunostaining of coronal brain sections in Klc1+/+ and Klc1−/− mice at P0. White arrows indicate internal capsule thickness. (A′) Higher magnifications of panel A showing CFA and TCA in the caudal striatum. Yellow arrowheads indicate ectopic axonal bundle. (B) Internal capsule thickness covered by L1-NCAM+ axons. (C) Number (left) and diameter (right) of individual L1-NCAM+ fascicles quantified in the area enclosed by the dashed line in A′. (D) L1-NCAM+ fascicle diameter distribution between Klc1+/+ and Klc1−/− mice. (E) L1-NCAM immunostaining of fascicles in dorsal striatum of Klc1+/+ and Klc1−/− mice at P0. Dashed line indicates dorsolateral striatum. (F) Striatal fascicle area relative to whole striatum area. Data in B, C and F are mean±s.e.m. n=8 animals/genotype from three independent experiments. *P<0.025, ***P<0.001, ****P<0.0001; Student's t-test. Data in D show probability density function; dashed lines indicate median. Klc1+/+, n=668; Klc1−/−, n=362 fascicles from eight animals/genotype from three independent experiments. ***P<0.0001; Kolmogorov–Smirnov test. Cx, cerebral cortex; cSt, caudal striatum; dls, dorsolateral striatum; ic, internal capsule; St, striatum; Th, thalamus. Scale bars: 500 μm (A); 100 μm (A′,E).
Fig. 2.
Fig. 2.
Klc1−/− brains display enlarged caliber but reduced axon number in striatal fascicles. (A) Transmission electron microscopy (TEM) images from caudal striatum of Klc1+/+ and Klc1−/− mice at P0. Klc1−/− mice display enlarged axon fascicles (area enclosed in red dashed line). (A′) Higher magnifications of TEM images of panel A showing reduced axon density but enlarged calibers in Klc1−/− mice. (B,C) Quantification of axon fascicle area (B) and axon number (C) per 30 µm2 area. (D) Quantification of axon diameter distribution. Data in B and C are mean±s.e.m. Klc1+/+, n=11-12; Klc1−/−, n=12-14 fascicles. *P<0.03, **P<0.01; Student's t-test. Data in D show probability density function analysis of pooled axon diameters; dashed lines indicate median. Klc1+/+, n=1536; Klc1−/−, n=750 axons. ***P<0.001; Kolmogorov–Smirnov test. Scale bars: 2 µm (A); 0.5 µm (A′).
Fig. 3.
Fig. 3.
Reciprocal connection between the cortex and the thalamus is impaired in Klc1−/− cemice. (A-B′) Axonal tracing with a lipophilic dye DiI placed into the primary somatosensory cortex in P0 fixed brain (inset) to label CTA. (A′) Higher magnification images of panel A showing reduced internal capsule thickness (white arrows) in Klc1−/− compared with Klc1+/+ mice. (B′) Higher-magnification images of panel B showing misrouted CTA in Klc1−/− mice (yellow dashed lines). (C) Quantification of internal capsule thickness of CTA. (D,D″) Axonal tracing with DiI placed into the dorsal thalamus in P0 mice to label TCA. (D′) Higher magnification images of panel D showing reduced internal capsule thickness (white arrows) in Klc1−/− mice. (E) Quantification of internal capsule thickness of TCA. (F,G) Ectopic CTA bundle (F) and misrouted TCA (G) were observed in Klc1−/− mice at the corticostriatal boundary (yellow arrowheads). TCA failed to reach the cerebral cortex in Klc1−/− compared with Klc1+/+ (yellow asterisks in D′ and G). Data are mean±s.e.m; n=4 animals/genotype in C, n=5 animals/genotype i E. **P<0.01, ***P<0.0001; Student's t-test. cx, cerebral cortex; ic, internal capsule; st, striatum; th, thalamus. Scale bars: 500 μm (in B for A,B,D,D″); 200 μm (A′,B′,D′,F,G).
Fig. 4.
Fig. 4.
Reduced CB1R levels in CFA and growth cones of Klc1−/−. (A) Confocal images of coronal brain sections showing CB1R and L1-NCAM double immunostaining in Klc1+/+ and Klc1−/− mice at P0. (A′,A″) Higher magnification confocal images of boxed areas in panel A showing reduced CB1R levels in CFA at the caudal striatum (A′) and in thalamic regions next to the internal capsule (A″) of Klc1−/− mice (yellow asterisks indicate thalamic region). (B,C) Quantification of CB1R fluorescence intensity normalized to L1-NCAM in in single confocal sections of CFA (B) and thalamus (C). (D) High-resolution spinning disk confocal microscopy image of primary cortical neurons showing CB1R and phalloidin immunostaining in Klc1+/+ and Klc1−/− axonal growth cone (DIV 4). Dashed lines indicate growth cone membrane limit. (E) Quantification of fluorescence intensity of CB1R normalized to phalloidin in growth cones. Data are mean±s.e.m. Klc1+/+, n=4; Klc1−/−, n=5 (B,C) from 3-4 sections; n=60-70 growth cones/genotype from two independent experiments (E). *P<0.01, ****P<0.0001; Student's t-test. cSt, caudal striatum; ic, internal capsule; th, thalamus. Scale bars: 500 μm (A); 100 μm (A′,A″); 20 μm (D).
Fig. 5.
Fig. 5.
Misrouted axon fascicles in Klc1−/− brain are positive for CB1R. (A) Epifluorescence images of cerebral cortex showing CB1R immunostaining in Klc1+/+ and Klc1−/− mice at P0. (B) Higher magnification of CB1R and L1-NCAM immunostaining and Hoechst in the corticostriatal boundary in Klc1−/− mice at P0. Yellow arrowheads indicate ectopic cortical axon bundles positive for CB1R. White arrowhead indicates CB1R-positive misrouted axon bundles devoid of nuclear staining. cc, corpus callosum; cSt, caudal striatum; cx, cerebral cortex. Scale bars: 200 μm (A); 50 μm (B).
Fig. 6.
Fig. 6.
CB1R vesicles colocalize with kinesin heavy chain subunits. (A) High-resolution spinning disk confocal microscopy images of primary cortical neurons immunostained for endogenous CB1R and KIF5 (DIV 4). Merged image shows CB1R and KIF5 colocalizing in vesicles from axons and growth cones (gc). (B) Quantification of colocalization between CB1R and KHC using Pearson's correlation coefficient. Data indicate median ±25th/75th percentile (box) and 5th/95th percentile (whiskers). n=14 neurons. Scale bar: 10 μm.
Fig. 7.
Fig. 7.
CB1R axonal transport is impaired in Klc1−/− neurons. (A) Epifluorescence image obtained from a live-cell movie of 7-8 DIV hippocampal neurons expressing CB1R-eGFP. (B) Hippocampal neurons co-transfected with CB1R-eGFP+pcDNA-KLC1 and immunostained for KLC1 showing KLC1 overexpression. (C) Kymographs of CB1R-eGFP transfected neurons obtained from live-cell imaging of Klc1+/+, Klc1−/−, and Klc1−/−+pcDNA-KLC1 hippocampal cultures. (D,E) Quantification of anterograde (Anter), stationary (Stat) and retrograde (Retro) proportion of CB1R-eGFP vesicles (D), and average velocities for anterograde and retrograde CB1R-eGFP vesicles (E). Data are mean±s.e.m. Klc1+/+, n=52; Klc1−/−, n=43; Klc1−/−+pcDNA-KLC1, n=34 neurons from three independent experiments. *P<0.01, **P<0.001, ****P<0.0001; Student's t-test. Scale bars: 20 μm (A); 50 μm (B).
Fig. 8.
Fig. 8.
Dynamic properties of CB1R vesicles are impaired in Klc1−/− neurons. (A,B) Anterograde (Ante), stationary (Stat) and retrograde (Retro) average run lengths (A) and run length duration (B) obtained from CB1R-eGFP vesicle single trajectories using MATLAB. Data are mean±s.e.m. Klc1+/+, n=1499 (ante), n=1487 (retro), n=1897 (stat); Klc1−/−, n=595 (ante), n=638 (retro), n=911 (stat). *P<0.01, **P<0.001, ***P<0.0001; Student's t-test. (C) Distribution of segmental velocities for anterograde and retrograde CB1R-eGFP vesicle trajectories. Insets show relative frequency distribution of segmental velocities. Data show probability density function analysis of pooled segmental velocities. Klc1+/+, n=1821 (ante), n=1729 (retro); Klc1−/−, n=482 (ante), n=556 (retro). ***P<0.00001; Kolmogorov–Smirnov test.
Fig. 9.
Fig. 9.
Abnormal growth cone rearrangement and cofilin activation in Klc1−/− cortex. (A) Epifluorescence images of axonal growth cones stained for tubulin and phalloidin (F-actin) in Klc1+/+ and Klc1−/− cortical neurons (DIV 3) treated with vehicle (DMSO) or AM251 (1 μM) for 1 h. (B) Quantification of the axonal growth cone area covered by F-actin in DMSO- or AM251-treated neurons. Data are mean±s.e.m. Klc1+/+, n=141 neurons (DMSO), n=100 (AM251); Klc1−/−, n=98 (DMSO), n=96 (AM251) from five independent experiments. *P<0.01, ***P<0.001; two-way ANOVA followed by Bonferroni post-test. (C) Immunoblot of KLC1, RhoA, ROCK1, cofilin, p-cofilin and tubulin from primary somatosensory cortex homogenates of Klc1+/+ and Klc1−/− mice at P0. (D) Quantification of protein levels of RhoA and ROCK1 normalized to tubulin, and p-cofilin normalized to total cofilin. Data are mean±s.e.m. Klc1+/+, n=5; Klc1−/−, n=6. *P<0.05; Student's t-test. Scale bar: 10 μm.
Fig. 10.
Fig. 10.
Klc1−/− neurons are unresponsive to CB1R-mediated axonal elongation. (A) Epifluorescence images of Klc1+/+ and Klc1−/− primary cortical neurons transfected with pcDNA3-Cherry and treated for 72 hours with DMSO (vehicle) or CB1R selective agonist ACEA (300 mM). (B) Axonal length quantified in pcDNA-Cherry transfected neurons. Data are mean±s.e.m. Klc1+/+, n=80 (DMSO), n=64 (ACEA); Klc1−/−, n=61 (DMSO), n=61 (ACEA) from three independent experiments. ***P<0.001; two-way ANOVA followed by Bonferroni post-test. (C) Quantification of the number of primary axonal branches. Data indicate median ±25th/75th percentile (box) and 5th/95th percentile (whiskers). (D) Sholl analysis to quantify the average number of dendrite intersections. Data are mean±s.e.m. Klc1+/+, n=84 (DMSO), n=66 (ACEA); Klc1−/−, n=83 (DMSO), n=94 (ACEA) neurons from three independent experiments. Scale bar: 200 μm.

References

    1. Alloatti M., Bruno L. and Falzone T. L. (2018). Methods for quantitative analysis of axonal cargo transport. Methods Mol. Biol. 1727, 217-226. 10.1007/978-1-4939-7571-6_16 - DOI - PubMed
    1. Almenar-Queralt A., Falzone T. L., Shen Z., Lillo C., Killian R. L., Arreola A. S., Niederst E. D., Ng K. S., Kim S. N., Briggs S. P. et al. (2014). UV irradiation accelerates amyloid precursor protein (APP) processing and disrupts APP axonal transport. J. Neurosci. 34, 3320-3339. 10.1523/JNEUROSCI.1503-13.2014 - DOI - PMC - PubMed
    1. Alther T. A., Domanitskaya E. and Stoeckli E. T. (2016). Calsyntenin 1-mediated trafficking of axon guidance receptors regulates the switch in axonal responsiveness at a choice point. Development 143, 994-1004. 10.1242/dev.127449 - DOI - PubMed
    1. Andrianantoandro E. and Pollard T. D. (2006). Mechanism of actin filament turnover by severing and nucleation at different concentrations of ADF/cofilin. Mol. Cell 24, 13-23. 10.1016/j.molcel.2006.08.006 - DOI - PubMed
    1. Argaw A., Duff G., Zabouri N., Cecyre B., Chaine N., Cherif H., Tea N., Lutz B., Ptito M. and Bouchard J.-F. (2011). Concerted action of CB1 cannabinoid receptor and deleted in colorectal cancer in axon guidance. J. Neurosci. 31, 1489-1499. 10.1523/JNEUROSCI.4134-09.2011 - DOI - PMC - PubMed

Publication types