. 2020 Jun;32(6):1797-1819.
doi: 10.1105/tpc.19.00640. Epub 2020 Apr 7.

AthCNV: A Map of DNA Copy Number Variations in the Arabidopsis Genome

Affiliations

AthCNV: A Map of DNA Copy Number Variations in the Arabidopsis Genome

Agnieszka Zmienko et al. Plant Cell. 2020 Jun.

Abstract

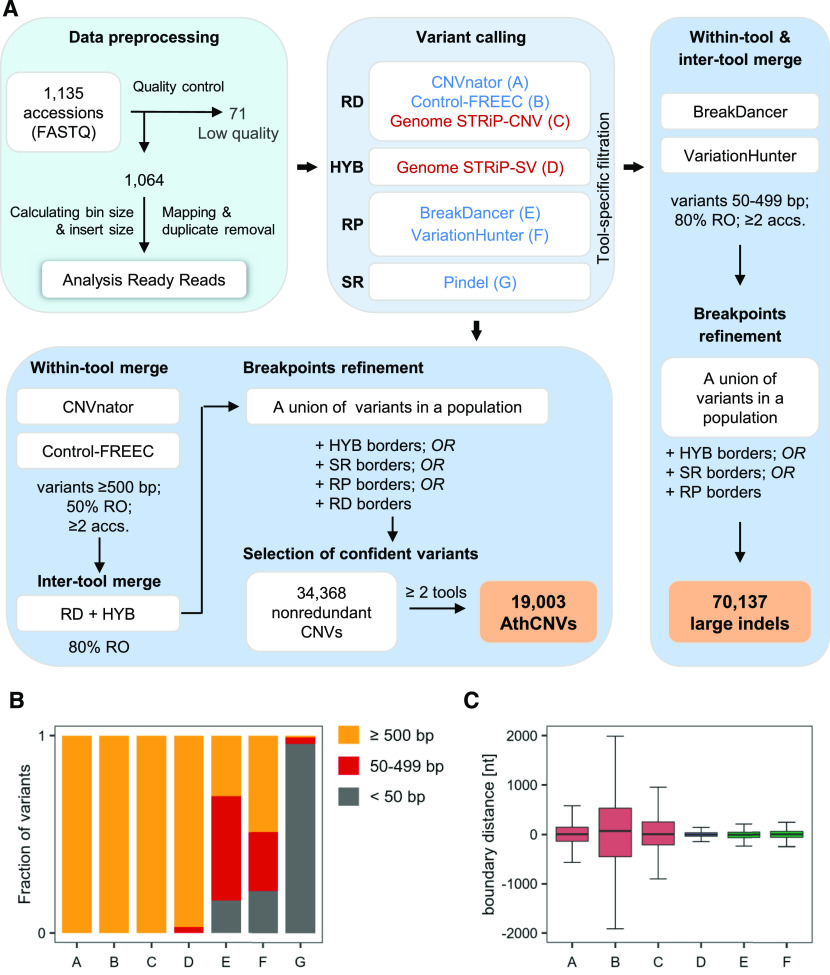
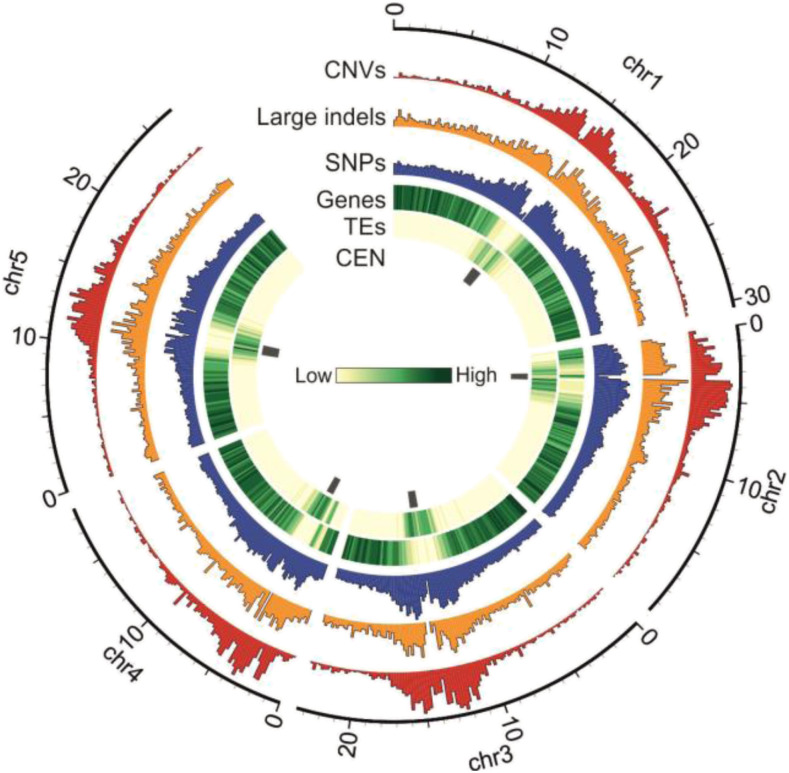
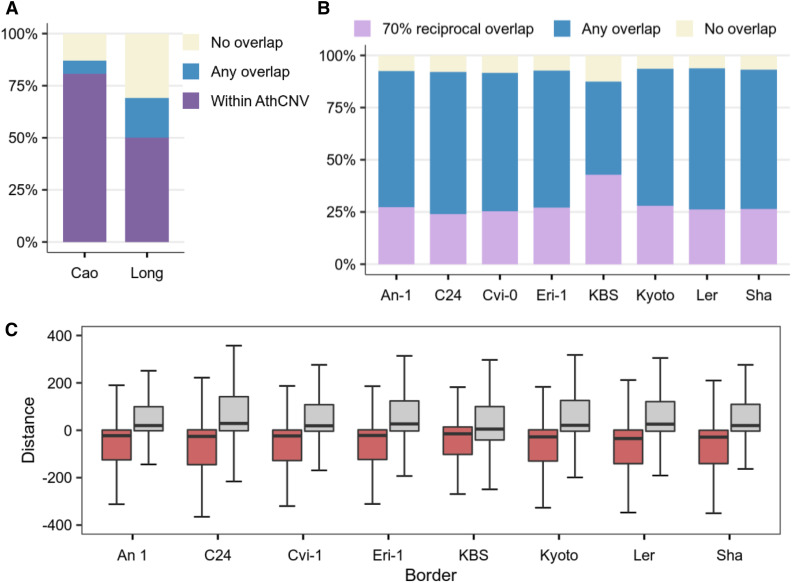
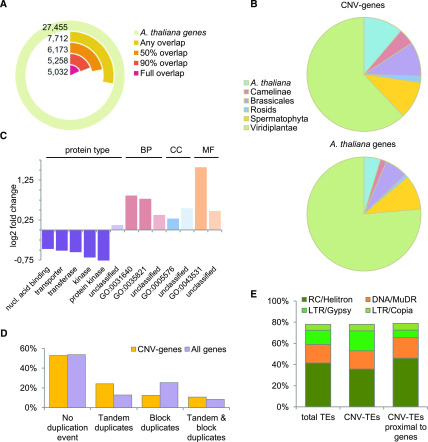
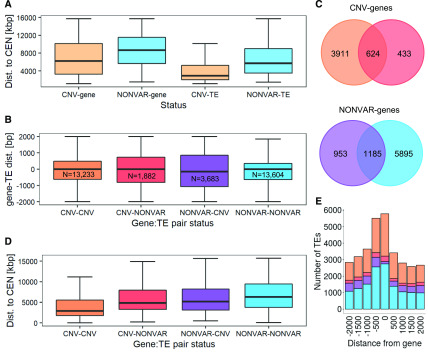
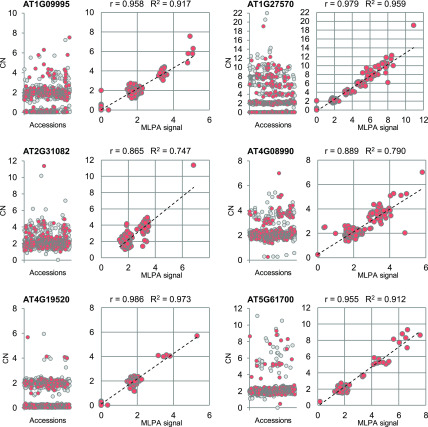
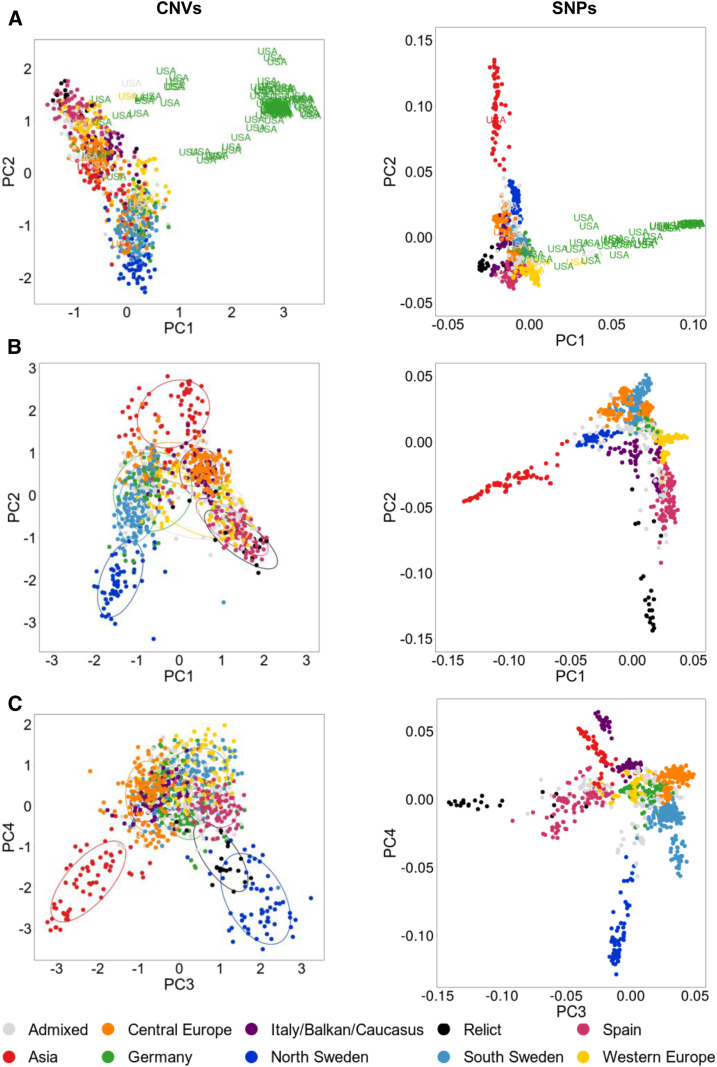
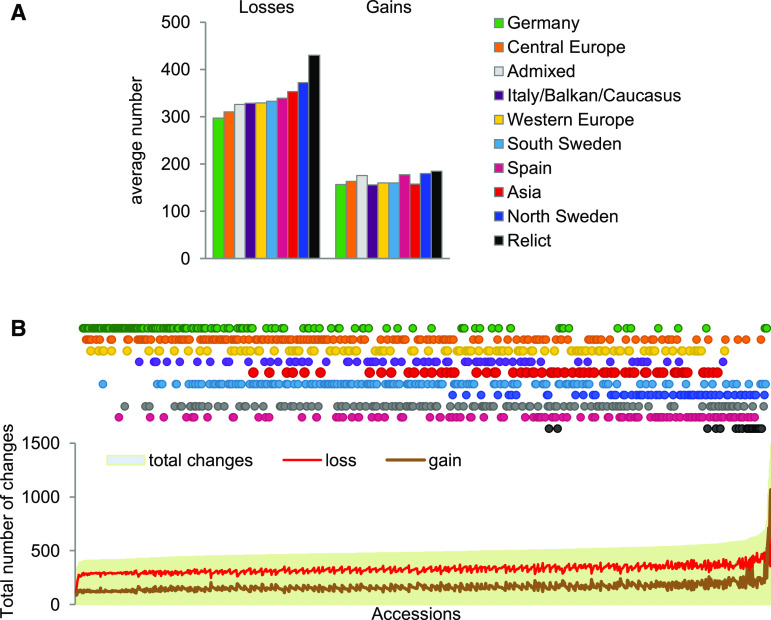
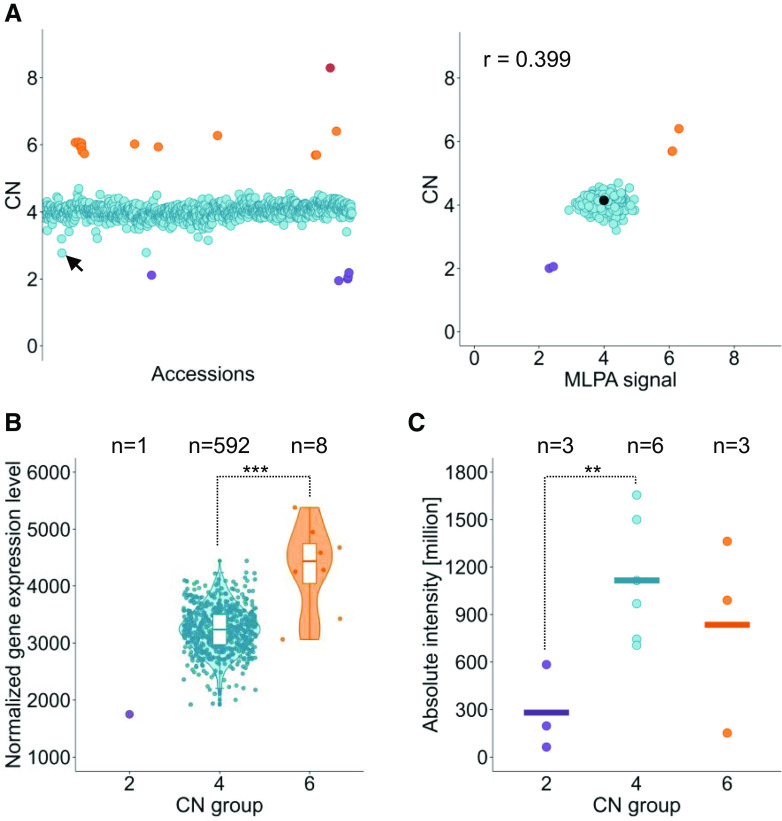
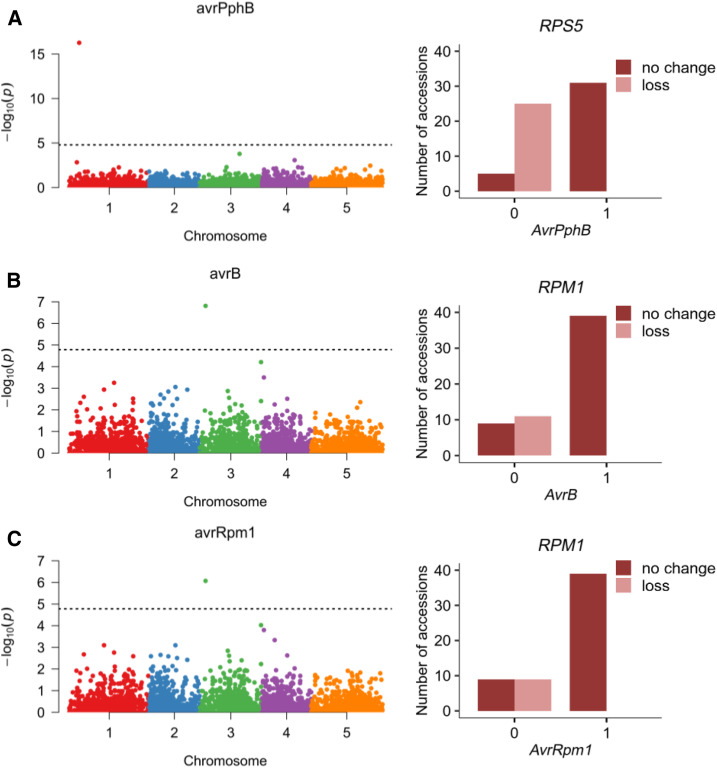
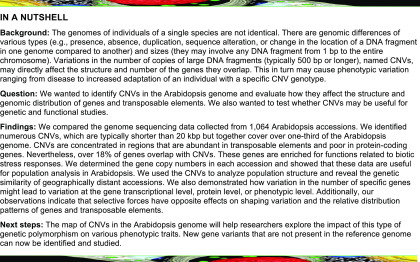
Copy number variations (CNVs) greatly contribute to intraspecies genetic polymorphism and phenotypic diversity. Recent analyses of sequencing data for >1000 Arabidopsis (Arabidopsis thaliana) accessions focused on small variations and did not include CNVs. Here, we performed genome-wide analysis and identified large indels (50 to 499 bp) and CNVs (500 bp and larger) in these accessions. The CNVs fully overlap with 18.3% of protein-coding genes, with enrichment for evolutionarily young genes and genes involved in stress and defense. By combining analysis of both genes and transposable elements (TEs) affected by CNVs, we revealed that the variation statuses of genes and TEs are tightly linked and jointly contribute to the unequal distribution of these elements in the genome. We also determined the gene copy numbers in a set of 1060 accessions and experimentally validated the accuracy of our predictions by multiplex ligation-dependent probe amplification assays. We then successfully used the CNVs as markers to analyze population structure and migration patterns. Finally, we examined the impact of gene dosage variation triggered by a CNV spanning the SEC10 gene on SEC10 expression at both the transcript and protein levels. The catalog of CNVs, CNV-overlapping genes, and their genotypes in a top model dicot will stimulate the exploration of the genetic basis of phenotypic variation.


Figures

Figure 1.
Figure 1.
Genome-Wide Structural Variant Discovery in an Arabidopsis Population. (A) Variant identification pipeline. The analysis involved three main stages: data preprocessing, variant calling, and merging and filtering. Variants were called with seven different tools, based on read depth (RD), read pair (RP), split read (SR), or hybrid (HYB) approach, in individual samples (blue labels) or in the entire population (red labels). The last stage depended on variant length. RO, reciprocally overlapping each other. (B) Fraction of variants of different size ranges identified by individual callers. (C) Comparison of the boundaries set by the callers for variants ≥500 bp reciprocally overlapping each other by 80%. Pindel-derived coordinates served as a reference since this tool reports variants at single-nucleotide resolution. Boxplots show median (inner line) and inner quartiles (box). Whiskers extend to the highest and lowest values no greater than 1.5 times the inner quartile range. nt, nucleotides.
Figure 2.
Figure 2.
Genomic Distribution of CNVs, Large Indels, and Short Variants in the Arabidopsis Genome. Histograms are scaled for equal height. Tracks present: CEN, pericentromeric regions; CNVs, confident CNVs discovered in this study; Genes, protein coding genes; Large indels, variants 50 to 499 bp discovered in this study; SNPs, SNPs and short indels from 1001 Genomes Project; TEs, annotated TEs.
Figure 3.
Figure 3.
Overlap of the AthCNV Data Set with Variants Identified in Small Populations and Individual Genomes. (A) Fractions of CNVs identified previously in a small, worldwide population of 80 accessions (Cao data set) and a narrow population of Swedish accessions (Long data set) that overlap with AthCNVs. (B) Fractions of CNVs detected in the genomes of individual accessions assembled de novo from long reads that overlap with AthCNVs. (C) Relative distances between the breakpoints in the AthCNVs and the breakpoints in CNVs in eight accessions (each used as a reference for AthCNV distance calculation). Boxplots depict data for pairs of variants with ≥70% reciprocal overlap. Boxplots show median (inner line) and inner quartiles (box). Whiskers extend to the highest and lowest values no greater than 1.5 times the inner quartile range.
Figure 4.
Figure 4.
Genomic Content in Regions Overlapped by AthCNVs. (A) Fractions of annotated Arabidopsis genes with various degrees of overlap with AthCNV variants. (B) Enrichment of CNV-genes that are overlapped by AthCNVs by at least 90% in the fractions of species-specific and clade-specific genes compared to that of all annotated Arabidopsis genes. (C) Over- and underrepresented protein types and GO terms among the CNV-genes, in the Biological Process (BP), Cellular Component (CC), and Molecular Function (MF) categories. All terms are either significantly enriched or depleted (binomial test with Bonferroni-corrected P-value < 0.01). The GO terms shown in the chart are killing of cells of other organism (GO:0031640), modification of morphology or physiology of other organism (GO:0035821), extracellular region (GO:0005576), and ADP binding (GO:0043531). nucl., nucleic. (D) Locations of CNV-genes in regions of tandem and block duplications in the genome compared to those of all genes. (E) Superfamily composition of Arabidopsis TEs and its comparison with all CNV-TEs and gene-proximal CNV-TEs (located within ±2-kb distance). Top-four most abundant superfamilies are presented. Class I TEs are depicted in orange; class II TEs are in different shades of green. All families are listed in Supplemental Table 4. LTR, long terminal repeat. RC, rolling cycle.
Figure 5.
Figure 5.
Links between Genes and TE Variation and Localization. (A) Distance to centromeres of genes and TEs grouped by variation status (determined based on their overlap with AthCNVs). The groups were significantly different (Wilcoxon rank sum test with continuity correction, P < 0.0001). Genetic elements localized in the pericentromeric regions were not included. dist., distance. (B) Relative distances between genes and their proximal TEs, grouped by variation status. For each gene, a proximal TE was defined as each TE overlapping with this gene (distance = 0) or overlapping region located within 2 kb upstream from the gene’s 5′ untranslated region (distance < 0) or overlapping region located within 2 kb downstream from 3′ untranslated region (distance > 0). N, number of pairs with a given variation status. dist., distance. (C) Number of unique CNV-genes and NONVAR-genes with proximal CNV-TEs and NONVAR-TEs and their overlap. (D) Gene distances to centromeres presented for gene-TE pairs differing by variation status. dist., distance. (E) Number of proximal TEs within and around genes. Colors in (B) to (E) are identical for the same groups. Boxplots in (A), (B), and (D) show median (inner line) and inner quartiles (box). Whiskers extend to the highest and lowest values no greater than 1.5 times the inner quartile range.
Figure 6.
Figure 6.
Differences between CNV-Genes, NONVAR-Genes, and Genes Covered by Low-Confidence CNVs in Terms of the Read Depth–Based Copy Number Genotypes. The genotyping data for 7031 CNV-genes (red), 4482 low-confidence CNV-genes (orange), and 14,877 NONVAR-genes (blue) were compared for four attributes: the coefficient of the CNV (CV; top left), the copy number range in a population represented by 1060 accessions (top right), and the minimum (min.) and maximum (max.) copy number values (bottom left and bottom right, respectively). For each attribute tested, CNV-genes significantly differed from the other groups (Kruskal–Wallis test, P < 0.0001, Dunn–Bonferroni post hoc method P-value < 0.0001). Boxplots show median (inner line) and inner quartiles (box). Whiskers extend to the highest and lowest values no greater than 1.5 times the inner quartile range.
Figure 7.
Figure 7.
Experimental Validation of Read Depth–Based Copy Number Genotyping Results. For each CNV-gene, two scatterplots are presented: read depth–based copy numbers (CN) for 1060 accessions (left) and the correlation of the genotype data with the MLPA results for 314 accessions (right). The same set of accessions was used in all MLPA experiments, which are labeled in red in the plots on the left. The MLPA results were scaled for each CNV-gene using Col-0 signal as a reference value (CN = 2). R, Pearson correlation coefficient; R2, coefficient of determination of linear regression.
Figure 8.
Figure 8.
Arabidopsis Population Structure Based on the Analysis of CNV Genotypes. PCA was performed on 1060 accessions and on genotyping data from 1050 CNV-PCGs (left). For comparison, another PCA was performed on the same set of accessions and 117,232 SNPs from the 1001 Genomes Project (right). (A) PC1 and PC2 components; all accessions were included. U.S. accessions assigned to the Germany subgroup were distinguished from the other samples. (B) PC1 and PC2 components; U.S. accessions from the Germany subgroup were excluded from the analysis. (C) PC3 and PC4 components; all accessions were included. The accessions in PCA plots are colored based on their 1001 Genomes Project grouping.
Figure 9.
Figure 9.
Losses and Gains in Gene Copy Number in Arabidopsis Subgroups. (A) Average number of gene copy number gains and losses in the subgroups. (B) Total number of gene copy number changes in individual accessions.
Figure 10.
Figure 10.
Prevalence of the Duplication of the SEC10 Gene and Its Effects on Transcript and Protein Levels. (A) SEC10 gene copy number in the Arabidopsis population. (Left) Read depth–based copy number (CN) genotypes plotted for 1060 accessions. (Right) Verification of the genotyping data with MLPA assays for 314 accessions. The MLPA signal was scaled to that of the Col-0 accession (marked in black, CN = 4). R, Pearson correlation coefficient. (B) Distribution of RNA-seq normalized transcript levels among accessions grouped by the copy number class. White boxplots show median (inner line) and inner quartiles (box). Whiskers extend to the highest and lowest values no greater than 1.5 times the inner quartile range, and dots represent the measurements in individual accessions. Asterisks indicate significant differences based on Welch’s t test (***, P < 0.01). Significance was not calculated for the copy number (CN) = 2 group, which included only one sample. (C) SEC10 protein levels in 3-week-old plants grouped by copy number class. Horizontal lines represent the mean protein level in each group, and the dots represent the measurements in individual accessions. Asterisks indicate significant differences based on Student’s t test (**, P < 0.05). The data were averaged from the measurements of four SEC10 peptide fragments identified by mass spectrometry. The quantification results for individual peptides are presented in Supplemental Figure 18. In each plot, the accessions are colored according to the copy number (CN) classes manually assigned based on the genotyping data: CN = 2 (purple), CN = 4 (blue), CN = 6 (orange), and CN = 8 (red). The accession with the lowest unrounded copy number assigned to the CN = 4 group is KBS-Mac-74 (marked by a black arrow in the left plot); for this accession, the presence of a tandem duplication was confirmed by a BLAST search of the SEC10 nucleotide sequence against a nanopore-based genomic assembly, confirming the correct group assignment.
Figure 11.
Figure 11.
Association of Gene Copy Number Losses in Arabidopsis with Defense Phenotypes. (A) AvrPphB phenotype. (B) AvrB phenotype. (C) AvrRpm1 phenotype. Left panels show Bonferroni-corrected P-values from association analysis; right panels show copy number allele distribution for significantly associated CNV-genes.
None

Comment in

References

    1. 1000 Genomes Project Consortium (2012). An integrated map of genetic variation from 1,092 human genomes. Nature 491: 56–65. - PMC - PubMed
    1. 1001 Genomes Consortium (2016). 1,135 Genomes reveal the global pattern of polymorphism in Arabidopsis thaliana. Cell 166: 481–491. - PMC - PubMed
    1. Abyzov A., Urban A.E., Snyder M., Gerstein M.(2011). CNVnator: An approach to discover, genotype, and characterize typical and atypical CNVs from family and population genome sequencing. Genome Res. 21: 974–984. - PMC - PubMed
    1. Alkan C., Coe B.P., Eichler E.E.(2011). Genome structural variation discovery and genotyping. Nat. Rev. Genet. 12: 363–376. - PMC - PubMed
    1. Alonso-Blanco C., Koornneef M.(2000). Naturally occurring variation in Arabidopsis: An underexploited resource for plant genetics. Trends Plant Sci. 5: 22–29. - PubMed

Publication types

MeSH terms

Substances

LinkOut - more resources