. 2020 Jun;32(6):1820-1844.
doi: 10.1105/tpc.19.00806. Epub 2020 Apr 7.

Phylotranscriptomics of the Pentapetalae Reveals Frequent Regulatory Variation in Plant Local Responses to the Fungal Pathogen Sclerotinia sclerotiorum

Affiliations

Phylotranscriptomics of the Pentapetalae Reveals Frequent Regulatory Variation in Plant Local Responses to the Fungal Pathogen Sclerotinia sclerotiorum

Justine Sucher et al. Plant Cell. 2020 Jun.

Abstract

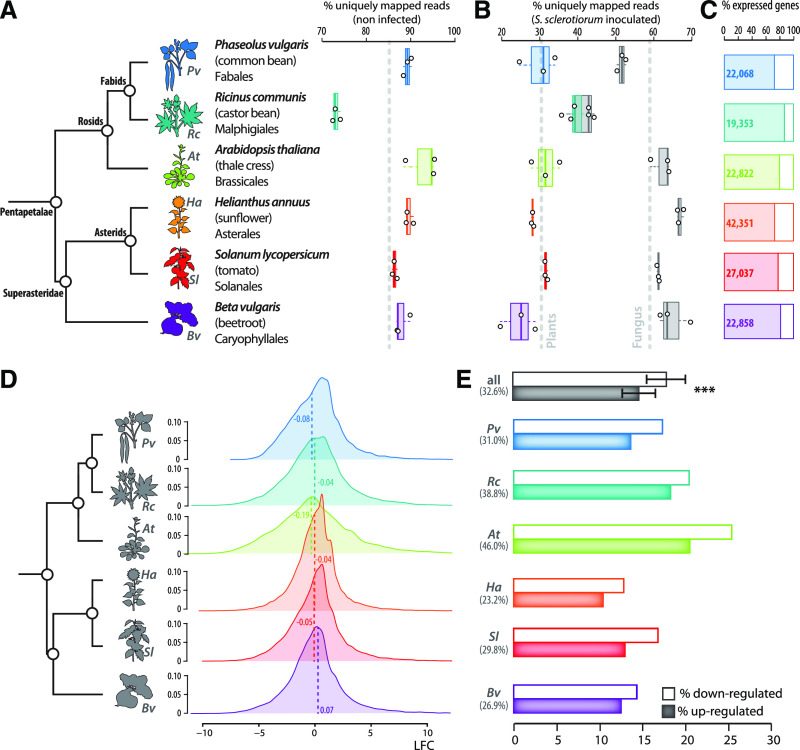
Quantitative disease resistance (QDR) is a conserved form of plant immunity that limits infections caused by a broad range of pathogens. QDR has a complex genetic determinism. The extent to which molecular components of the QDR response vary across plant species remains elusive. The fungal pathogen Sclerotinia sclerotiorum, causal agent of white mold diseases on hundreds of plant species, triggers QDR in host populations. To document the diversity of local responses to S. sclerotiorum at the molecular level, we analyzed the complete transcriptomes of six species spanning the Pentapetalae (Phaseolus vulgaris, Ricinus communis, Arabidopsis [Arabidopsis thaliana], Helianthus annuus, Solanum lycopersicum, and Beta vulgaris) inoculated with the same strain of S. sclerotiorum About one-third of plant transcriptomes responded locally to S. sclerotiorum, including a high proportion of broadly conserved genes showing frequent regulatory divergence at the interspecific level. Evolutionary inferences suggested a trend toward the acquisition of gene induction relatively recently in several lineages. Focusing on a group of ABCG transporters, we propose that exaptation by regulatory divergence contributed to the evolution of QDR. This evolutionary scenario has implications for understanding the QDR spectrum and durability. Our work provides resources for functional studies of gene regulation and QDR molecular mechanisms across the Pentapetalae.


Figures

Figure 1.
Figure 1.
Overview of Genes Responsive Locally to S. sclerotiorum Inoculation in Six Plant Species of the Pentapetalae Clade. (A) Proportion of RNA-seq reads from noninfected samples mapped to a unique position in plant genomes (% of all reads). Results from samples collected in three independent biological replicates are shown; gray dotted line shows average for all samples. (B) Proportion of RNA-seq reads from infected samples mapped to a unique position in plant genomes (colors) and S. sclerotiorum genome (gray, % of all reads). Results from samples collected in three independent biological replicates are shown; gray dotted lines show the average for all samples. (C) Proportion of plant genes expressed in all samples, both in healthy and infected plants. Labels indicate number of expressed genes (% of complete annotated transcriptomes). (D) Distribution of gene expression log2 fold change (LFC) in infected compared to healthy plants (% of transcripts). Dotted lines and labels indicate median LFC. (E) Proportion of DEGs in each species (colors) and overall (gray, % of transcripts). Plain bars correspond to the percentage of of upregulated genes, empty bars to the percentage of downregulated genes, and labels indicate the total number of DEGs per species. Error bars show sd. Boxplots show first and third quartiles (box), median (thick line), and the most dispersed values within 1.5 times the interquartile range (whiskers).
Figure 2.
Figure 2.
Distribution of Genes Differentially Expressed upon S. sclerotiorum Inoculation (DEGs) According to Gene Conservation. (A) Distribution of orthologous gene groups across species. Groups including genes from all six species are designated as core Pentapetalae, groups including genes from two to five species are designated as other orthologs, and genes not included in multi-species ortholog groups are designated as lineage specific. The number of gene group is indicated in bold, number of genes is in italics, and the proportion (% of all expressed genes) is indicated between square brackets. (B) Proportion of core Pentapetalae (Penta.) genes, lineage-specific (spe.) genes, and other ortholog (ortho.) genes in each plant genome (% of expressed genes). (C) Relative proportion of DEGs belonging to core Pentapetalae groups (dark blue), other ortholog groups (green), and lineage-specific genes (yellow). Branches of the phylogenetic tree in inset are color coded according to corresponding gene groups. Results are shown for downregulated genes only (Down), upregulated genes only (Up), or both together (All). Filled dots show proportions for Superasteridae species; open dots are for rosid species. Letters define groups of significance as determined by pairwise Student t tests (P value < 0.01). (D) Relative proportion of DEGs, either downregulated (open circles) or upregulated (filled circles), in rosids and Superasteridae species. Genes belonging to core Pentapetalae groups (dark blue); other ortholog groups (green) and lineage-specific genes (yellow) are shown separately. Letters define groups of significance as determined by pairwise Student t tests (P value < 0.01). Boxplots show first and third quartiles (box), median (thick line), and the most dispersed values within 1.5 times the interquartile range (whiskers). At, Arabidopsis; Bv, B. vulgaris; Ha, H. annuus; Pv, P. vulgaris; Rc, R. communis; Sl, S. lycopersicum.
Figure 3.
Figure 3.
Relative Increase in Upregulated Genes Inferred from the Evolutionary History of S. sclerotiorum–Responsive Transcriptomes. (A) Principles of a parsimony approach to infer gene gains and losses in the evolutionary history of the Pentapetalae. In these hypothetical examples, a gene of interest is present in lineages with a green tick and absent in lineages with a red cross. We inferred presence along branches shown in green and absence along branches shown as dotted gray lines. (B) Inferred transcriptome evolution along the phylogeny of the Pentapetalae. The size of gray circles indicates the relative total number of genes gained (solid circle, left) and lost (dotted circles, right) along each branch. The size of colored circles indicates the relative DEGs gained (solid circle, left) and lost (dotted circles, right) along each branch. The color scale represents the ratio of up/downregulated genes for gained and lost DEGs. (C) Estimated relative number of genes gained and lost per Mya along intermediate and terminal branches of the Pentapetalae phylogeny (% of Pentapetalae Core set). Estimates are given for whole genomes and DEG pools. Significance of the difference between gains and losses was assess by a paired t test. (D) Ratio between the number of genes upregulated and downregulated among DEGs gained and lost along intermediate and terminal branches of the Pentapetalae phylogeny. Significance of the difference between gains and losses was assess by a paired t test. Boxplots show first and third quartiles (box), median (thick line), and the most dispersed values within 1.5 times the interquartile range (whiskers).
Figure 4.
Figure 4.
Distribution of DEGs According to GOs. (A) and (B) Distribution of GOs enriched with upregulated genes (A) and downregulated genes (B) across species. Selected ontologies are labeled on the figure, colored according to the species in which they are enriched with DEGs. Labels are italicized for ontologies enriched both with upregulated genes and with downregulated genes. (C) Network of Biological Process GOs covering all GOBPs including expressed genes in at least one species. GOs are represented by circles sized according to the number of expressed genes per GO. GOs significantly enriched in DEGs in a chi-squared test (adjusted P value [adj. p-val] < 0.01 after Bonferroni correction for multiple testing) are colored according to their enrichment score. Ontologies discussed in the main text are labeled. At, Arabidopsis; Bv, B. vulgaris; Ha, H. annuus; Pv, P. vulgaris; Rc, R. communis; Sl, S. lycopersicum.
Figure 5.
Figure 5.
Distribution of GOs According to Their Content in Genes Upregulated upon S. sclerotiorum Inoculation and Their Content in Core Genes. (A) and (B) Number of genes annotated with GO:0009407 toxin catabolism (A) and GO:0015995 chlorophyll biosynthesis (B) that are upregulated (yellow), downregulated (blue), or not differentially expressed (white) upon S. sclerotiorum inoculation in each of the six plant species. (C) Distribution of GOBPs significantly enriched with DEGs according to the ratio of the number of core Pentapetalae genes over the number of lineage-specific genes per annotation (x axis) and the ratio of the number of upregulated genes over the number of downregulated genes per annotation (y axis). Dotted lines indicate median values for all annotations; gray areas represent the interval containing the top 10% to top 90% annotations. Circles are sized according to the number of expressed genes per annotation and colored according their enrichment with DEGs. ABA, abscisic acid; At, Arabidopsis; Bv, B. vulgaris; Ha, H. annuus; Pv, P. vulgaris; Rc, R. communis; Sl, S. lycopersicum.
Figure 6.
Figure 6.
Diversity of Gene Functions Differentially Regulated upon S. sclerotiorum Inoculation at the Interspecific Level. (A) to (C) Distribution of core Pentapetalae (Penta.) groups (A), conserved GOs (B), and conserved Pfam domains (C) according to the number of plant species in which genes are upregulated (red), downregulated (blue), or both (gray). For instance, 2.00% of the core Pentapetalae groups contain genes upregulated in all six species. The proportion of groups containing DEGs from six species are labeled. The sum of groups containing DEGs from one to five species is labeled to illustrate how frequent interspecific divergence in gene expression is. (D) Network of Biological Process GOs represented by circles sized according to the number of DEGs per GO and colored according to the number of species in which genes are upregulated for each GO. Ontologies discussed in the main text are labeled. (E) Distribution of GOs’ level in the GO hierarchy according to the number of species in which genes are upregulated. Median values are shown by a black diamond and labeled. Significance of the difference to the six-species distribution was assessed by Student’s t test, with P values shown on top the plot. (F) and (G) Pairwise correlations for the content of GOs in core Pentapetalae genes (F) or in DEGs (G) between the different plant species. Circles are sized and colored according to Spearman’s ρ. The average ρ and sd for all pairwise comparisons are indicated. (H) Overlap between the list of top 100 GOs enriched in DEGs in each of the six species. Values shown in gray are common to two to five species. (I) Number of GOs in the top 100 enriched in DEGs (red) or depleted in DEGs (gray) that are shared between all six species, between two and five species, or unique to one species. Boxplots show first and third quartiles (box), median (thick line), and the most dispersed values within 1.5 times the interquartile range (whiskers). At, Arabidopsis; Bv, B. vulgaris; Ha, H. annuus; Pv, P. vulgaris; Rc, R. communis; Sl, S. lycopersicum.
Figure 7.
Figure 7.
Analysis of Interspecific Regulatory Variation within Core Pentapetalae Gene Groups. (A) Simulated (gray) and observed (red) distributions of the number of upregulated genes in each core Pentapetalae group. Similar expression (upregulated or not) has been constrained in h = 6 to 1 species (no constraint). The deviation between observed and simulated distribution was assessed using the SSR. The lowest SSR value corresponded to h = 2 species, suggesting that constraints to maintain similar gene expression across species are weak. (B) Distribution of the CEI across 7918 core ortholog gene groups. The CEI is determined using gene expression clustering within each orthogroups and increases with the relative size of the largest expression cluster. Counts in the bottom quarter (CEI ≤ 0.33) and top quarter (CEI ≥ 0.67) of the range are labeled; red dotted line shows data set average. (C) and (D) Detailed analysis of orthogroup no. 56 with low CEI (C) and orthogroup no. 1067 with high CEI (D) value. The dotplots show log2 fold change (LFC) of expression upon S. sclerotiorum inoculation for genes in each orthogroup. Arrows points toward the position of orthogroups no. 56 and no. 1067 in the CEI distribution. Pie charts show the relative size of expression clusters (as % of orthogroup size), with the largest expression cluster labeled.
Figure 8.
Figure 8.
Extreme Regulatory Diversity and Evidence for Exaptation of an Ancestral Function into QDR in a Group of ABCG Transporters. (A) Phylogenetic relationship of 96 ABCG transporters from six Pentapetalae species covering orthogroup no. 4. The tree obtained by a maximum likelihood analysis is shown, with the number of substitutions per site used as branch length and branch support determined by an approximate likelihood-ratio test (red labels). Terminal nodes are color coded according to plant species. The circular bar plot shows gene expression log2 fold change (LFC) upon inoculation by S. sclerotiorum, in blue when significantly downregulated, in red when significantly upregulated, and in gray otherwise. Six major clades are delineated by shaded sectors, with the list of species including upregulated indicated by icons for each clade. Arabidopsis genes are labeled in green with their ABCG and PDR identifiers. Inset shows reverse cumulative distribution of orthogroups according to the delta LFC between most induced and most downregulated genes per group. Red line indicates position of orthogroup no. 4. (B) Expression LFC for 14 Arabidopsis ABCG genes upon 12 stress treatments. The size and color of bubbles relates to LFC; bubbles are outlined when genes are significantly upregulated or downregulated. Adjusted P values obtained by DESeq-2 were Bonferroni corrected for multiple testing. (C) Altered ABCG40 gene expression in Arabidopsis abcg40 insertion mutant lines. Top diagram represents ABCG40 gene structure with exons as blue boxes; red arrows indicate the position of T-DNA insertions in each line. Boxplots show ABCG40 gene expression in the healthy wild-type (Col-0) and mutant plants obtained from three or four plants per genotype measured twice. Expression is given relative to AT2G28390 housekeeping gene expression. (D) Representative pictures of leaves infected by S. sclerotiorum carrying GFP shown under UV illumination at 24 h postinoculation. Bar = 2 mm. (E) Measurements of leaf areas colonized by S. sclerotiorum 24 h postinoculation. The rlp30-1 mutant was used as a susceptibility control (Zhang et al., 2013). Significance of the difference to the wild type were assessed by Student’s t tests with Bonferroni correction for multiple testing, with P values shown in green. Boxplots show first and third quartiles (box), median (thick line), and the most dispersed values within 1.5 times the interquartile range (whiskers).
None

Comment in

References

    1. Albert I., et al. (2015). An RLP23-SOBIR1-BAK1 complex mediates NLP-triggered immunity. Nat. Plants 1: 15140. - PubMed
    1. Ando T., et al. (2018). Repeated inversions within a pannier intron drive diversification of intraspecific colour patterns of ladybird beetles. Nat. Commun. 9: 3843. - PMC - PubMed
    1. Aung K., Jiang Y., He S.Y.(2018). The role of water in plant-microbe interactions. Plant J. 93: 771–780. - PMC - PubMed
    1. Badet T., Léger O., Barascud M., Voisin D., Sadon P., Vincent R., Le Ru A., Balagué C., Roby D., Raffaele S.(2019). Expression polymorphism at the ARPC4 locus links the actin cytoskeleton with quantitative disease resistance to Sclerotinia sclerotiorum in Arabidopsis thaliana. New Phytol. 222: 480–496. - PubMed
    1. Badet T., Peyraud R., Raffaele S.(2015). Common protein sequence signatures associate with Sclerotinia borealis lifestyle and secretion in fungal pathogens of the Sclerotiniaceae. Front Plant Sci 6: 776. - PMC - PubMed

Publication types

MeSH terms

Supplementary concepts