

Prokaryotic and Viral Community Composition of Freshwater Springs in Florida, USA
- PMID: 32265327
- PMCID: PMC7157768
- DOI: 10.1128/mBio.00436-20
Prokaryotic and Viral Community Composition of Freshwater Springs in Florida, USA
Abstract
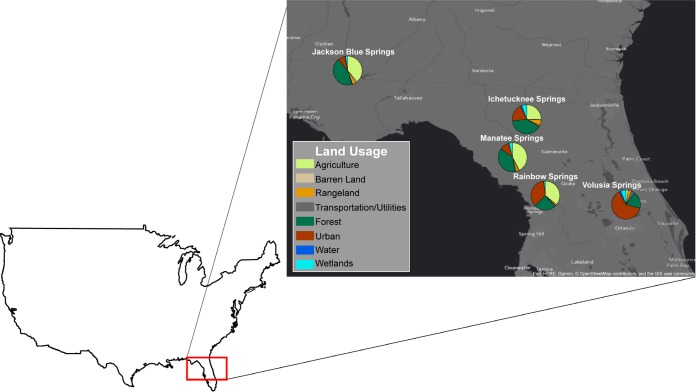
Aquifers, which are essential underground freshwater reservoirs worldwide, are understudied ecosystems that harbor diverse forms of microbial life. This study investigated the abundance and composition of prokaryotic and viral communities in the outflow of five springs across northern Florida, USA, as a proxy of microbial communities found in one of the most productive aquifers in the world, the Floridan aquifer. The average abundances of virus-like particles and prokaryotic cells were slightly lower than those reported from other groundwater systems, ranging from 9.6 × 10³ ml-1 to 1.1 × 10⁵ ml-1 and 2.2 × 10³ ml-1 to 3.4 × 10⁴ ml-1, respectively. Despite all of the springs being fed by the Floridan aquifer, sequencing of 16S rRNA genes and viral metagenomes (viromes) revealed unique communities in each spring, suggesting that groundwater microbial communities are influenced by land usage in recharge zones. The prokaryotic communities were dominated by Bacteria, and though the most abundant phyla (Proteobacteria, Cyanobacteria, and Bacteroidetes) were found in relatively high abundance across springs, variation was seen at finer taxonomic resolution. The viral sequences were most similar to those described from other aquatic environments. Sequencing resulted in the completion of 58 novel viral genomes representing members of the order Caudovirales as well as prokaryotic and eukaryotic single-stranded DNA (ssDNA) viruses. Sequences similar to those of ssDNA viruses were detected at all spring sites and dominated the identifiable sequences at one spring site, showing that these small viruses merit further investigation in groundwater systems.IMPORTANCE Aquifer systems may hold up to 40% of the total microbial biomass on Earth. However, little is known about the composition of microbial communities within these critical freshwater ecosystems. Here, we took advantage of Florida's first-magnitude springs (the highest spring classification based on water discharge), each discharging at least 246 million liters of water each day from the Floridan aquifer system (FAS), to investigate prokaryotic and viral communities from the aquifer. The FAS serves as a major source of potable water in the Southeastern United States, providing water for large cities and citizens in three states. Unfortunately, the health of the FAS and its associated springs has declined in the past few decades due to nutrient loading, increased urbanization and agricultural activity in aquifer recharge zones, and saltwater intrusion. This is the first study to describe the prokaryotic and viral communities in Florida's first-magnitude springs, providing a baseline against which to compare future ecosystem change.
Keywords: Florida; bacilladnavirus; ecology; freshwater; microbial ecology; phage; prokaryote; springs; ssDNA virus; viral; virome; virus.
Figures


References
-
- Berndt MP, Oaksford ET, Mahon GL, Schmidt W. 1998. Water resources atlas of Florida. Florida State University, Tallahassee, Florida, USA.
-
- Scott TM, Means GH, Meegan RP, Means RC, Upchurch S, Copeland R, Jones J, Roberts T, Willet A. 2004. Springs of Florida. US Geological Survey, Tallahassee, FL.
-
- Bonn M, Bell F. 2003. Economic impact of selected Florida springs on the surrounding local areas. Florida Department of Environmental Protection, Tallahassee, FL.
-
- Borisova T, Hodges AW, Stevens TJ. 2014. Economic contributions and ecosystem services of springs in the Lower Suwannee and Santa Fe River basins of North-Central Florida. University of Florida, Food and Resource Economics Department, Gainesville, FL.
-
- Miller JA. 1990. Ground water atlas of the United States Alabama, Florida, Georgia, and South Carolina (HA 730-G). US Geological Survey, Tallahassee, FL.
Publication types
MeSH terms
Substances
LinkOut - more resources
Full Text Sources
Research Materials
Miscellaneous
